
Introduction
In this article, I’m going to explain what the Execution Plans in SQL Server are and how to understand the details of an execution plan by reading the various metrics available once we hover over the components in the plan.
Being a Data Professional, it is very essential that we must understand how to write efficient queries that return faster results and how to tune the slow performing queries to achieve a boost in performance. In order to understand how the database engine works behind the scenes, we need to know the logical operations performed by the query processor. This can be done by investigating the execution plans generated by the query processor. An execution plan in SQL Server is a simple graphical representation of the operations that the query optimizer generates to calculate the most efficient way to return a set of results.
What is an Execution Plan?
As already mentioned earlier, an execution plan in SQL Server Management Studio is a graphical representation of the various steps that are involved in fetching results from the database tables. Once a query is executed, the query processing engine quickly generates multiple execution plans and selects the one which returns the results with the best performance. There are two types of execution plans to be specific –
- Estimated Execution Plan – As the name suggests, this type of execution plan is just a guess by the query processor about how the specific steps that are to be involved while returning the results. It is often generated before the query has been executed
- Actual Execution Plan – The Actual Execution Plan is generated after the query has been executed. It shows the actual operations and steps involved while executing the query. This may or may not differ from the Estimated Execution Plan
How to generate Execution Plans?
As we have learned, the Execution Plans in SQL Server can be generated before and after the query has been executed, I’m going to mention the various steps on how you can get the estimated and actual execution plans.
Estimated Execution Plans in SQL Server Management Studio
There are several ways to get the estimated execution plan in SQL Server.
- Once the query is written completely, you can hit “Ctrl + L” and it will generate the estimated execution plan
-
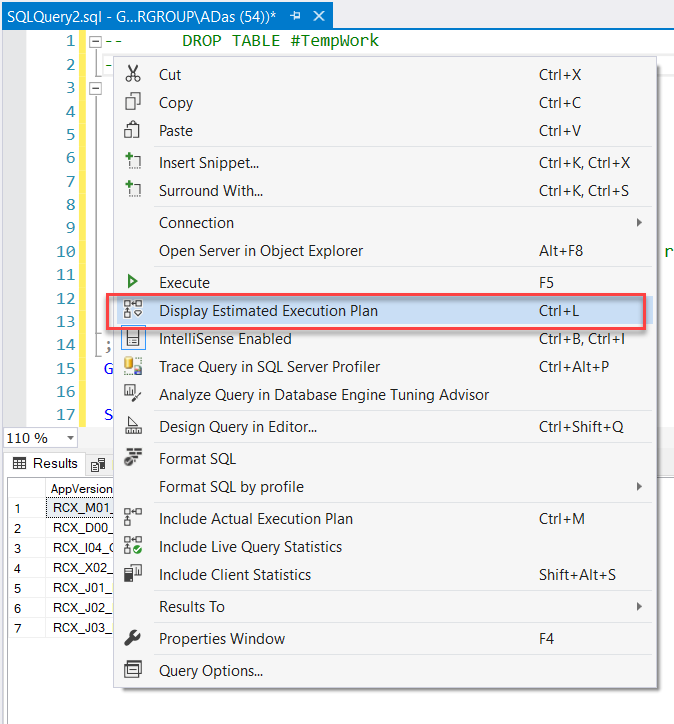
You can also right-click on the query window and select “Display Estimated Execution Plan” from the context menu that appears

Figure 1 – Display Estimated Execution Plan Context
-
Alternatively, you can directly click the “Display Estimated Execution Plan” icon which is available on the toolbar in SQL Server Management Studio
Figure 2 – Display Estimated Execution Plan Icon
Actual Execution Plans in SQL Server Management Studio
Similarly, you can follow the steps below to get the actual execution plan in SQL Server.
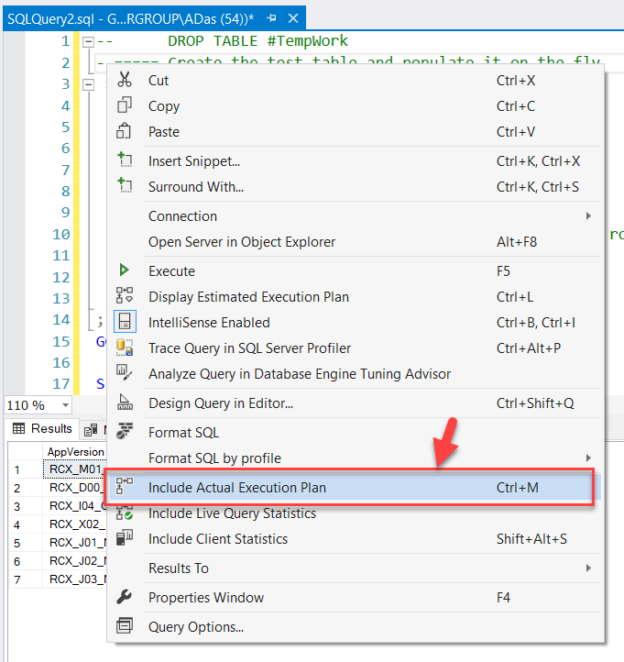
- Hit “Ctrl + M” and it will generate the actual execution plan after the query has been executed successfully
-
Right-click on the query window and select “Display Actual Execution Plan” from the context menu
Figure 3 – Display Actual Execution Plan Context
-
Alternatively, you can directly click the “Display Actual Execution Plan” icon which is available on the toolbar in SQL Server Management Studio
Figure 4 – Display Actual Execution Plan Icon

Interpreting Execution Plans in SQL Server Management Studio
Once you generate the execution plans as mentioned in the steps above, you’ll see something like the diagram below as in Figure 5. For estimated plans, it will generate as soon as you perform the step whereas for the actual execution plan it will be displayed only after the query has been executed.
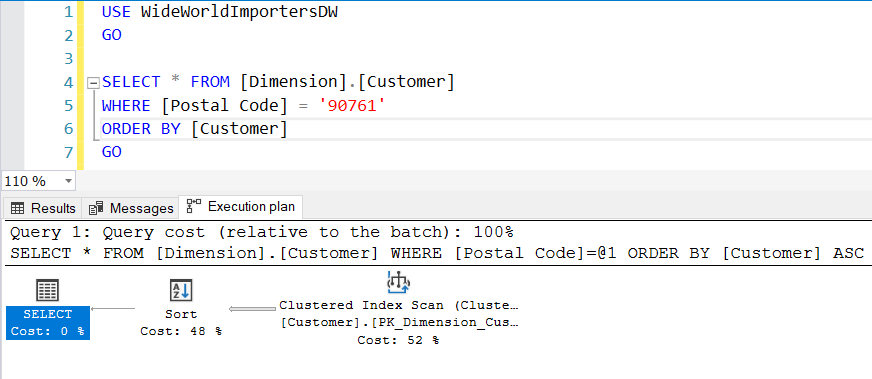
Figure 5 – Execution Plan in SQL Server
For such simple queries, the estimated execution plans are usually like the actual execution plans. For the purpose of this tutorial, we will try to understand one of the operators of the Actual Execution Plan only.
In the execution plan depicted in the above Figure 5, if you hover the cursor over the components, you can view the detailed stats for each of the operations and components being displayed in the execution plan. The plan is interpreted from right-to-left and top-to-bottom. Since our plan consists of only one single row, there is no need for the top-to-bottom approach.
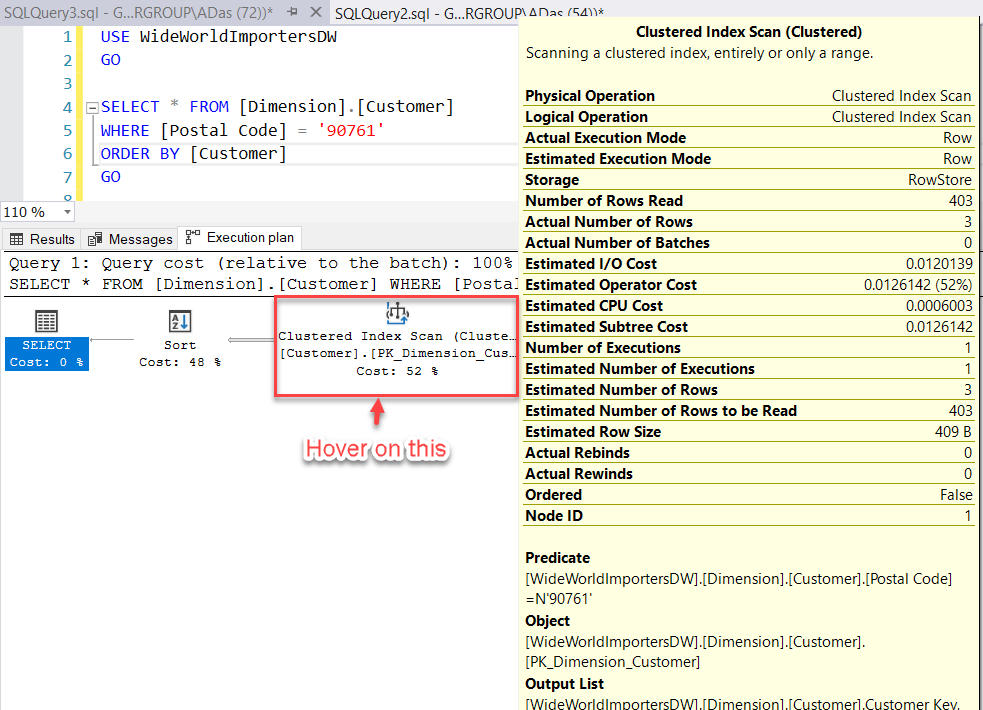
Figure 6 – Fetch Execution Plan Details
We can distinguish the execution plan into the following five steps:
- Clustered Index Scan
- Data Flow from Clustered Index Scan (Arrow)
- Sort Operator
- Data Flow from Sort Operator (Arrow)
- Select Operator
For the sake of this tutorial, let’s only understand in detail the various metrics that are being involved for the Clustered Index Scan operator. The details of the other operators can also be viewed similarly; however, the detailed explanation of the metrics of the other operators is beyond the scope of this article.
Clustered Index Scan
The first component when we traverse from right-to-left is the Clustered Index Scan component. This Index Scan is performed on the Primary Key of the table i.e. “PK_Dimension_Customer“. Let’s understand each of the metrics that are being displayed while we hover over the clustered index scan operator. You can refer to the Figure 7, for understanding more.
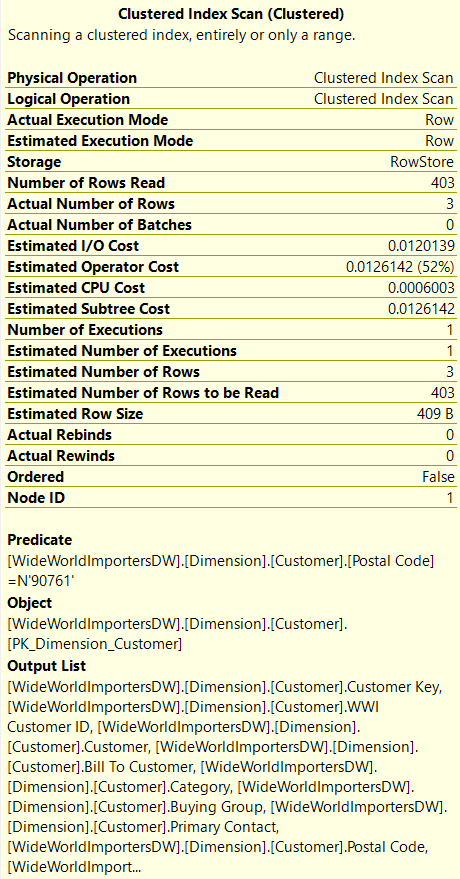
Figure 7 – Clustered Index Scan Operator
- Physical Operation: These are the operators that implement the operation as directed by the logical operators. All the physical operators are usually object which perform an operation. Some examples are Clustered Index Scan, Index Seek etc.
- Logical Operation: These operators describe the actual algebraic operation that is used to process the query. Examples are Right Anti Semi Join, Hash Join etc.
- Actual Execution Mode: This is the actual execution mode that is used by the processing engine to execute the query. Examples – Row and Batch
- Estimated Execution Mode: This is similar to Actual Execution Mode but shows the estimated value
- Storage: This tells us how the query optimizer will store the results that are being extracted by the query
- Number of Rows Read: This returns the total number of records that are being read by the operator from the table index
- Actual Number of Rows: This tells us the total number of records that have been returned based on the condition in the WHERE clause
- Actual Number of Batches: If the execution mode for the query is a batch, then it will list the number of batches being executed to fetch the results
- Estimated I/O Cost: This tells us the cost of the input/output operations of the result set
- Estimated Operator Cost: This is not an actual cost but relative information with respect to the other operators in the execution plan
- Estimated CPU Cost: The cost that the CPU will incur in order to process the operation
- Estimated Subtree Cost: The cost of the execution tree that is being currently read from right-to-left and top-to-bottom
- Number of Executions: This tells us about the number of executions that the optimizer can handle in a single batch
- Estimated Number of Executions: This is also similar to the Number of Executions just the estimated value
- Estimated Number of Rows: The number of rows that the optimizer thinks will be returned by the operator
- Estimated Number of Rows to be Read: The number of rows that the optimizer thinks will be read by the operator
- Estimated Row Size: The storage size each row in the operator
- Actual Rebinds: This tells us about how many times the reevaluation of the object must be done in order to process the operator
- Actual Rewinds: This property tells us if there were any changes in the correlated values for the object that is being processed
- Ordered: This property determines if the dataset on which the operation is to be performed in a sorted state or not
- Node ID: It is the automatic assignment of a number in the order in which the operator is called in the execution plan reading from right-to-left and top-to-bottom
Additionally, if you see below, there are these three properties that tell us more about the query and the object on which the plan is generated.
- Predicate: This is the value retrieved from the WHERE clause in the SQL statement
- Object: The table on which the operation is being performed
- Output: The selected columns are being displayed in the result set
You can also right-click any operator or arrow in the plan and select Properties to learn the more detailed explanation of the metrics displayed in the tooltip.
Saving an Execution Plan in SQL Server Management Studio
Sometimes, it is essential that after interpreting the plan generated by the query, you might want to save if for future references. SSMS provides an option to save the plan in the file system with an extension of “.sqlplan“.
In order to save an execution plan, please follow the steps below.
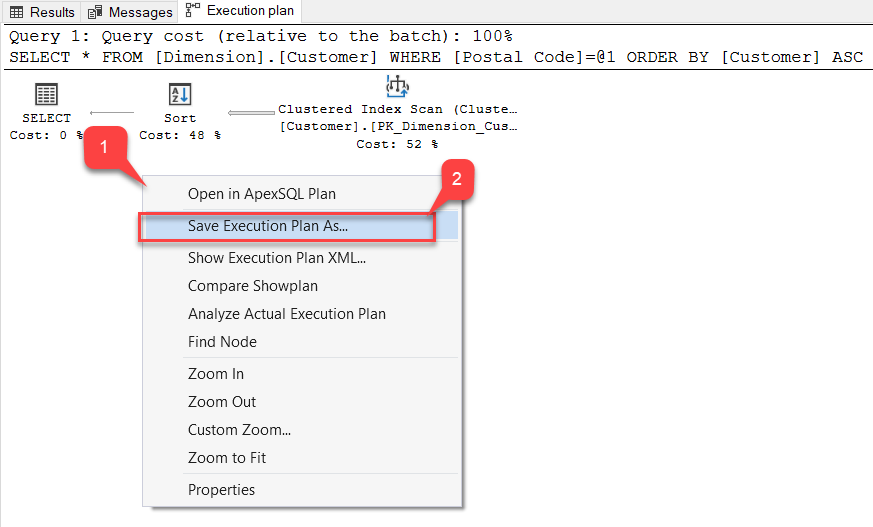
- Right-click on the plan window
-
Select Save Execution Plan As…
Figure 8 – Save the Plan As
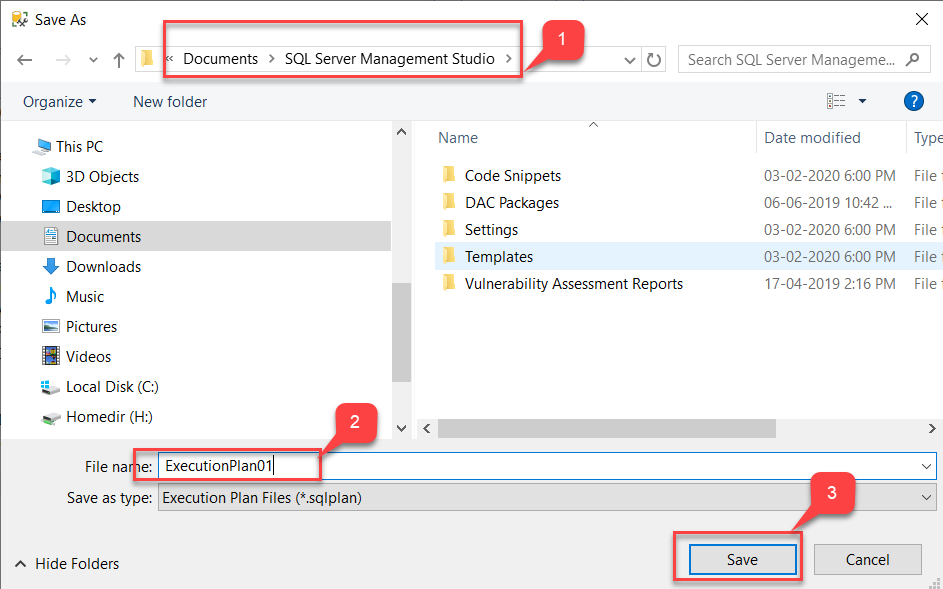
-
Select a location and provide a name for the execution plan and click on Save
Figure 9 – Saving the Plan in SQL Server Management Studio
You can open this plan as and when required.
Conclusion
In this article, we have learned what execution plans in SQL Server are and how to generate one. We also walked through various metrics that are being considered in the operators used in the plan. Finally, we have seen how to save an execution plan in SQL Server Management Studio to the file system and use it for future references.

He is a prolific author, with over 100 articles published on various technical blogs, including his own blog, and a frequent contributor to different technical forums.
In his leisure time, he enjoys amateur photography mostly street imagery and still life. Some glimpses of his work can be found on Instagram. You can also find him on LinkedIn
View all posts by Aveek Das
- Getting started with PostgreSQL on Docker - August 12, 2022
- Getting started with Spatial Data in PostgreSQL - January 13, 2022
- An overview of Power BI Incremental Refresh - December 6, 2021