
In the previous articles of this series, we discussed how to perform different types of activities using Azure Data Factory. These tasks include copying data between different data stores, running SSIS packages and transforming data before writing it to a new data store.
In this article, we will show how to monitor the different aspects of the Azure Data Factory.
Monitor Pipeline in Debug Mode
When executing a pipeline under debug mode, no execution logs will be written to the Azure Data Factory Monitor page. Instead, the execution logs for each activity within the pipeline will be written to the Output tab in the pipeline Author page.
For example, if we execute a pipeline by clicking on the Debug button, under the pipeline Author window, we can monitor the progress and the result of the pipeline execution using the information displayed in the Output, as shown below:
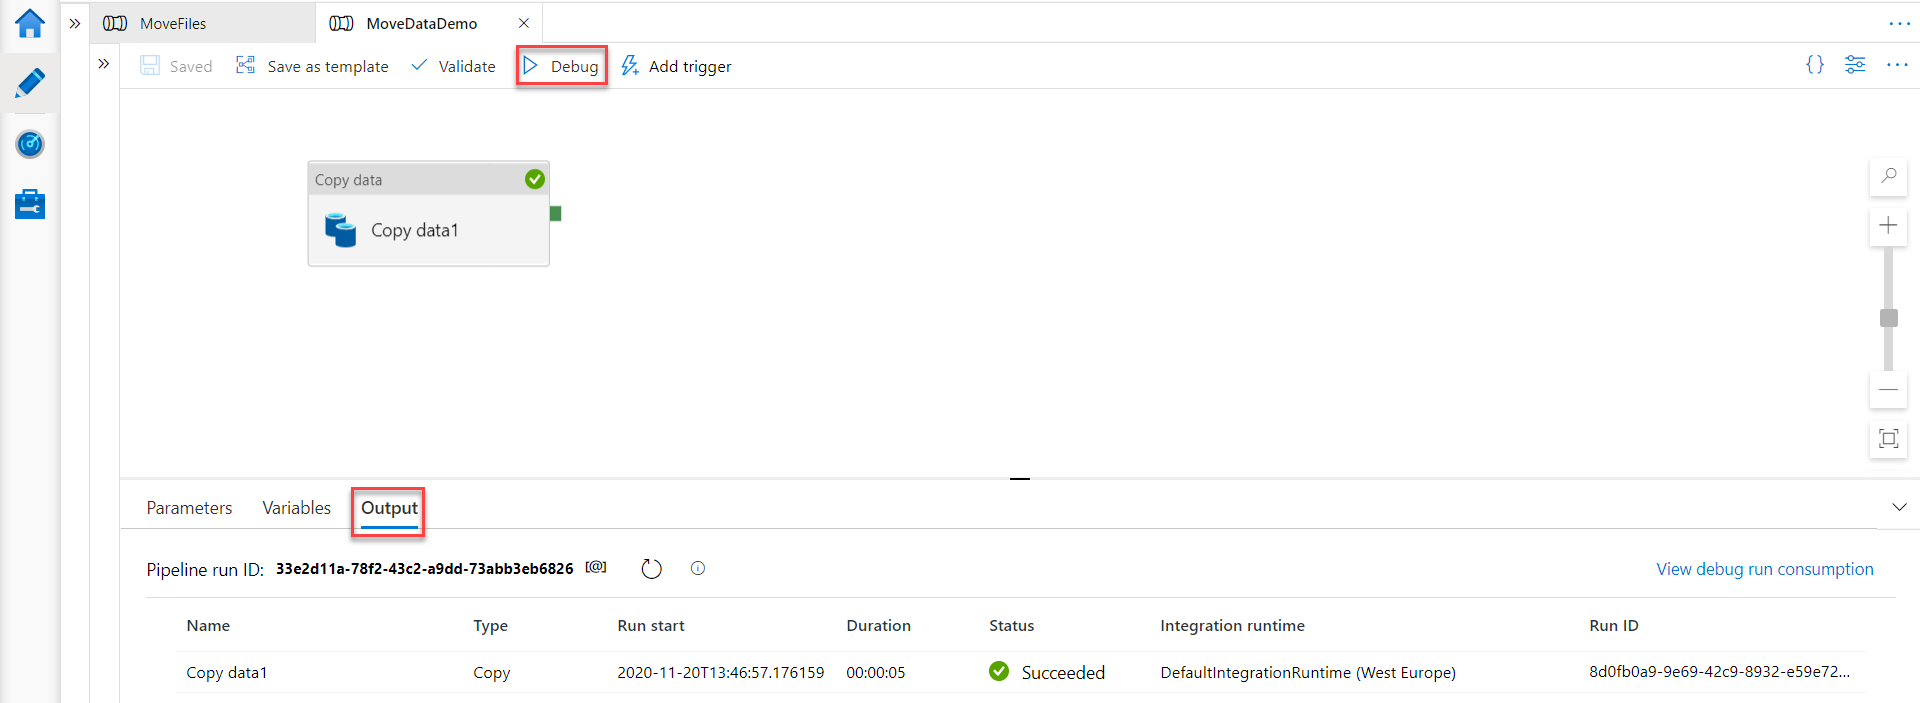
You can see from the previous image, the useful information that is displayed in the Output tab. This includes a record that logs the execution for each pipeline activity, showing the name of the executed activity, the type of that activity, the start time for the activity execution, the time it takes the activity to be executed completely, the status of the activity execution, the integration runtime that is used in the backend to execute that activity and run id for that activity execution that can be used to get more information about that activity execution.
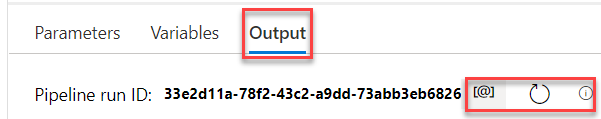
The result that is displayed in the Output tab will be automatically refreshed every 20 seconds for the first 5 minutes, with the ability to click on the “Refresh” button to manually refresh the displayed execution result for pipeline runs that are taking more than 5 minutes, as below:
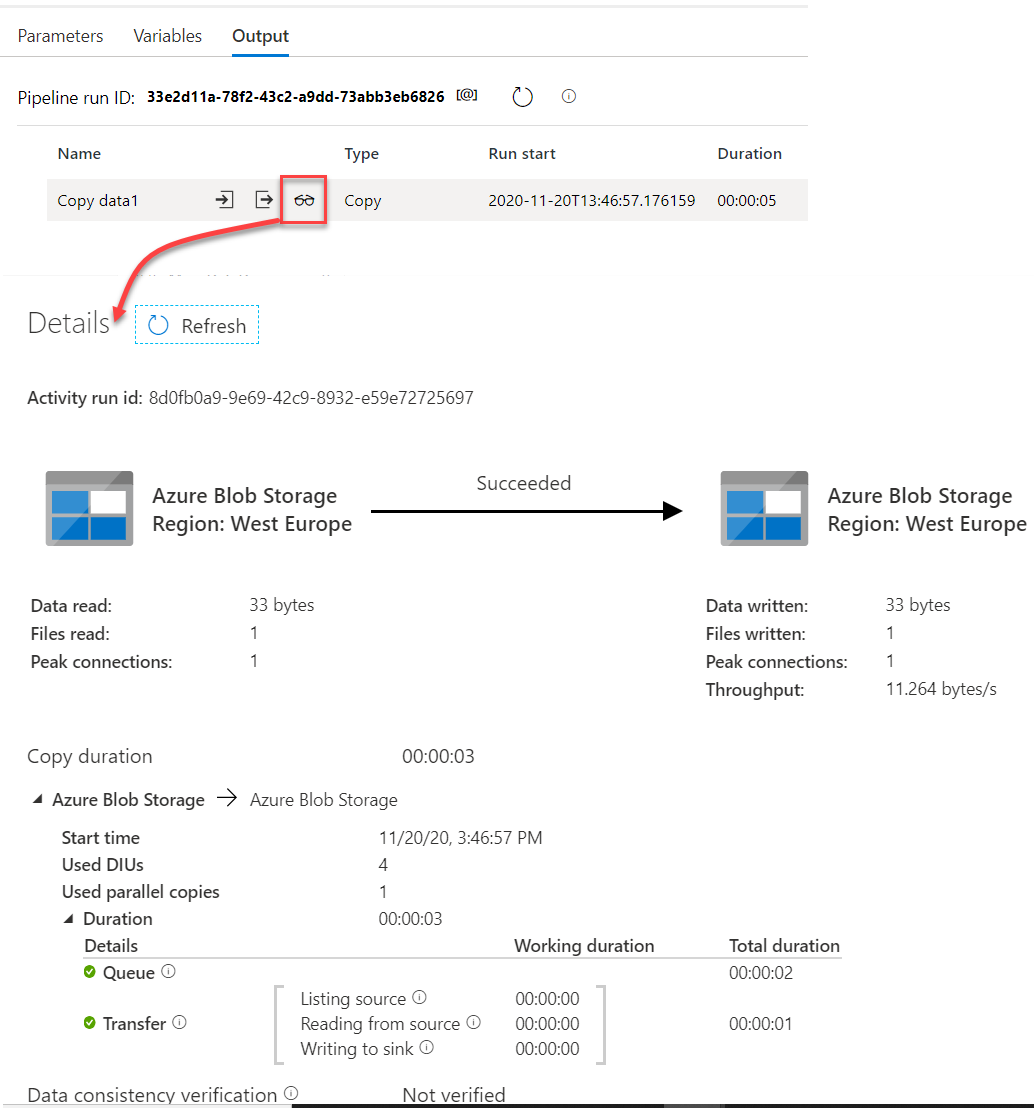
From the same magical Output tab, you can check the detailed graphical execution statistics for the executed, or
currently executing, activity by clicking on the  button beside the activity. This information includes the amount of data read from the source data store and written
to the destination datastore, the throughput for the copy operation, the time it takes to copy the data, and other
useful information that can help in troubleshooting any performance issue in the copy activity, as shown below:
button beside the activity. This information includes the amount of data read from the source data store and written
to the destination datastore, the throughput for the copy operation, the time it takes to copy the data, and other
useful information that can help in troubleshooting any performance issue in the copy activity, as shown below:
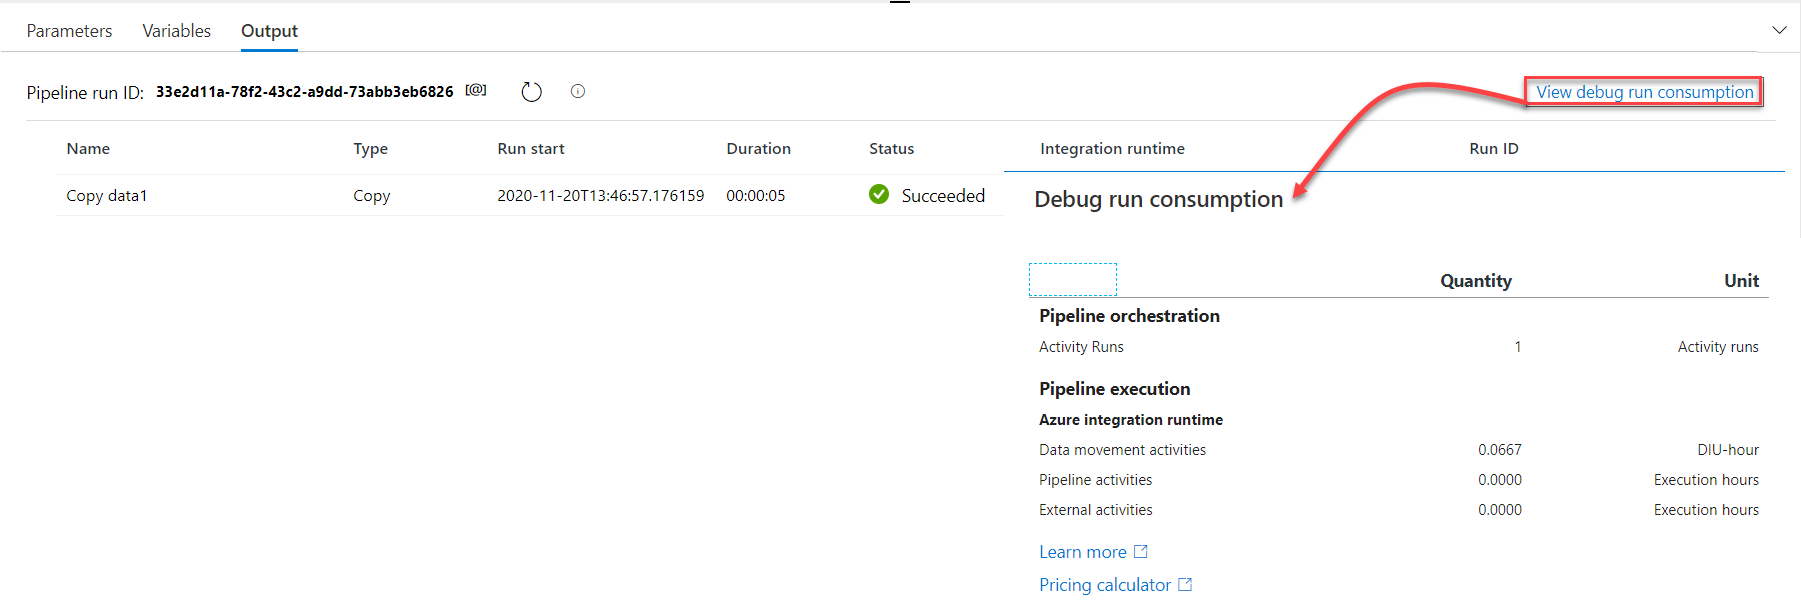
In addition to monitoring the performance of the pipeline, Azure Data Factory allows you to monitor the cost of executing the pipeline for each activity, measured in DIU unit that allows you to tune the pipeline performance and resources consumption before scheduling it, to meet the estimated budget, as shown below:
Monitor Manual Pipeline Run
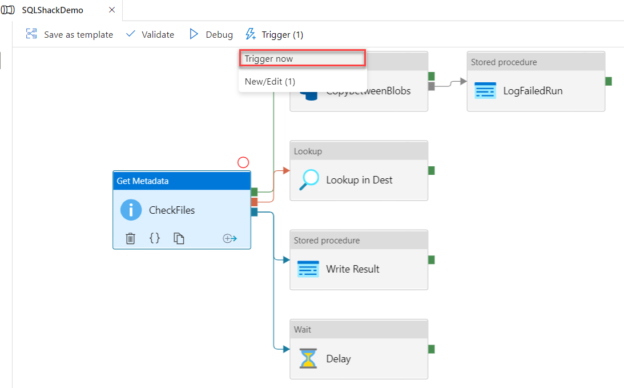
When executing the pipeline under the manual trigger method, by choosing the Trigger Now option from the Trigger button, under the pipeline Author window, as shown below:

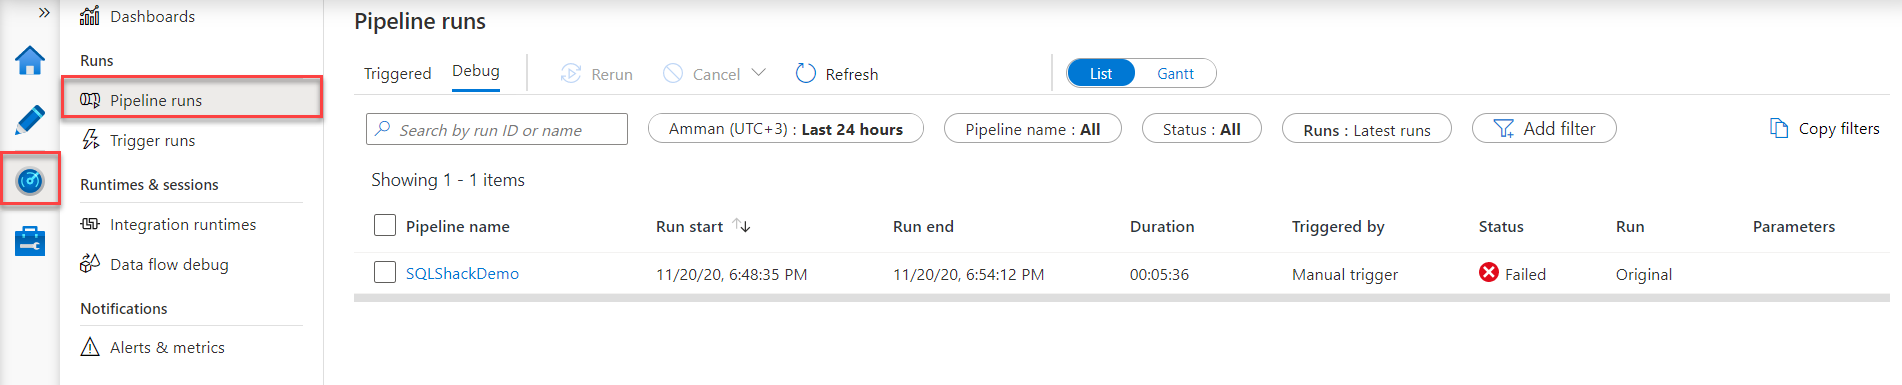
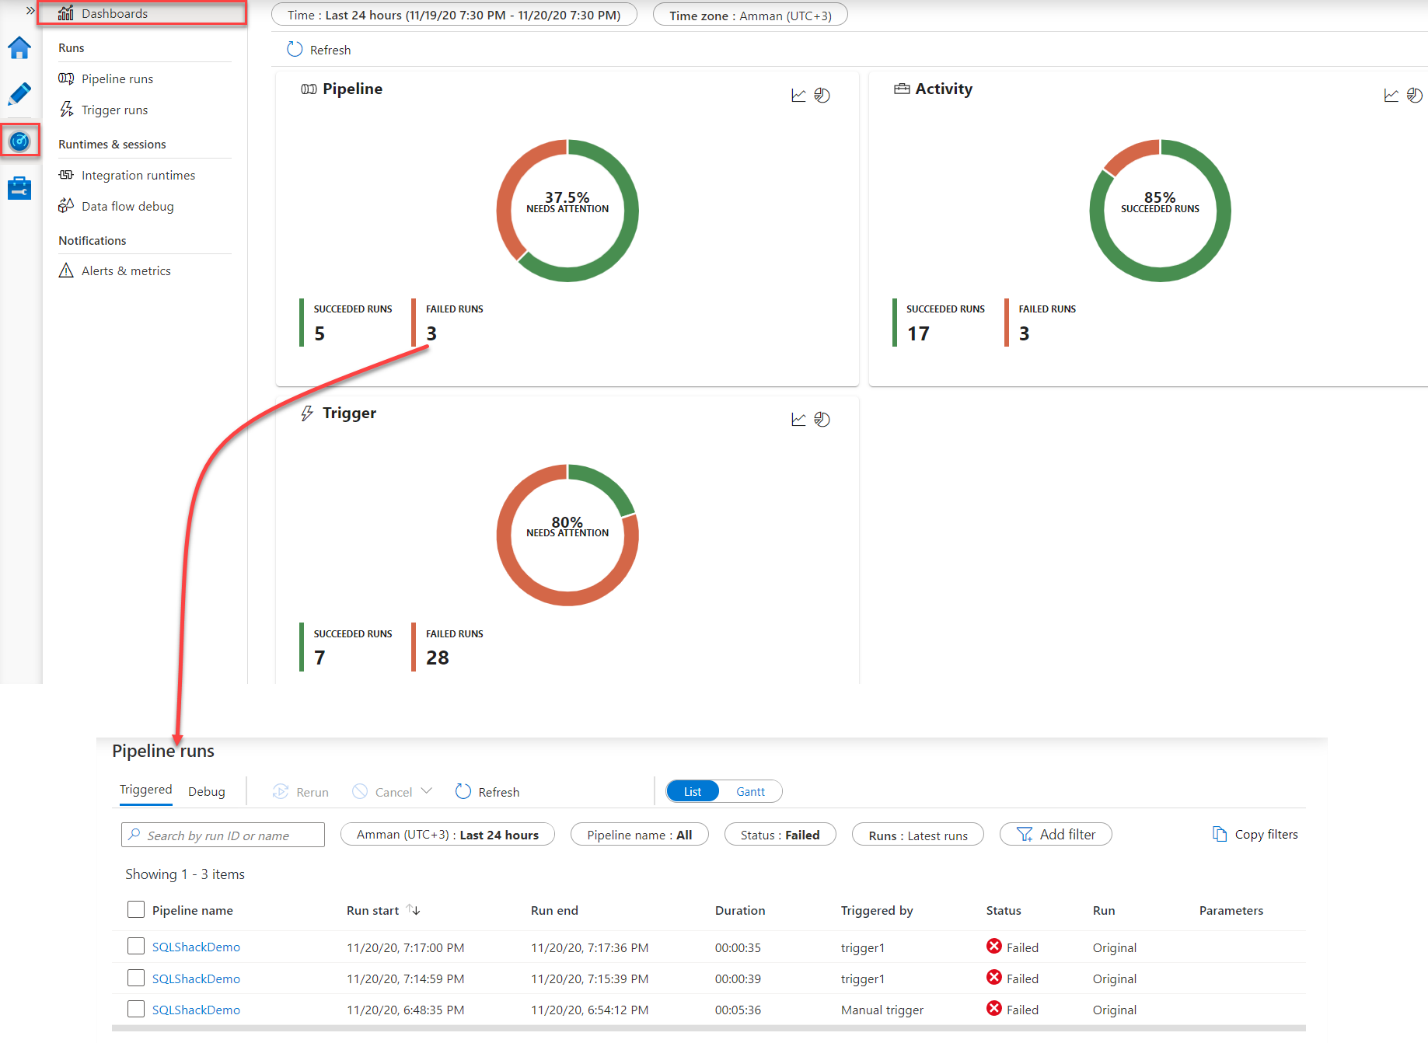
We can monitor the pipeline execution progress from the Pipeline Runs page under the Azure Data Factory Monitor window, that shows the start time, end time, duration, execution method and the execution result of the Data Factory pipeline, with the ability to search for a specific pipeline or filter for the time period, pipeline name or pipeline execution status, as shown below:
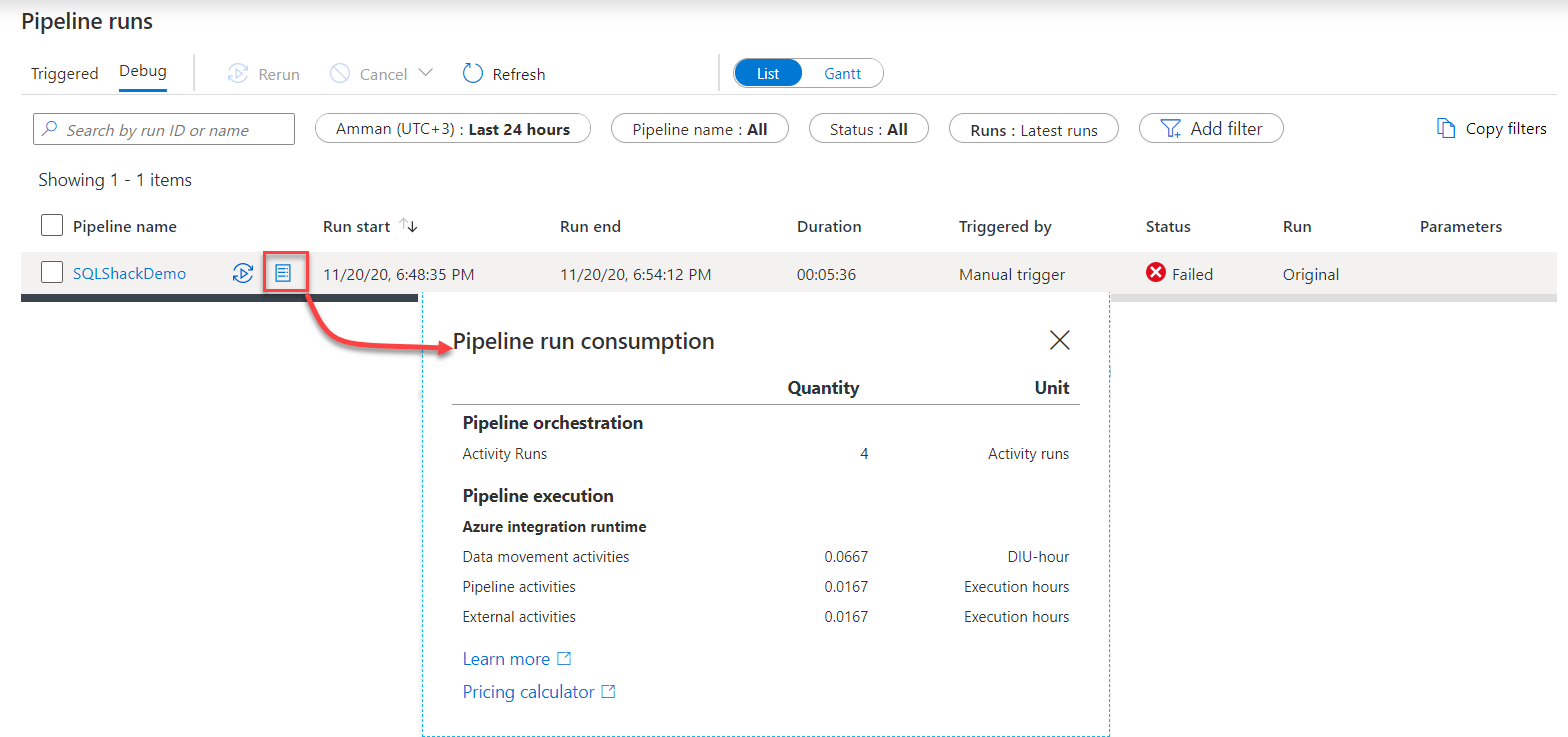
Allowing you to rerun the pipeline again, from the same window, or check the resources consumed, in the DIU unit, by the pipeline execution, as shown below:
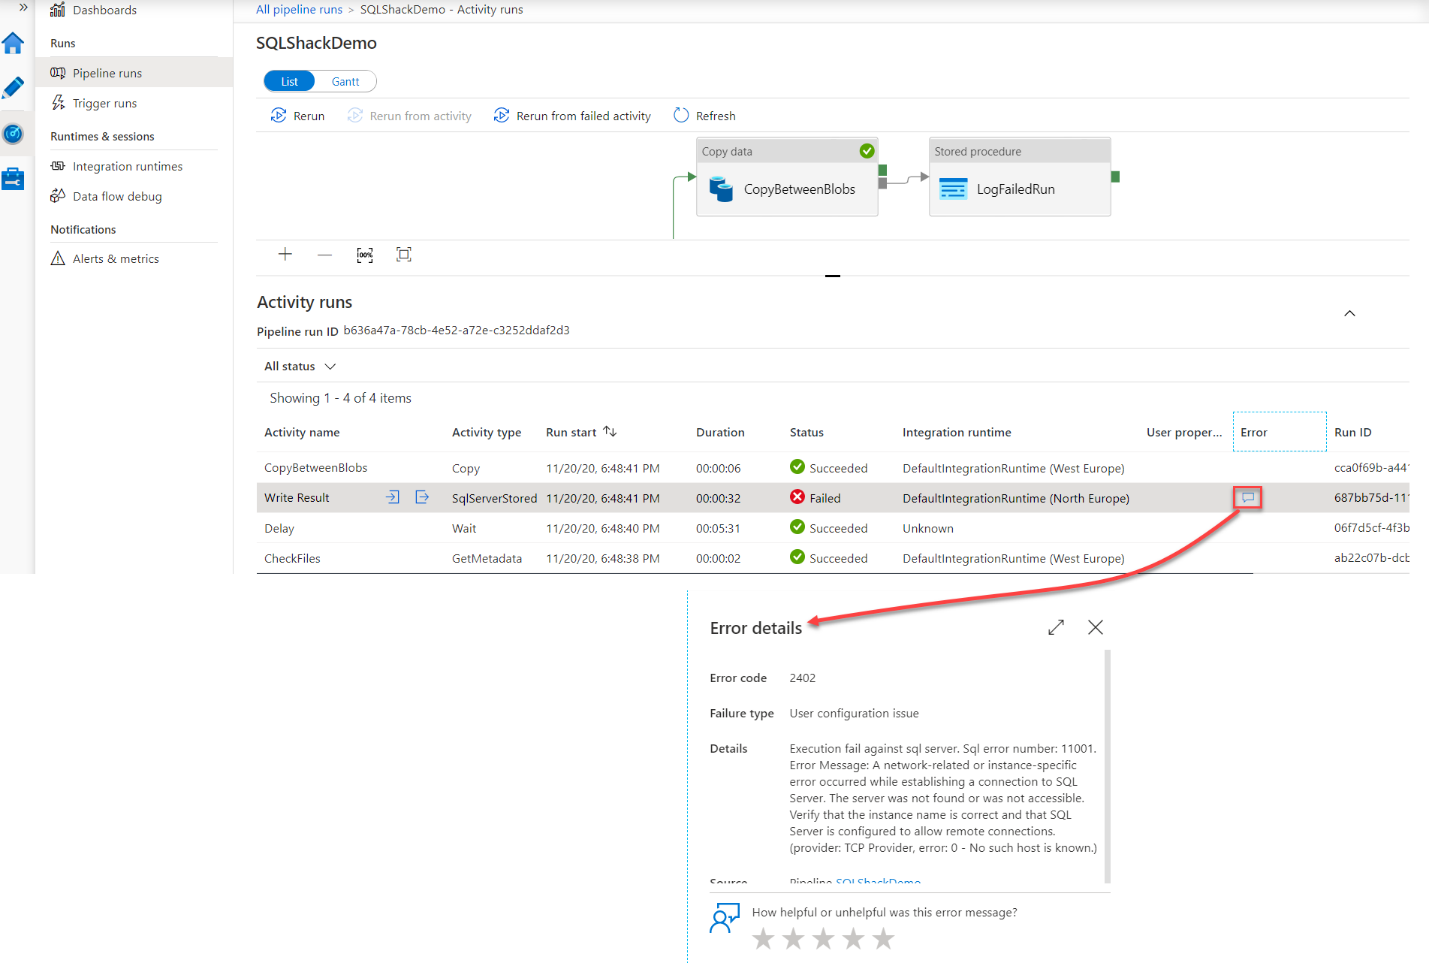
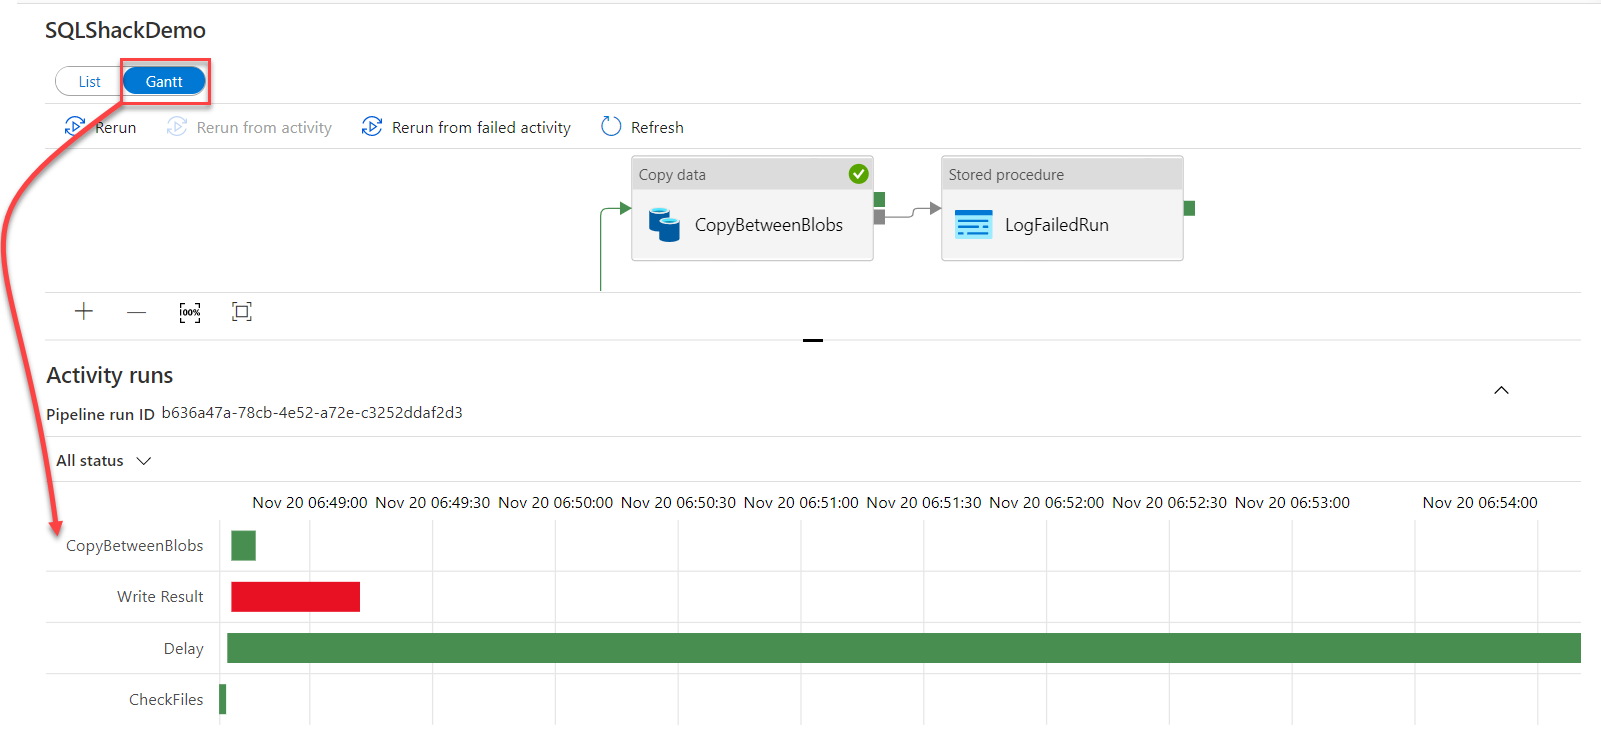
To dig deeper into the execution statistics of each pipeline activity, click on the pipeline name, that is displayed as a hyperlink, and a new window with the execution log for each pipeline activity, includes the activity name, activity type, execution start time, execution duration, execution status, the integration runtime that is used to execute the pipeline, the execution run ID for each activity for more log check and an error message beside the failed activity, for troubleshooting purposes, allowing you to rerun the failed activity if needed, as shown below:
Taking into consideration that the previous activities execution logs can be displayed also as a Gantt graph, to track the activities execution result using a timeline graph, as shown below:
Monitor Trigger Pipeline Run
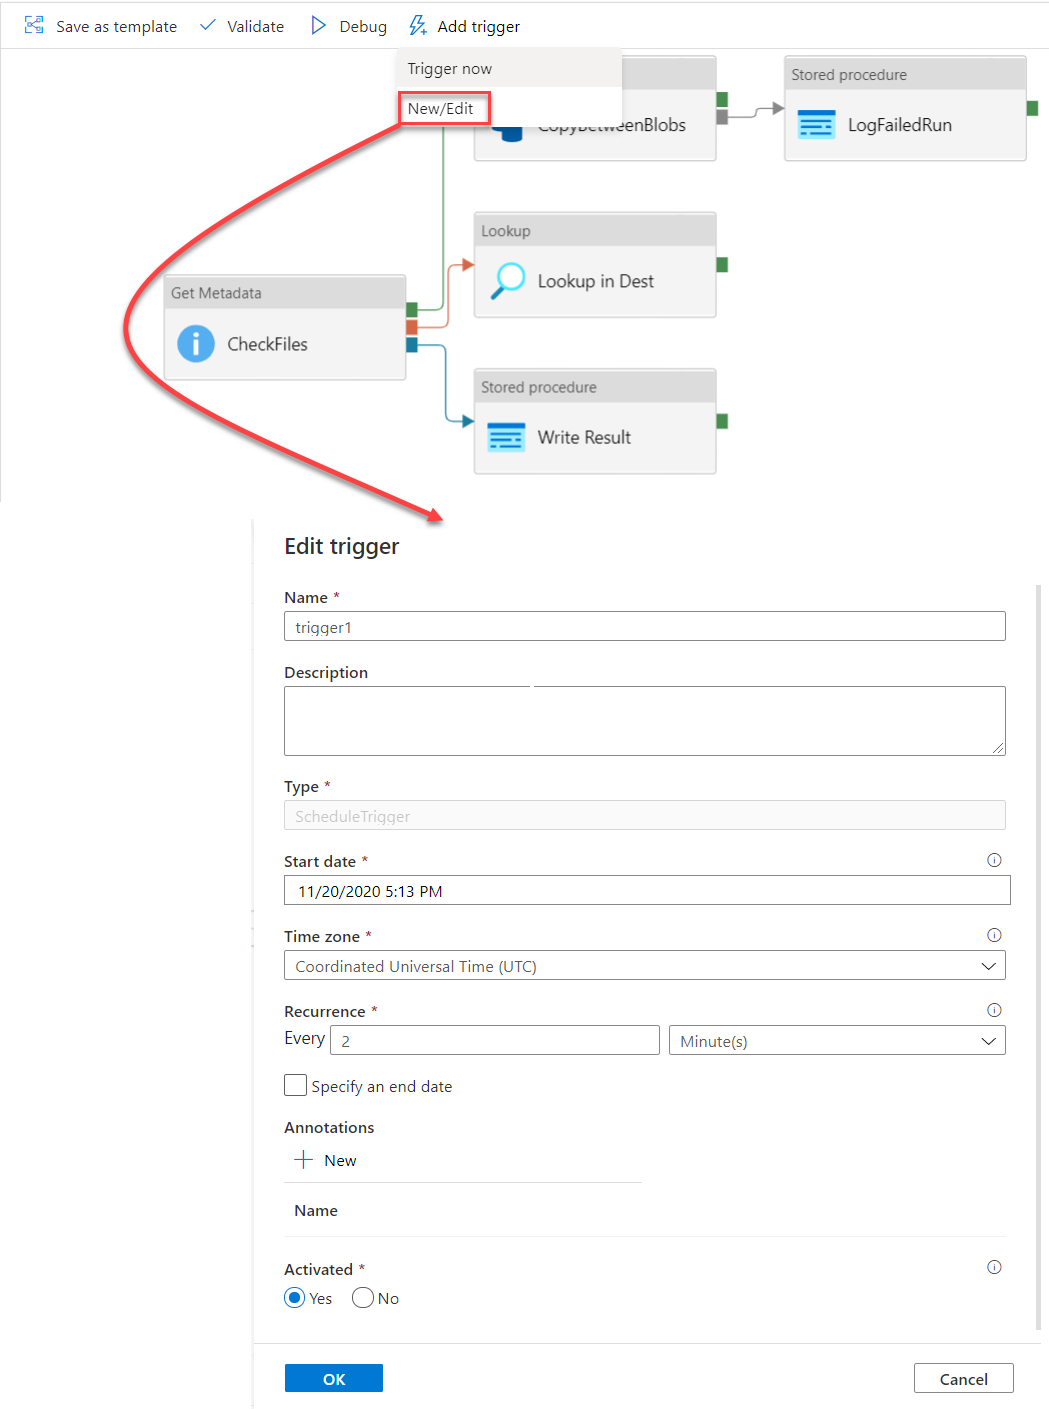
If we associate a trigger to the Data Factory pipeline with a trigger, in order to schedule the execution of the pipeline automatically, as shown in the Scheduled trigger below that will execute the pipeline every 2 minutes:
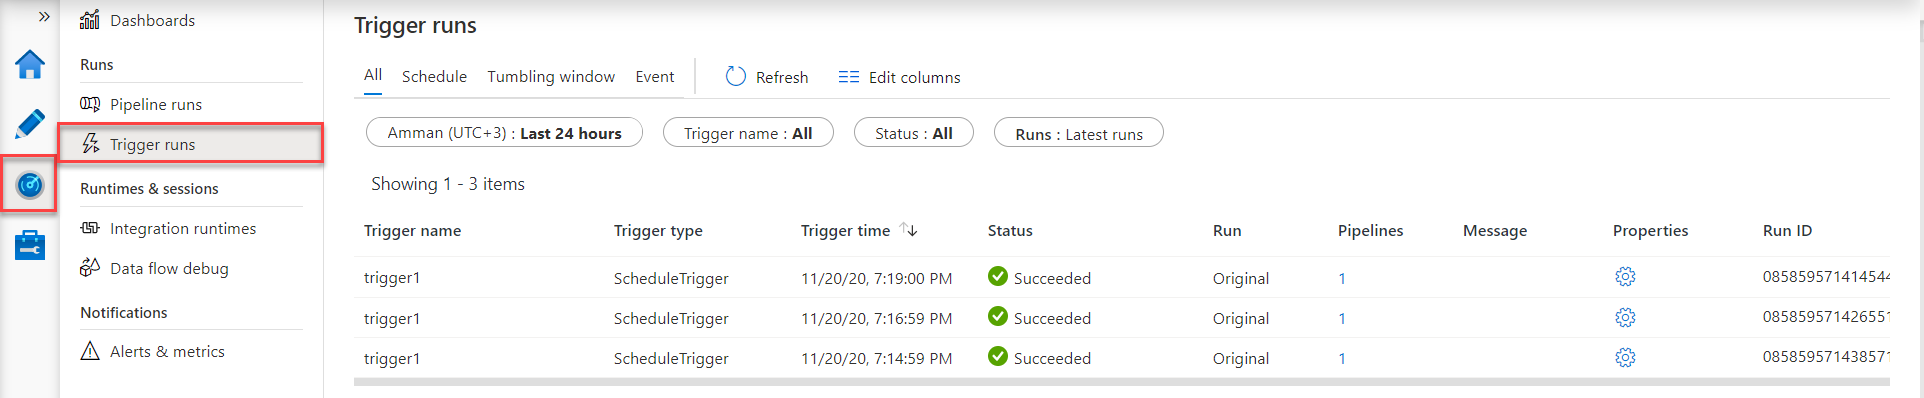
The pipeline execution result can be monitored from the Trigger Runs of the Azure Data Factory Monitor window, in which you can check the name and type of the executed trigger, the trigger time, the execution status of the triggered pipeline, the pipeline that is associated to that trigger, the properties of the trigger and the Run ID of the pipeline executed using that trigger, with the ability to filter the displayed result for a specific trigger type, trigger name, execution result or time period, as shown below:
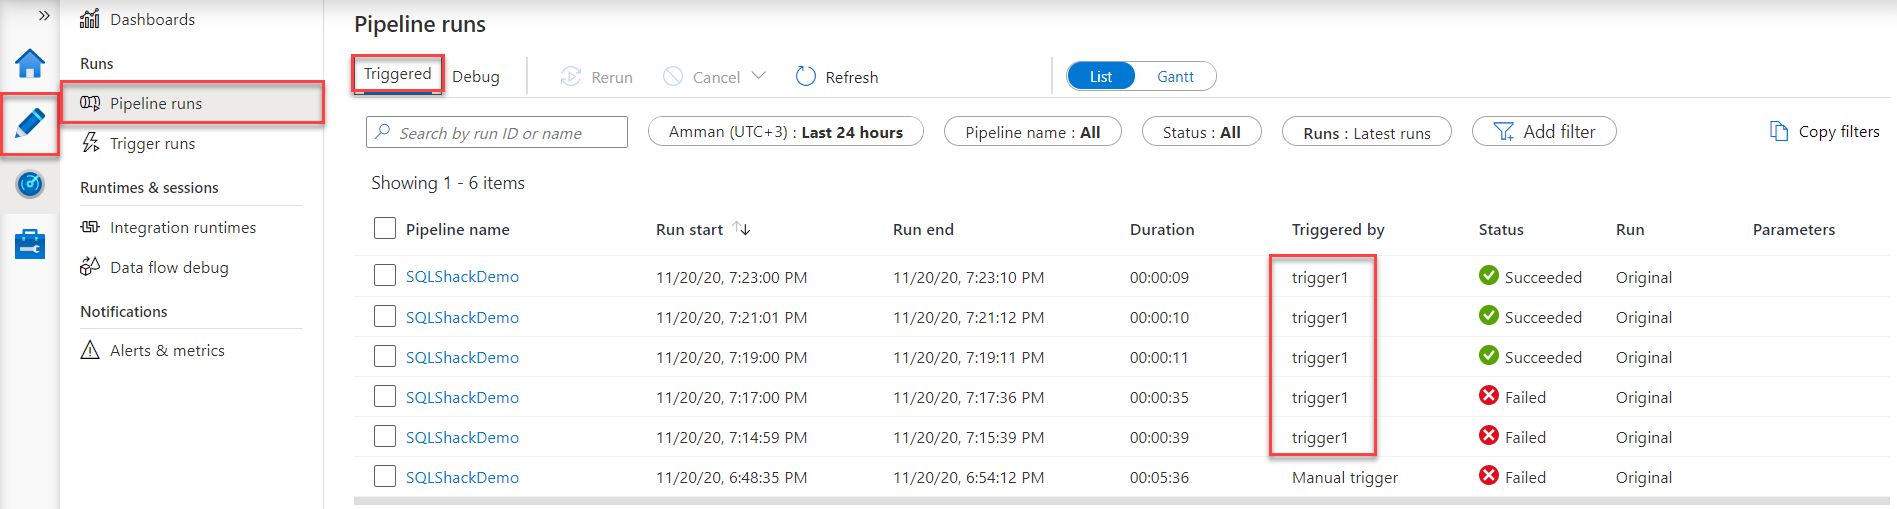
With the ability to get the same information, from the pipeline point of view, by browsing the Pipeline Runs page of the Data Factory Monitor window, where you can also filter to display only the triggered pipeline runs and get more information about each pipeline activity execution by clicking on the pipeline name hyperlink, as shown below:
Or display the pipeline runs using the Gantt timeline, for pipeline execution time and duration troubleshooting purposes, as shown below:

To get an overview of the Azure Data Factory pipelines runs, triggered runs and the executed activities result, you can browse the Dashboards page under the Monitor window, that displays the number, and percentage of the succeeded, failed or cancelled pipeline runs, trigger runs and activities, with the ability to click on the number of failed or succeeded runs and get more details about these runs, as shown below:
Azure Data Factory Metrics
Azure Monitor is an Azure service that can be used to provide metrics and logs for most of Azure services, including Azure Data Factory. The Azure Monitor metrics collect numerical data from the monitored resources at a regular interval that help in describing the status and resource consumption of the monitored service, for troubleshooting and alerting purposes. For more information about Azure Monitor metrics for Azure Data Factory, check the Microsoft article.
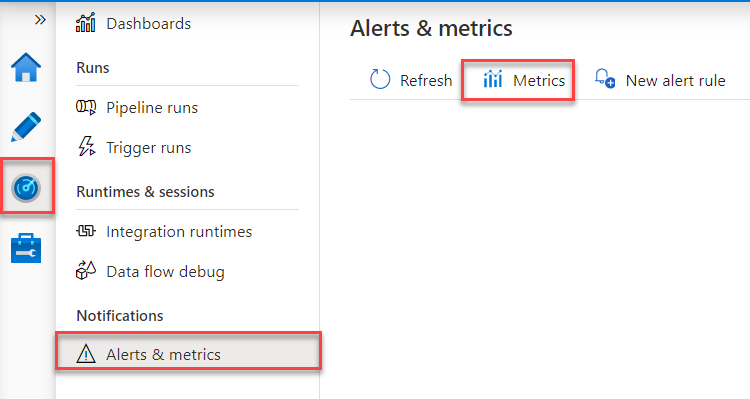
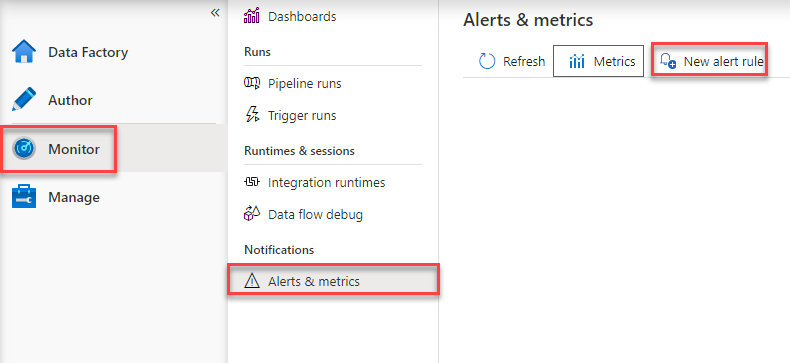
To review the Azure Data Factory metrics, browse the Monitor window and choose the Alerts and Metrics page then click on the Metrics option, as shown below:
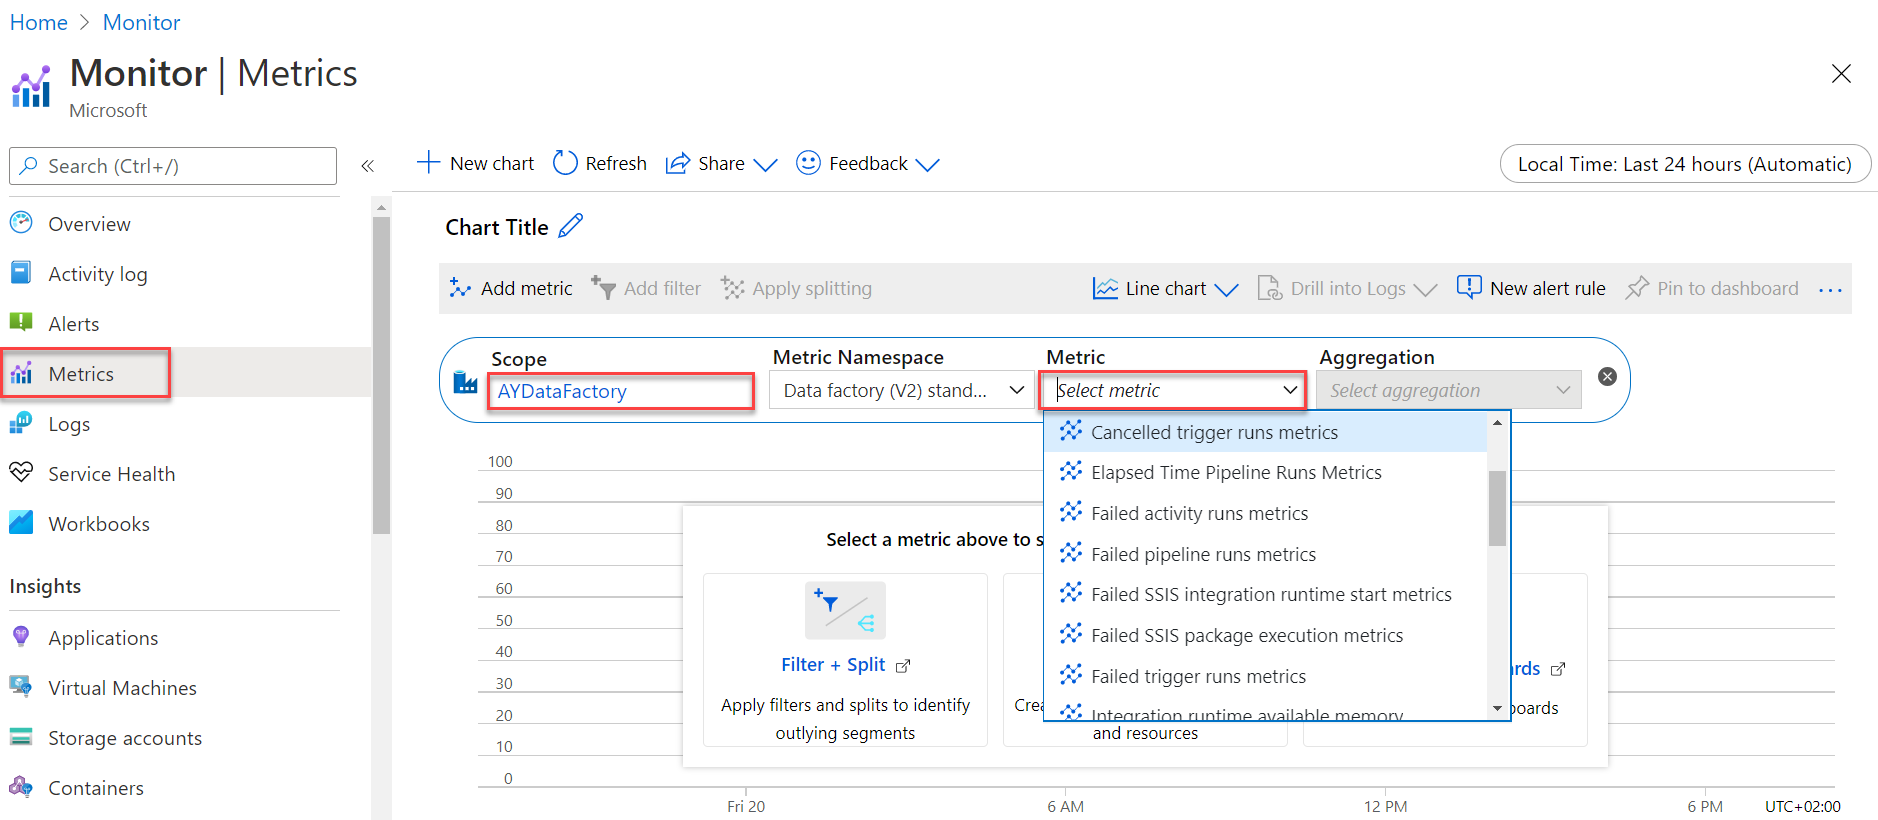
When clicking on the Metrics button, an Azure Monitor window will be displayed, from which you can configure the metrics to be monitored. The metrics can be configured by moving to the Metrics tab, then specifying the Azure service that will be monitored, under the scope option. When the scope is specified, you can review the metric that you are interested to monitor for the selected Azure service, taking into consideration that the metrics list will change based on the selected Azure service, as shown below:
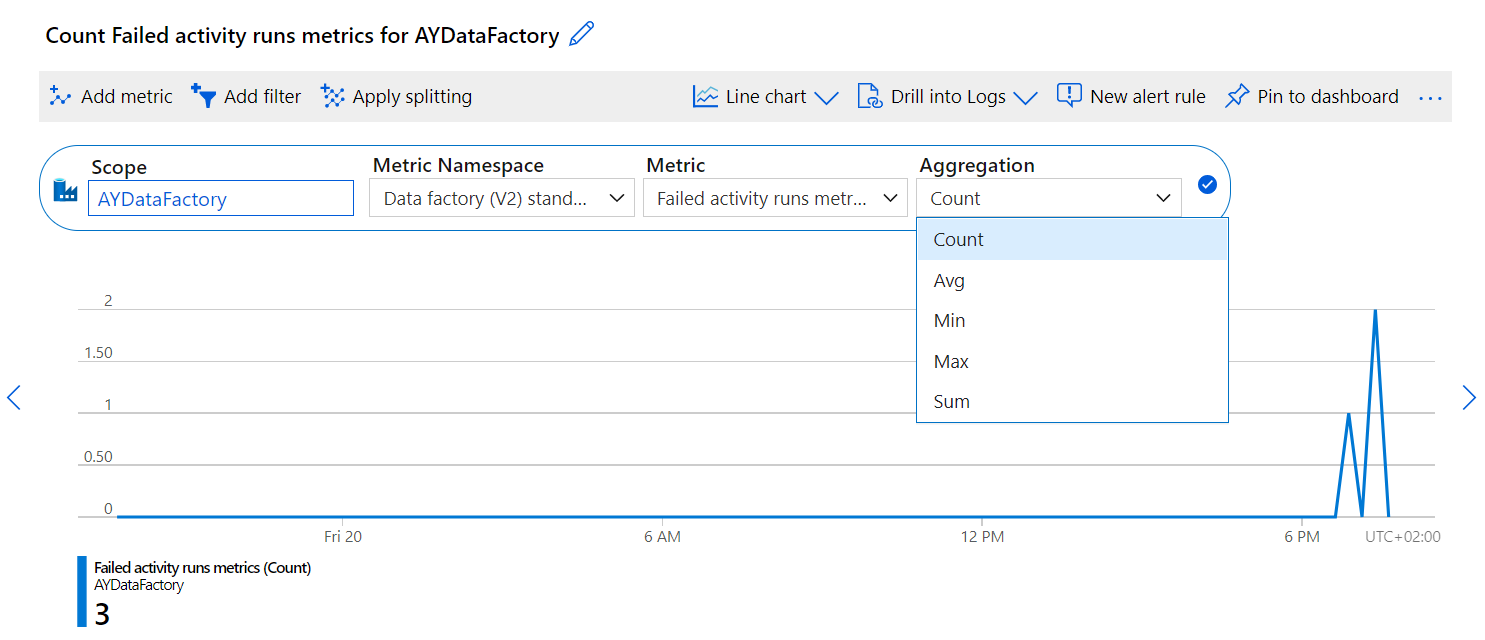
Based on the selected metric, which is the Failed Activity Runs in the selected Azure Data Factory, you have the option to choose the aggregation method that will be used to display the selected metric, such as Count, Max, Min, Avg or Sum, where the aggregated metric will be drawn directly using the selected chart type, reflecting the number of failed pipelines activities on the specified period, as shown below:
Azure Data Factory Alerts
Azure Data Factory provides us with the ability to define an alert to notify specific users based on the supported Data Factory metrics.
To create a new Data Factory alert, click on the New alert rule button, under the Alerts and metrics page of the Monitor window, as shown below:
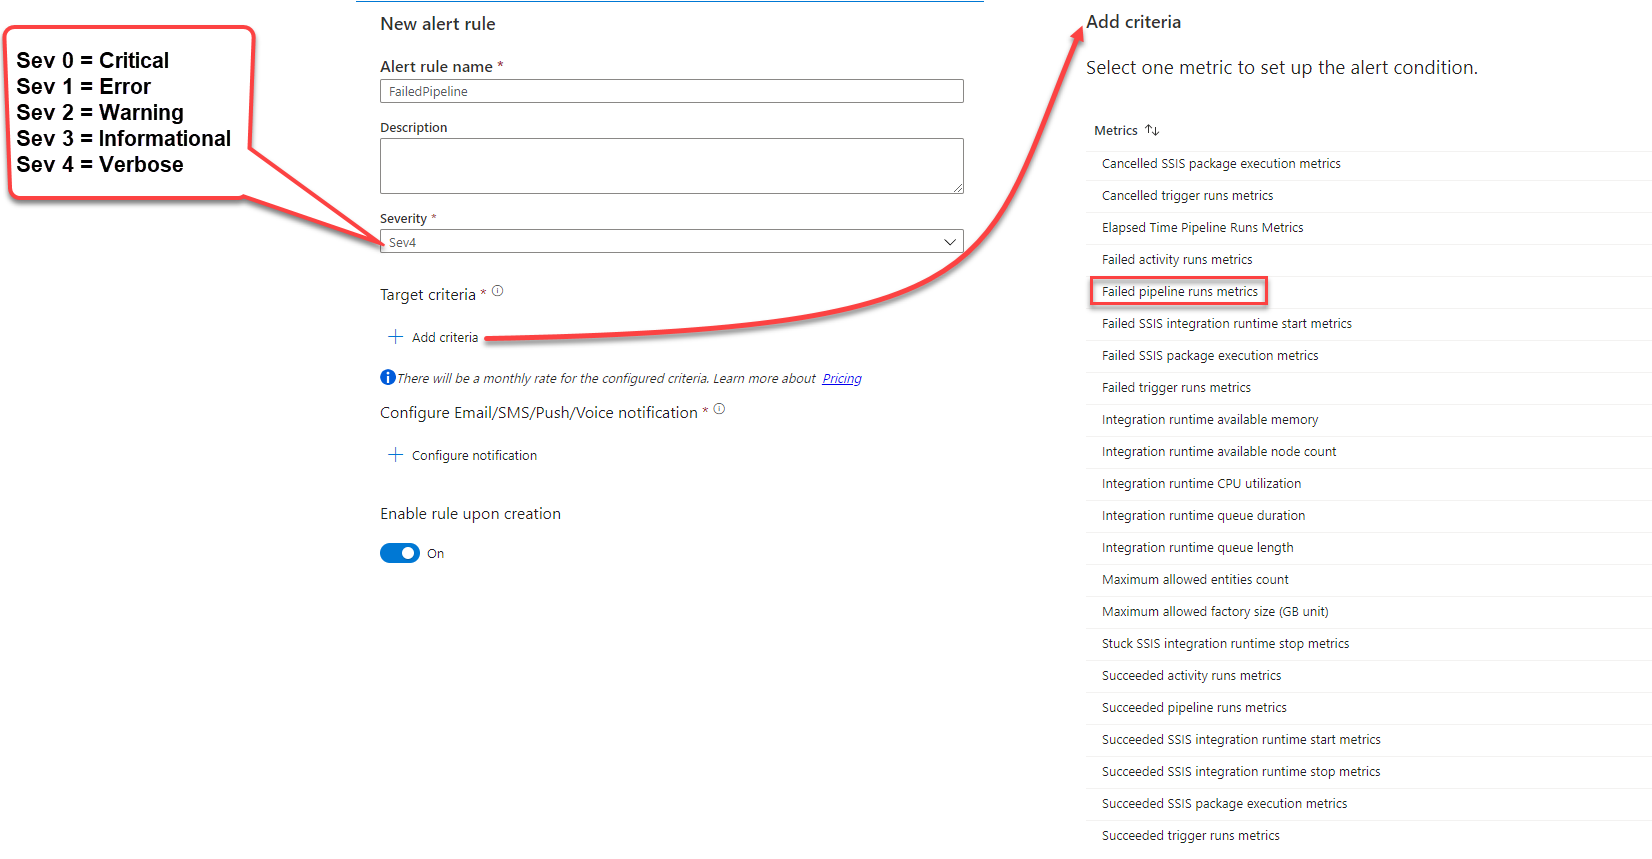
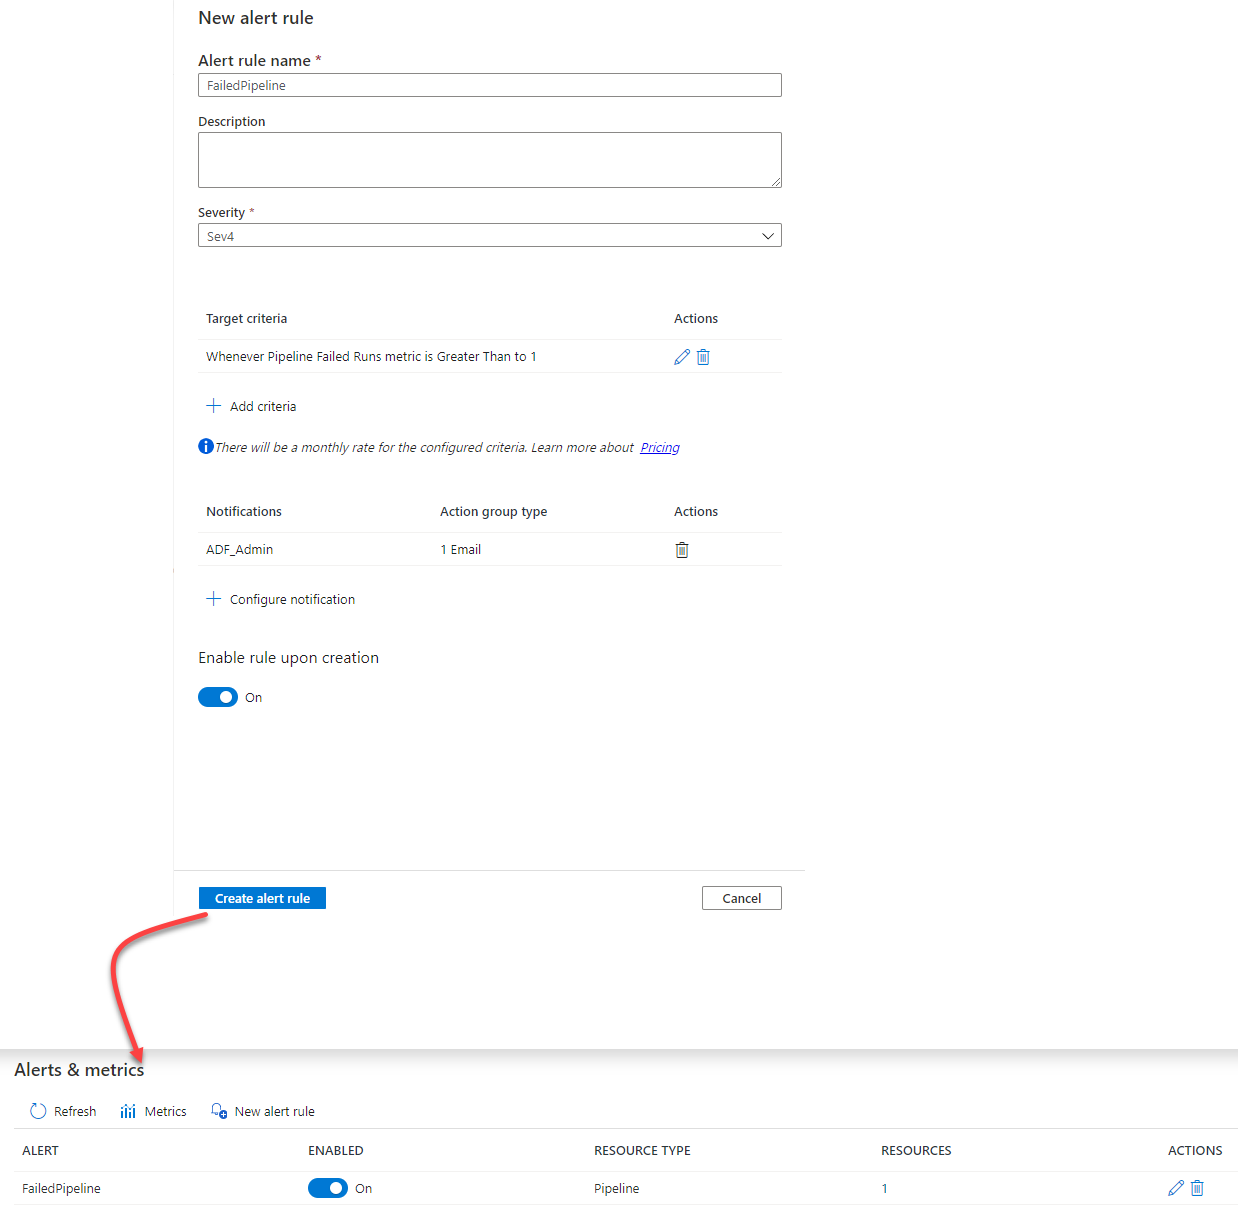
From the New Alert Rule window, provide a meaningful name for the alert that indicates the alert purpose, specify the severity of the alert from the severities list, then choose the metric that will be monitored under this alert, as shown below:
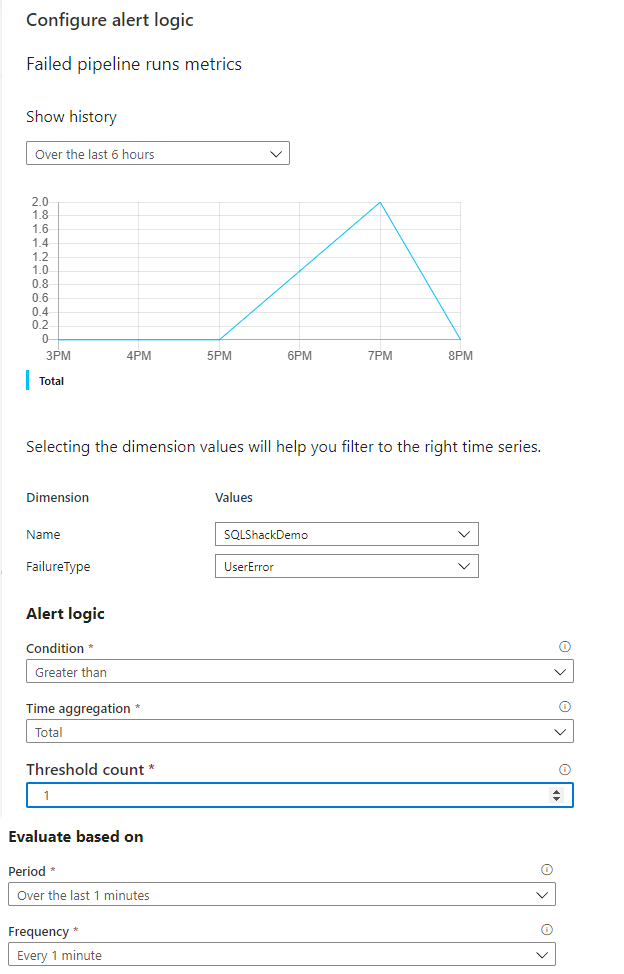
When the Data Factory metric is selected, a new window will be displayed, showing the historical occurrence for the alert logic, then ask you to specify the name of the pipeline that will be monitored, the type of failure that will fire the alert and the evaluation logic of the pipeline, as shown below:
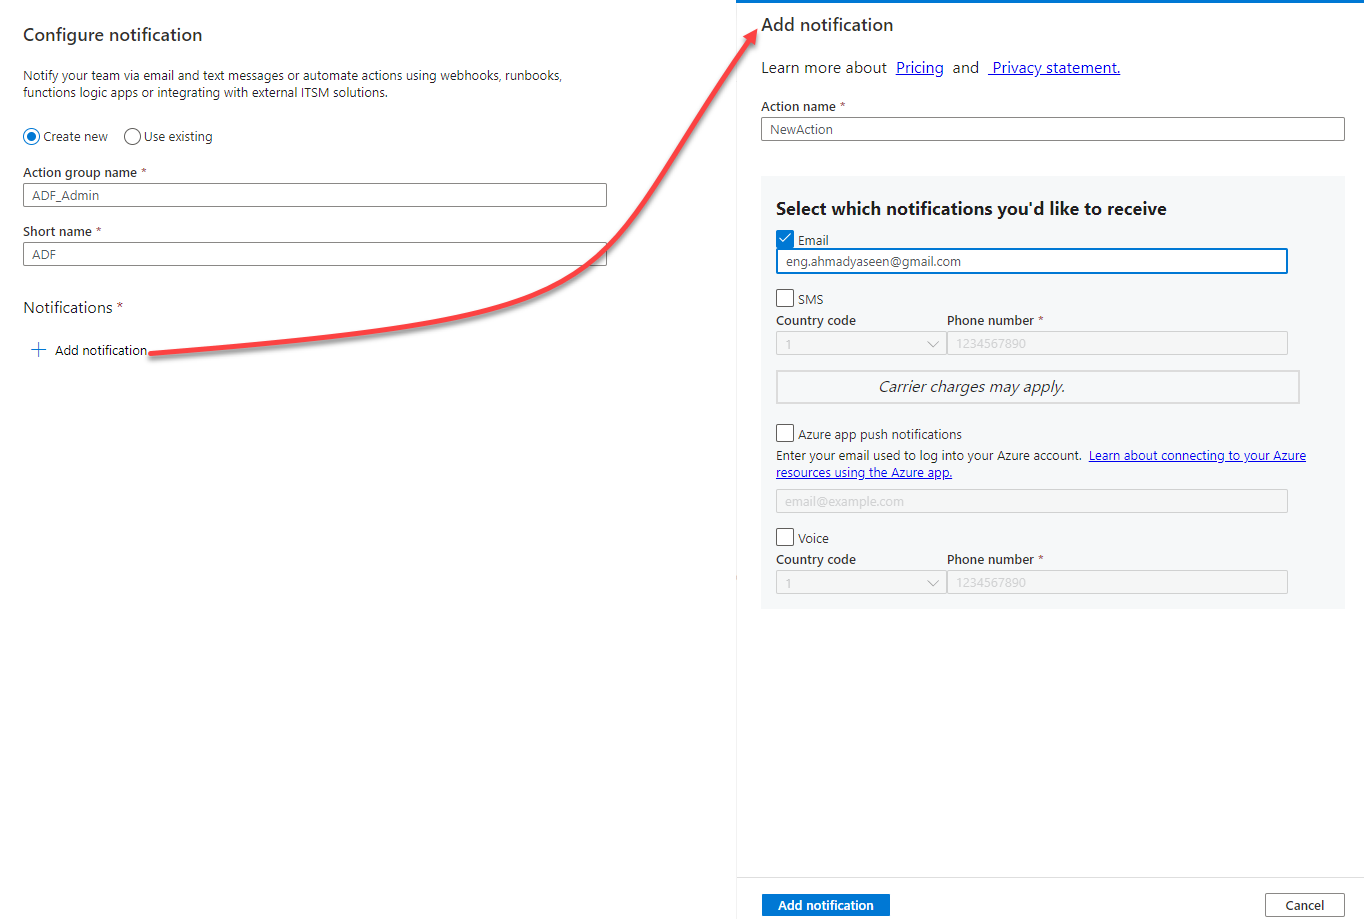
After configuring the alert criteria, you need now to configure the notification process of the alert when the alert logic evaluates true. Where you will be asked to specify the name of the action group that will be notified, and the notification method that you would like to use, such as sending an email to a specific email address, sending an SSMS or call a specific number or push an Azure notification to an Azure account, as shown below:
After configuring the alert criteria, evaluation logic and notification method, click on Create alert rule to create and enable the alert, as shown below:
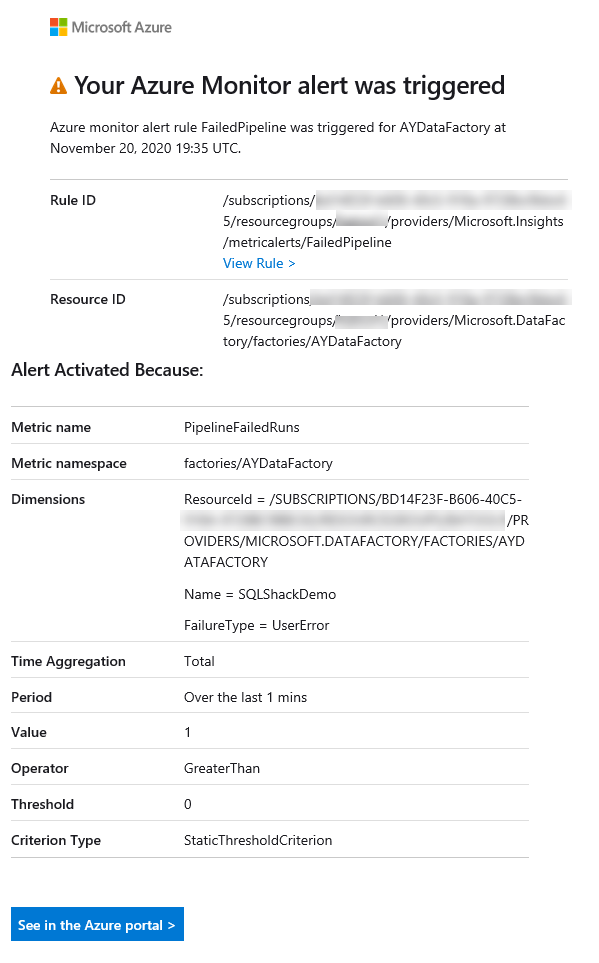
When the monitored pipeline failed, and the alert logic evaluated true, an email will be sent to the configured email address, as shown below:
Conclusion
We learned how to monitor Azure Data Factory in this article. It is still deeper than what we described till that point. If you still enjoy diving deeply, I will be happy to provide more!
Table of contents

He is a Microsoft Certified Solution Expert in Data Management and Analytics, Microsoft Certified Solution Associate in SQL Database Administration and Development, Azure Developer Associate and Microsoft Certified Trainer.
Also, he is contributing with his SQL tips in many blogs.
View all posts by Ahmad Yaseen
- Azure Data Factory Interview Questions and Answers - February 11, 2021
- How to monitor Azure Data Factory - January 15, 2021
- Using Source Control in Azure Data Factory - January 12, 2021