

In the previous articles of this series, SQL Server Execution Plans overview and SQL Server Execution Plans types we went through the different stages that the submitted SQL Server query followed and how it processed by the SQL Server Relational Engine that generates the Execution Plan and the SQL Server Storage Engine that performs the requested data retrieval or modification operation. In addition, we described deeply the different types and formats of the SQL Server Execution Plans that can be used for query performance troubleshooting purposes. In this article, we will discuss the graphical query plan components and how to analyze them.
The SQL Execution Plan is used widely in tuning the performance of the queries by monitoring and troubleshooting how the query executed internally. To be able to take benefits of the SQL execution plan, we need to understand the different information provided by the SQL execution plan, clear at the surface or hidden between the operators. Recall that you should be grated SHOWPLAN permission in order to generate the Execution Plan. Members of the SYSADMIN, DBCREATOR or DB_OWNER will be able to generate the Execution Plans without the need for any extra permissions.
Let us start with a simple SQL Execution Plan. The below SQL Execution Plan is an Actual Plan generated after executing a simple SELECT statement. You may ask, how can I guess if it is an Actual Execution Plan or an Estimated Execution Plan. The answer is the Results tab that can be shown in the top of the figure, indicating that the query was executed before generating the Plan. If this part is removed from the plan, nothing can tell us from the first view what is the type of this graphical execution plan.
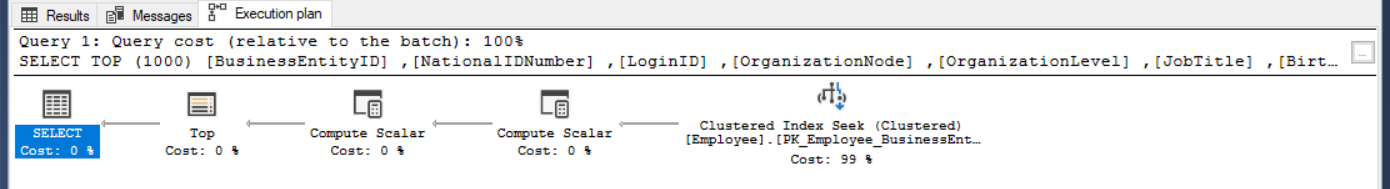
The upper part of the SQL execution plan shows the cost of this query relative to the overall batch cost, in the case of generating the execution plan for multiple queries in the same session, as shown below:

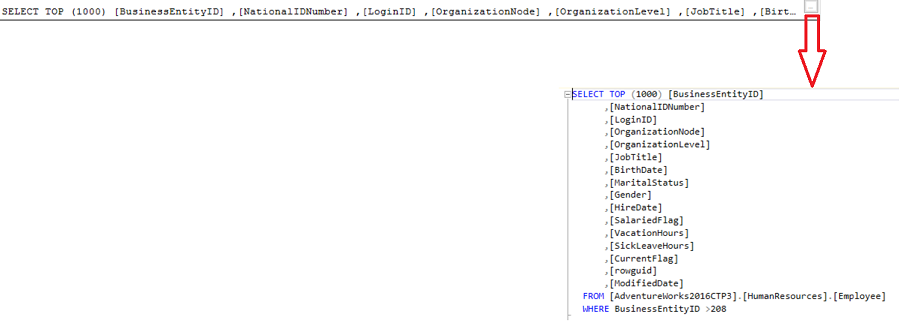
The statement of the submitted query will be also displayed at the top of the SQL execution plan. For long queries, as much of the query statement that can fit into the window will be displayed. You can get the complete statement of the query, in a new window, by clicking on the dotted square as shown below:
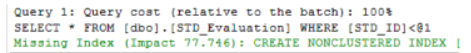
In some cases, the SQL Server Query Optimizer suggests an index, Missing Index, that it finds it will enhance the performance of the query in a specific percentage, that will be displayed as recommendation in green as shown below:
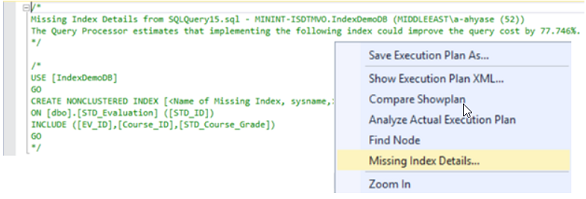
With the ability to view the CREATE INDEX statement by clicking on the Missing Index Details option, as below:
For now, we have a good understanding of the upper part of the graphical Execution Plan, above the solid line. Let us start investigating the information shown lower of that line. To read the SQL Execution Plan correctly, you should know first that the flow of the execution is starting from the right to the left and from the top to the bottom, with the last operator at the left, which is the SELECT operator in most queries, contains the final result of the query. We will discuss all the operators that you may see in the Execution Plans in details later in the series.
The arrows between the operators represent the direction and the amount of data passed between these operators in the SQL Execution Plan. The thickness of the arrow indicates the amount of data passed between the operators. You can derive from the below figure that the amount of data passed in the second arrow is larger than the amount of data passed in the first arrow:

You can get the amount of data passed through this arrow from the arrow tooltip by pointing the mouse to that arrow as shown below:
Not only the number of rows passed by the arrow can be derived by the arrow, but also other useful information is hidden behind this arrow. This information includes the size of each passed row and the total size of the data that is passed through the arrow. The thickness of the arrow can also be an indication of a performance issue. For example, if the execution plan shows thick arrows, the number of the rows that are passed through the arrows is large, at the beginning of the plan and the number of rows passed through the last arrow to the SELECT statement and returned by the query is small then a scan operation is performed incorrectly to a table or an index that should be fixed.
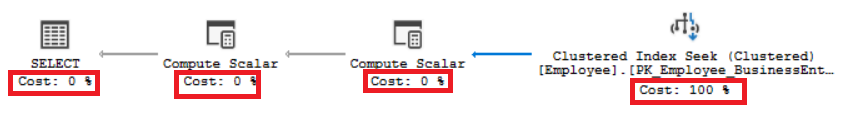
Below each operator, a number as percentage, that represents the SQL Server Query Optimizer estimation for the cost of that operator with relative to the overall query cost, will be displayed. In our example, you can see that all the estimated cost is related to the Clustered Index Seek operator, as shown below:
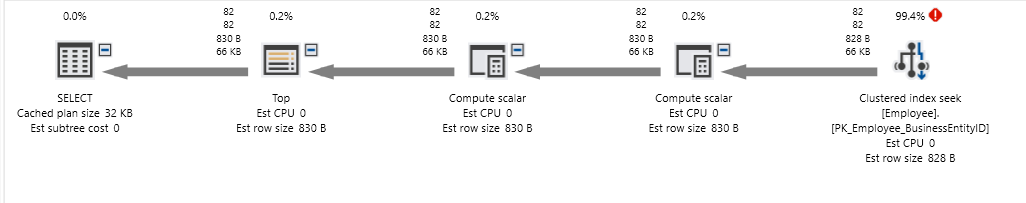
When using the ApexSQL Plan, a tool for SQL execution plan viewing and analysis, the important numbers that represent the top statistics of each operator and arrow will be displayed without the need to click on the component, as shown below:
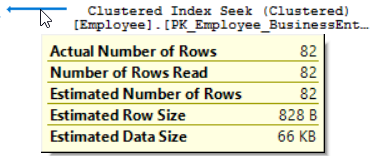
Is that everything can be derived from the Execution Plan? The answer for sure no. There is other information hidden behind each operator in the Execution Plan. Just point the mouse over any operator in the plan, the tooltip for that operator, that contains statistical information and full description about the operator, will be displayed. For example, if you hold the mouse pointer over the Clustered Index Seek operator, the tooltip of that operator will be displayed.
The displayed pop-up contains:
-
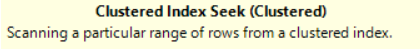
The definition of the selected operator as below:

-
Statistical information about the operator, such as the I/O and CPU costs. These numbers don’t represent the actual amount of resources consumed by this operator, it represents an estimated cost assigned by the SQL Server Query Optimizer during the execution. These information helps to understand what is happening internally while executing the query, as shown below:
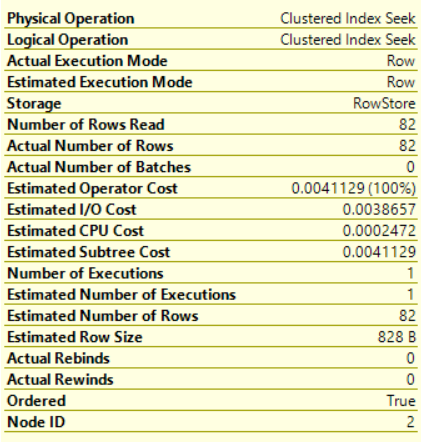
We usually concentrate on the subtree cost of the operator that represents the execution tree that the SQL Server Engine has looked at so far, from right to left, and top to bottom. In the complex plans, that consists of large number of operators, the full cost of the plan can be derived from the final operation accumulatively, which is the SELECT operator in our case.
You should also give attention to the Ordered Boolean value in the operator tooltip. This value indicates if the data that the current operator is processing is sorted or not, which helps to show why extra processing is required in that step of the query. The Node ID value represents the numbered order of the operator assigned by the SQL Server Query Optimizer.
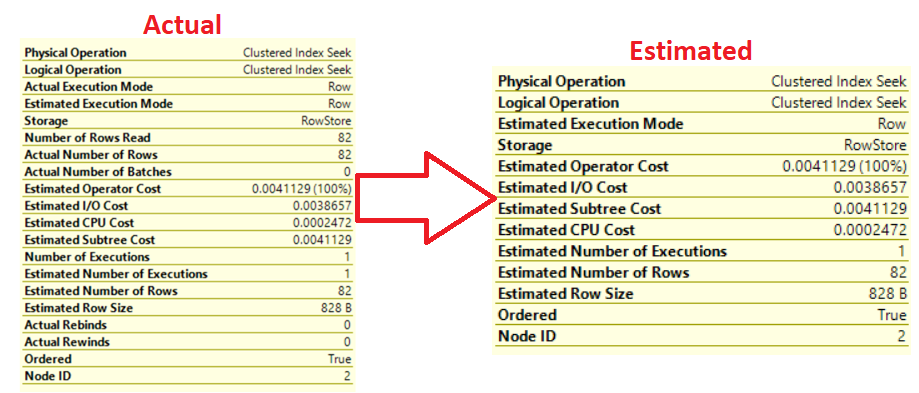
The Actual execution Plan operator displays Actual and Estimated statistics. On the other hand, the Estimated Execution Plan displays only Estimated statistics. In most cases, the Actual and Estimated values are identical. If not, then the statistics of that database table or index are outdated and should be updated, as shown below:
-
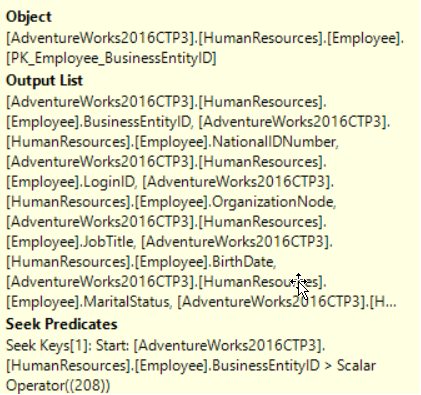
Information about the used index, list of retrieved columns and the condition used to filter the data within that operator as below:
The properties window of the operator provides us with extra information that is not listed in the operator tooltip. If you right-click on any operator and choose Properties window, or just click on the operator and click F4, the properties window of that operator will be displayed. The displayed window will show us more useful information that represents the how the SQL Server will behave while processing the data within that operator. Clicking on the property will display a description for that property, for most of properties but not all, that makes it easier to understand it. The properties with (+) sign beside it are expandable properties that can display extra information, as shown below:

For now, we got a good understanding of the SQL Execution Plan components and how to read it from the right to the left, from the top to the bottom, and that we need to concentrate on the higher percentage operator, the thickest arrow, largest subtree cost, not ordered data, the SCAN operators …etc.
In the next article, we will start by introducing the first set of Execution Plans operators. Stay tuned!
Table of contents
FAQs
Should we create any index suggested by the SQL Execution Plan?
Automatically? No. you have to look at the Impact first.
Also, you have to test it and make sure it will enhance the performance of your query.
Should we concentrate on the arrow thickness in all cases?
You need to make sure that the arrow is thick at the beginning and getting thinner after that. Such as returning 2 rows after scanning thousands of records.
Can the Estimated SQL Execution Plan result be trusted?
This depends on the statistics. If it is updated the results should be the same. You need the Estimated SQL Execution Plan in case the query will take long time to execute and you need to troubleshoot it.

He is a Microsoft Certified Solution Expert in Data Management and Analytics, Microsoft Certified Solution Associate in SQL Database Administration and Development, Azure Developer Associate and Microsoft Certified Trainer.
Also, he is contributing with his SQL tips in many blogs.
View all posts by Ahmad Yaseen
- Azure Data Factory Interview Questions and Answers - February 11, 2021
- How to monitor Azure Data Factory - January 15, 2021
- Using Source Control in Azure Data Factory - January 12, 2021