
In data science, understanding and preparing data is critical, such as the use of the SQL pivot operation. In this article, in the series, we’ll discuss understanding and preparing data by using SQL transpose and SQL pivot techniques.
Transposing a matrix means reversing rows and columns. The data frames in R and Python are actually matrices, and therefore transposing is not a problem. A SQL Server table is a slightly different structure, where rows and columns are not equivalent and interchangeable. A row represents an entity, and a column an attribute of an entity. However, you might get data in SQL Server form a matrix from other systems, and meet the need to transpose it. Transposing data does not involve aggregations.
Pivoting, using SQL pivot is a similar operation. You need three columns for the operation. The first column is giving the row groups. The second column is transposed; its values are used for the new columns’ names. The third column gives the values, which are aggregated over rows and columns.
SQL Pivot operator
As you are probably already used to in my data science articles, I will start with preparing some data. I am using the data from the AdventureWorksDW2017 database. Note that I switched from the SQL Server 2016 version of this database I used in the previous articles to the SQL Server 2017 version. Don’t worry, the structure of the database and the data is nearly the same.
|
1 2 3 4 5 6 7 8 9 10 11 12 13 14 15 16 17 18 19 20 21 |
USE AdventureWorksDW2017; -- Data preparation SELECT g.EnglishCountryRegionName AS Country, g.StateProvinceName AS State, g.EnglishCountryRegionName + ' ' + g.StateProvinceName AS CountryState, d.CalendarYear AS CYear, SUM(s.SalesAmount) AS Sales INTO dbo.SalesGeoYear FROM dbo.FactInternetSales s INNER JOIN dbo.DimDate d ON d.DateKey = s.OrderDateKey INNER JOIN dbo.DimCustomer c ON c.CustomerKey = s.CustomerKey INNER JOIN dbo.DimGeography g ON g.GeographyKey = c.GeographyKey WHERE g.EnglishCountryRegionName IN (N'Australia', N'Canada') GROUP BY g.EnglishCountryRegionName, g.StateProvinceName, d.CalendarYear; GO |
You can make a quick overview of the data with the following two queries. Note the distinct years returned by the second query.
|
1 2 3 4 |
SELECT TOP 5 * FROM dbo.SalesGeoYear; SELECT DISTINCT CYear FROM dbo.SalesGeoYear; |
The distinct years with sales are from 2010 to 2014. Besides years, I aggregated sales over countries and states as well. I also added a combined column CountryState in the table dbo.SalesGeoYear I will use further in this article.
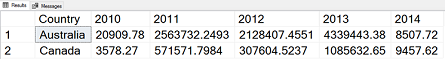
Let me start with the SQL PIVOT operator. The following query calculates the sum of the sales over countries and years. Please note the syntax for the SQL PIVOT operator. The sales column is used for the aggregation, and the CYear column for the labels of the new pivoted columns. Grouping is implicit; all other columns, not used for pivoting or aggregation, are used in an implicit GROUP BY.
|
1 2 3 4 5 6 7 8 9 |
WITH PCTE AS ( SELECT Country, CYear, Sales FROM dbo.SalesGeoYear ) SELECT Country, [2010], [2011], [2012], [2013], [2014] FROM PCTE PIVOT (SUM(Sales) FOR CYear -- Use of the SQL pivot operator IN ([2010], [2011], [2012], [2013], [2014])) AS P; |
Here is the result of the query.
Of course, you can change the aggregate function. For example, the following query calculates the count of the sales over countries and years.
|
1 2 3 4 5 6 7 8 9 |
WITH PCTE AS ( SELECT Country, CYear, Sales FROM dbo.SalesGeoYear ) SELECT Country, [2010], [2011], [2012], [2013], [2014] FROM PCTE PIVOT (COUNT(Sales) FOR CYear -- Use of the SQL pivot operator IN ([2010], [2011], [2012], [2013], [2014])) AS P; |
You probably noticed that I used a common table expression to prepare the rowset for pivoting; I am not using the table directly. This is due to the implicit grouping. Somebody that defined the syntax for the SQL PIVOT operator wanted to make the code shorter; however, because of that, you need to write more code to be on the safe side. Columns that are not used for pivoting and aggregating are used for grouping. What happens if you read a column more, like in the following query?
|
1 2 3 4 5 6 7 8 9 |
WITH PCTE AS ( SELECT Country, State, CYear, Sales FROM dbo.SalesGeoYear ) SELECT Country, [2010], [2011], [2012], [2013], [2014] FROM PCTE PIVOT (SUM(Sales) FOR CYear -- Use of the SQL pivot operator IN ([2010], [2011], [2012], [2013], [2014])) AS P; |
I read also the column State in the CTE. I am not using it in the outer query. However, the result is quite different from the previous one.
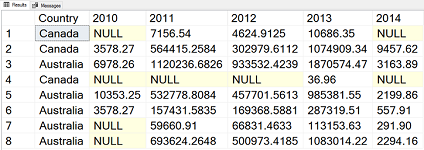
The query did implicit grouping over two columns, Country and State.
The SQL PIVOT operator is not really intended for transposing the table. You always need to have an aggregate function. However, you can simulate transposing when you have a single value over rows and pivoted columns with the MIN() or MAX() aggregate functions. For example, the following query does not work:
|
1 2 3 4 5 6 7 8 9 |
WITH PCTE AS ( SELECT CountryState, CYear, Sales FROM dbo.SalesGeoYear ) SELECT CountryState, [2010], [2011], [2012], [2013], [2014] FROM PCTE PIVOT (Sales FOR CYear -- Use of the SQL pivot operator IN ([2010], [2011], [2012], [2013], [2014])) AS P; |
But, as mentioned, it is easy to change it to a query that does work, the query that just transposes the data, without aggregation. Or, to be precise, the aggregation exists, with the MAX() function, on a single value, returning the value itself.
|
1 2 3 4 5 6 7 8 9 |
WITH PCTE AS ( SELECT CountryState, CYear, Sales FROM dbo.SalesGeoYear ) SELECT CountryState, [2010], [2011], [2012], [2013], [2014] FROM PCTE PIVOT (MAX(Sales) FOR CYear -- Use of the SQL pivot operator IN ([2010], [2011], [2012], [2013], [2014])) AS P; |
The SQL PIVOT operator is T-SQL proprietary operator. It is not part of the ANSI SQL standard. You can write pivoting queries with ANSI standard SQL as well, using the CASE expression, like the following query shows.
|
1 2 3 4 5 6 7 8 |
SELECT Country, SUM(CASE WHEN CYear = 2010 THEN Sales END) AS [2010], SUM(CASE WHEN CYear = 2011 THEN Sales END) AS [2011], SUM(CASE WHEN CYear = 2012 THEN Sales END) AS [2012], SUM(CASE WHEN CYear = 2013 THEN Sales END) AS [2013], SUM(CASE WHEN CYear = 2014 THEN Sales END) AS [2014] FROM dbo.SalesGeoYear GROUP BY Country; |
Besides implicit grouping, there is another problem with the SQL PIVOT operator. You can’t get the list of the distinct values of the pivoted column dynamically, with a subquery. You need to use dynamic SQL for this task. I am showing how to create a pivoting query dynamically in the following code. Note that I create the concatenated list of pivoted column names with the STRING_AGG() function, which is new in SQL Server 2017.
|
1 2 3 4 5 6 7 8 9 10 11 12 13 14 15 16 17 18 19 20 |
DECLARE @stmtvar AS NVARCHAR(4000); SET @stmtvar = N' WITH PCTE AS ( SELECT Country, CYear, Sales FROM dbo.SalesGeoYear ) SELECT * FROM PCTE PIVOT (SUM(Sales) FOR CYear IN (' + (SELECT STRING_AGG(Cyear, N', ') WITHIN GROUP (ORDER BY CYear) FROM ( SELECT DISTINCT QUOTENAME(CYear) AS CYear FROM dbo.SalesGeoYear ) AS Y) + N')) AS P;'; EXEC sys.sp_executesql @stmt = @stmtvar; |
This will be enough T_SQL for this article, I am switching to R now.
Transposing and Pivoting in R
As always, I am starting with reading the data from SQL Server in an R data frame. I am also using the View() function to show it immediately.
|
1 2 3 4 5 6 7 8 |
library(RODBC) con <- odbcConnect("AWDW", uid = "RUser", pwd = "Pa$$w0rd") SGY <- as.data.frame(sqlQuery(con, "SELECT Country, State, CountryState, CYear, Sales FROM dbo.SalesGeoYear;"), stringsAsFactors = TRUE) close(con) View(SGY) |
The simplest way to transpose the data is with the t() function from the basic package:
|
1 |
t(SGY) |
The transposed matrix is not very readable. Here is the partial result.
| 1 | 2 | |
| Country | “Australia” | “Australia” |
| State | “Queensland” | “South Australia” |
| CountryState | “Australia Queensland” | “Australia South Australia” |
| CYear | “2013” | “2010” |
| Sales | “985381.550” | “3578.270” |
I didn’t define the row names, which serve as the keys in a SQL Server table. I know that the CountryState and CYear columns together uniquely identify each row in my data. I am creating a new data frame with row names in the following code, and then transposing this new data frame.
|
1 2 3 4 5 |
SNA <- SGY row.names(SNA) <- paste(SNA$CountryState, SNA$CYear, sep = ', ') SNA <- SNA[c("Country", "State", "Sales")] t(SNA) |
Here is the partial result, which makes much more sense now.
| Australia Queensland, 2013 | Australia South Australia, 2010 | |
| Country | “Australia” | “Australia” |
| State | “Queensland” | “South Australia” |
| Sales | “985381.550” | “3578.270” |
There are numerous ways for pivoting the data in R. Some useful functions for pivoting, or crosstabulation, are already in the basic package, including the table(), xtabs(), and tapply() functions. The first one returns the counts, that second on the sums, and you can use easily the third one with any aggregate function.
|
1 2 3 4 5 6 7 8 9 |
# Pivoting # Counts table(SGY$Country, SGY$CYear) # Sums xtabs(Sales ~ Country + CYear, data = SGY) xtabs(Sales ~ CountryState + CYear, data = SGY) # Different aggregate functions tapply(SGY$Sales, list(SGY$Country, SGY$CYear), FUN = length) tapply(SGY$Sales, list(SGY$Country, SGY$CYear), FUN = sum) |
For the sake of brevity, I am showing only the results of the two tapply() function calls, with counts and sums of sales over countries and years.
| 2010 | 2011 | 2012 | 2013 | 2014 | |
| Australia | 3 | 5 | 5 | 5 | 5 |
| Canada | 1 | 2 | 2 | 3 | 1 |
| 2010 | 2011 | 2012 | 2013 | 2014 | |
| Australia | 20909.78 | 2563732.2 | 2128407.5 | 4339443 | 8507.72 |
| Canada | 3578.27 | 571571.8 | 307604.5 | 1085633 | 9457.62 |
The Microsoft RevoScaleR library has many scalable functions, including functions for pivoting. The following code uses the rxCube() function.
|
1 2 3 4 5 |
library(RevoScaleR) # Crosstabulation rxCube(formula = Sales ~ Country:F(CYear), data = SGY, means = FALSE) |
Here is the result, showing both counts and sums in a single table.
| Country | F_CYear | Sales | Counts | |
| 1 | Australia | 2010 | 20909.78 | 3 |
| 2 | Canada | 2010 | 3578.27 | 1 |
| 3 | Australia | 2011 | 2563732.25 | 5 |
| 4 | Canada | 2011 | 571571.80 | 2 |
| 5 | Australia | 2012 | 2128407.46 | 5 |
| 6 | Canada | 2012 | 307604.52 | 2 |
| 7 | Australia | 2013 | 4339443.38 | 5 |
| 8 | Canada | 2013 | 1085632.65 | 3 |
| 9 | Australia | 2014 | 8507.72 | 5 |
| 10 | Canada | 2014 | 9457.62 | 1 |
With the rxCrossTabs() function, you can calculate different statistics in a single call, store everything in an object, and then just read the part that you need, like the following code shows.
|
1 2 3 4 5 6 7 8 |
# Crosstabulation object cTabs <- rxCrossTabs(formula = Sales ~ Country:F(CYear), data = SGY) # Check the results print(cTabs, output = "counts") print(cTabs, output = "sums") print(cTabs, output = "means") |
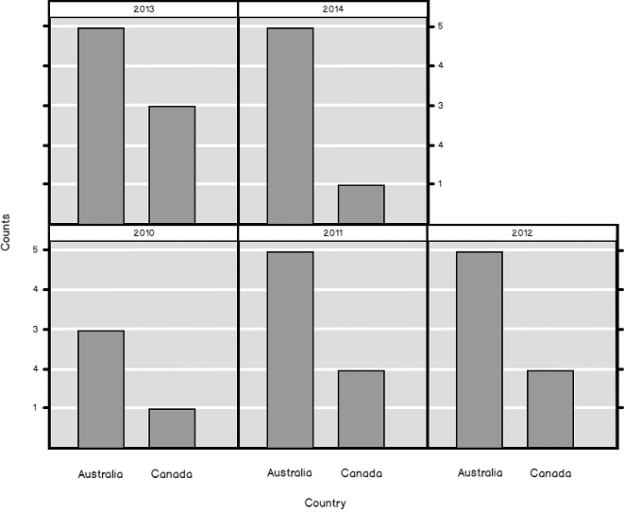
It is always nice to present the results graphically as well. You can use the rxHistogram(), another RevoScaleR scalable function, for showing the counts of the sales over countries and years.
|
1 2 |
rxHistogram(formula = ~ Country|F(CYear), data = SGY) |
The result is the following graph.

You are probably already used to the fact that in r you can always do things in many ways. The following example shows how to do pivoting with the cast() function from the reshape package.
|
1 2 3 4 5 6 |
# install.packages("reshape") library(reshape) cast(formula = Country ~ CYear, value = "Sales", data = SGY, fun.aggregate = sum) |
You can use the spread() function from the tidyr package for transposing the data.
|
1 2 3 |
# install.packages("tidyr") library(tidyr) spread(data = SGY[c("CountryState", "CYear", "Sales")], key = CYear, value = Sales) |
You can combine the spread() function with the group_by() and summarise() functions from the dplyr package for pivoting.
|
1 2 3 4 5 6 |
# install.packages("dplyr") library(dplyr) SGY[c("Country", "CYear", "Sales")] %>% group_by(Country, CYear) %>% summarise(Sales = sum(Sales)) %>% spread(key = CYear, value = Sales) |
There are probably many more options in R; however, I am switching to Python now.
Python Pandas Transposing and Pivoting
As always, I need to start with importing the necessary libraries and reading the data.
|
1 2 3 4 5 6 7 8 9 10 11 12 |
# Imports needed import numpy as np import pandas as pd import pyodbc import matplotlib.pyplot as plt # Connecting and reading the data con = pyodbc.connect('DSN=AWDW;UID=RUser;PWD=Pa$$w0rd') query = """ SELECT Country, State, CountryState, CYear, Sales FROM dbo.SalesGeoYear;""" SGY = pd.read_sql(query, con) SGY.head() |
In Python, all of the functions you need for transposing and pivoting data exist in the pandas package. For transposing the data, you can use the transpose() pandas data frame object method. You can also use the property T, which is the accessor to the method transpose(). The following two lines of code are equivalent.
|
1 2 |
SGY.transpose() SGY.T |
Here is the partial result.
| 0 | 1 | |
| Country | Australia | Australia |
| State | Queensland | South Australia |
| CountryState | Australia Queensland | Australia South Australia |
| CYear | 2013 | 2010 |
| Sales | 985382 | 3578.27 |
Similarly, like defining the row names in R, it makes sense to define the row indexes for a Python data frame. The following code defines the index on a copy of the original data frame and then transposes it.
|
1 2 3 |
SNA = SGY.copy() SNA.set_index(["CountryState", "CYear"], inplace = True) SNA.T |
The results are more readable.
| CountryState | Australia Queensland | Australia South Australia |
| CYear | 2013 | 2010 |
| Country | Australia | Australia |
| State | Queensland | South Australia |
| Sales | 985382 | 3578.27 |
The SQL pivot() function pivots the data without aggregations. You can achieve the same result with the unstack() function, as the following code shows.
Here is the partial last result of the previous code.
| CYear | 2010 | 2011 | 2012 |
| CountryState | |||
| Australia New South Wales | 6978.26 | 1.120237e+06 | 933532.4239 |
| Australia Queensland | 10353.25 | 5.327788e+05 | 457701.5613 |
| Australia South Australia | 3578.27 | 1.574316e+05 | 169368.5881 |
| Australia Tasmania | NaN | 5.966091e+04 | 66831.4633 |
| Australia Victoria | NaN | 6.936243e+05 | 500973.4185 |
| Canada Alberta | NaN | 7.156540e+03 | 4624.9125 |
| Canada British Columbia | 3578.27 | 5.644153e+05 | 302979.6112 |
| Canada Ontario | NaN | NaN | NaN |
The pivot_table() function pivots the data and introduces the aggregations.
|
1 2 3 4 5 |
# SQL Pivot table - with aggregations SGY.pivot_table(values = "Sales", index = "Country", columns = "CYear", aggfunc = "sum") SGY.pivot_table(values = "Sales", index = "Country", columns = "CYear", aggfunc = "count") |
And here is the result for the counts.
| CYear | 2010 | 2011 | 2012 | 2013 | 2014 |
| Country | |||||
| Australia | 3 | 5 | 5 | 5 | 5 |
| Canada | 1 | 2 | 2 | 3 | 1 |
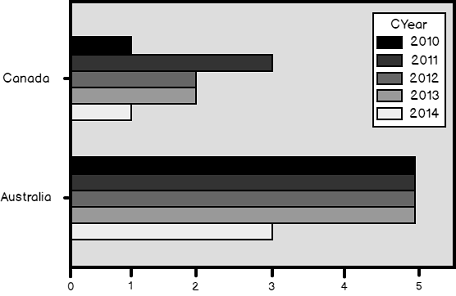
Finally, let me also create a graph in Python.
|
1 2 3 |
SGY.pivot_table(values = "Sales", index = "Country", columns = "CYear", aggfunc = "sum").plot(kind = "barh") plt.show() |
The following figure shows the graph.
Conclusion
As you probably noticed from my data science articles, there is always the highest number of possibilities for nearly any kind of task in R. Nevertheless, you can do efficient pivoting and transposing in T-SQL and Python as well. And you can imagine what comes next: unpivoting.
Table of contents
Downloads

View all posts by Dejan Sarka
- Data Science in SQL Server: Unpivoting Data - October 29, 2018
- Data science in SQL Server: Data analysis and transformation – Using SQL pivot and transpose - October 11, 2018
- Data science in SQL Server: Data analysis and transformation – grouping and aggregating data II - September 28, 2018