
In my previous article, Introduction to data science, data understanding and preparation, I showed how to make an overview of the distribution of a discrete SQL variable. I analyzed the NumberCarsOwned variable from the dbo.vTargetMail view that you can find in the AdventureWorksDW2016 demo database. The data science graphs I created in R and Python and the histogram created with T-SQL were all very nice. Now let me try to create a histogram for another SQL variable from that view, for the Education variable. I am starting with R, as you can see from the following code.
|
1 2 3 4 5 6 7 8 9 10 11 12 13 14 15 16 |
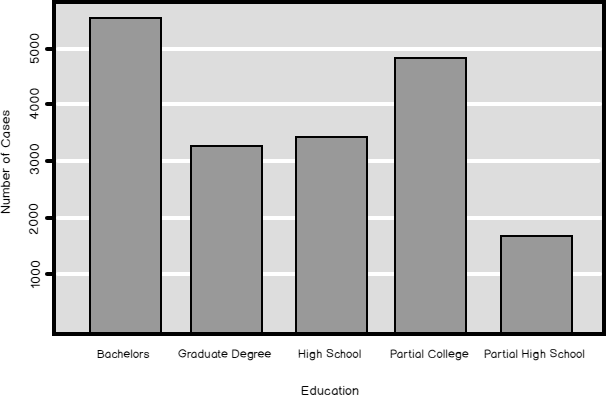
# Load RODBC library (install only if needed) # install.packages("RODBC") library(RODBC) # Connecting and reading the data con <- odbcConnect("AWDW", uid = "RUser", pwd = "Pa$$w0rd") TM <- as.data.frame(sqlQuery(con, "SELECT EnglishEducation AS Education FROM dbo.vTargetMail;"), stringsAsFactors = TRUE) close(con) # Plot the Education plot(TM$Education, main = 'Education', xlab = 'Education', ylab = 'Number of Cases', col = "light blue") |
You can see the result in the following figure.

This histogram does not look good. The distribution is somehow weird; you would expect that the distribution would resemble the Gaussian curve. What is the problem? Note the labels – the bars are organized alphabetically. However, Education is not a pure nominal SQL variable; it is ordinal, just like NumberCarsOwned one. It has an intrinsic order. The intrinsic order of the NumberCarsOwned SQL variable is the same as the order of the values of that SQL variable. With Education, you need to define the order in some way, so the values get ordered properly.
I will demonstrate a couple of techniques for defining the order of ordinal variables in T-SQL, R, and Python. In addition, I will show in this article another useful data preparation technique for working with discrete variables – creating dummy variables, or dummies, from a discrete one.
Ordering ordinals
If you want to change the order of the values of a SQL variable, you need to change the values themselves. You can do it with the CASE clause in the SELECT statement you use to read the data. Of course, you can also permanently update the values in a table, and even add a new column with the updated values. The following query shows how you can use the CASE clause to modify the values in a query and get a proper histogram.
|
1 2 3 4 5 6 7 8 9 10 11 12 13 14 15 16 17 18 19 20 21 22 23 24 25 26 27 28 29 30 31 32 33 |
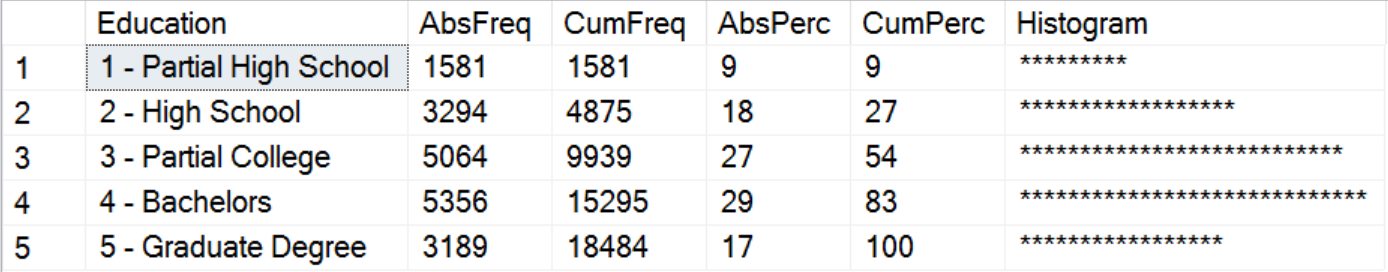
USE AdventureWorksDW2016; GO -- Ordering Education WITH freqCTE AS ( SELECT CASE v.EnglishEducation WHEN 'Partial High School' THEN '1 - Partial High School' WHEN 'High School' THEN '2 - High School' WHEN 'Partial College' THEN '3 - Partial College' WHEN 'Bachelors' THEN '4 - Bachelors' WHEN 'Graduate Degree' THEN '5 - Graduate Degree' END AS Education, COUNT(v.EnglishEducation) AS AbsFreq, CAST(ROUND(100. * (COUNT(v.EnglishEducation)) / (SELECT COUNT(*) FROM vTargetMail), 0) AS INT) AS AbsPerc FROM dbo.vTargetMail AS v GROUP BY v.EnglishEducation ) SELECT Education, AbsFreq, SUM(AbsFreq) OVER(ORDER BY Education ROWS BETWEEN UNBOUNDED PRECEDING AND CURRENT ROW) AS CumFreq, AbsPerc, SUM(AbsPerc) OVER(ORDER BY Education ROWS BETWEEN UNBOUNDED PRECEDING AND CURRENT ROW) AS CumPerc, CAST(REPLICATE('*',AbsPerc) AS VARCHAR(50)) AS Histogram FROM freqCTE ORDER BY Education; GO |
You can see the results in the next figure. You see that the order is now correct and that the histogram looks more like the bell curve.
In R, you don’t need to change the values of an ordinal to get the correct order. R defines discrete variables as so-called factors. Factors have levels, which represent the distinct values of the variable. You define the factors with the factor() function. When you define the levels, you also define whether the levels are ordered or not. If the levels are ordered, it is important to write them in the correct order. The following code shows how to use the factor() function to define the levels and their order for the Education variable, and then plots the histogram for this variable again.
|
1 2 3 4 5 6 7 8 9 |
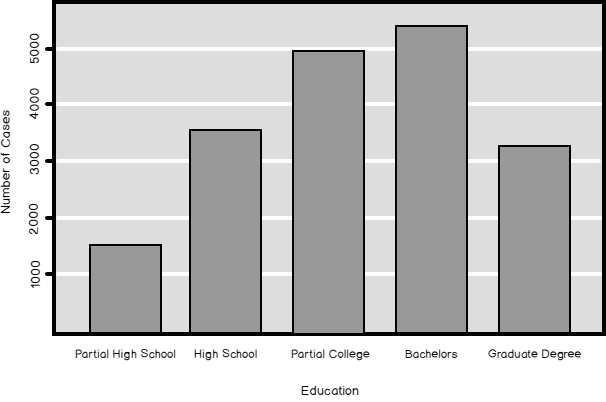
# Education is ordered TM$Education = factor(TM$Education, order = TRUE, levels = c("Partial High School", "High School", "Partial College", "Bachelors", "Graduate Degree")) # Plot it again plot(TM$Education, main = 'Education', xlab = 'Education', ylab = 'Number of Cases', col = "dark green") |
You can see the results in the following figure. Now the histogram looks like it should look from the beginning.
Of course, the next is Python. In Python, you can map values to properly ordered values by using a dictionary object. You use the old values for the keys of the dictionary and the properly ordered values for the values of the key-value pairs of the dictionary. The following code reads the data and creates the mapping dictionary object.
|
1 2 3 4 5 6 7 8 9 10 11 12 13 14 15 16 17 18 19 20 |
# Imports needed import numpy as np import pandas as pd import pyodbc import matplotlib.pyplot as plt # Connecting and reading the data con = pyodbc.connect('DSN=AWDW;UID=RUser;PWD=Pa$$w0rd') query = """SELECT EnglishEducation AS Education FROM dbo.vTargetMail;""" TM = pd.read_sql(query, con) # Mapping values to integers for the correct order map1 = { "Partial High School" : 1, "High School" : 2, "Partial College" : 3, "Bachelors" : 4, "Graduate Degree": 5 } |
Then you replace the original values with the mapped values. You create a graph with the mapped values. However, you use the dictionary keys, the old values, for the labels. You can see the process in the following code.
|
1 2 3 4 5 6 7 8 9 10 11 |
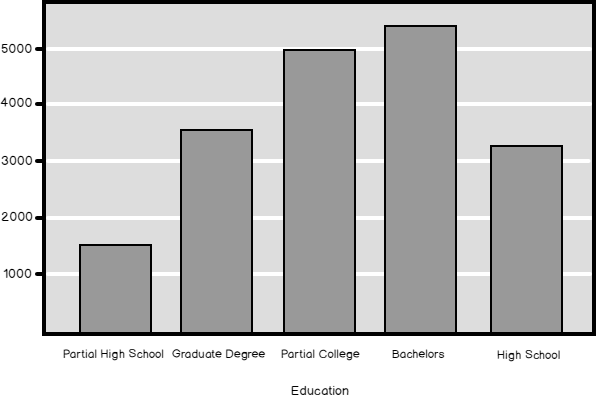
# Replacing Education values with mapping values TM.Education.replace(map1) # Creating a proper graph ax = pd.crosstab(TM.Education.replace(map1), columns = 'Count').plot(kind = 'bar', legend = False, title = 'Education', fontsize = 12) ax.set_xticklabels(map1.keys(), rotation=0) plt.show() |
And here is the result.
Making dummies
Sometimes you want to convert a categorical variable to a set of indicators that just show the presence or the absence of the values of the variable. You create a new indicator for each distinct value or level of the original variable. You assign the value 1 to the indicator for a specific value when the original variable takes that specific value and the value 0 for each other value of the original variable. Such indicators are also called dummy variables, or dummies. There are some algorithms, particularly when you perform regression analysis, that needs only numerical input.
You can easily understand the process of creating the indicators through the following T-SQL code that uses the IIF function.
|
1 2 3 4 5 6 7 8 9 10 11 12 13 14 |
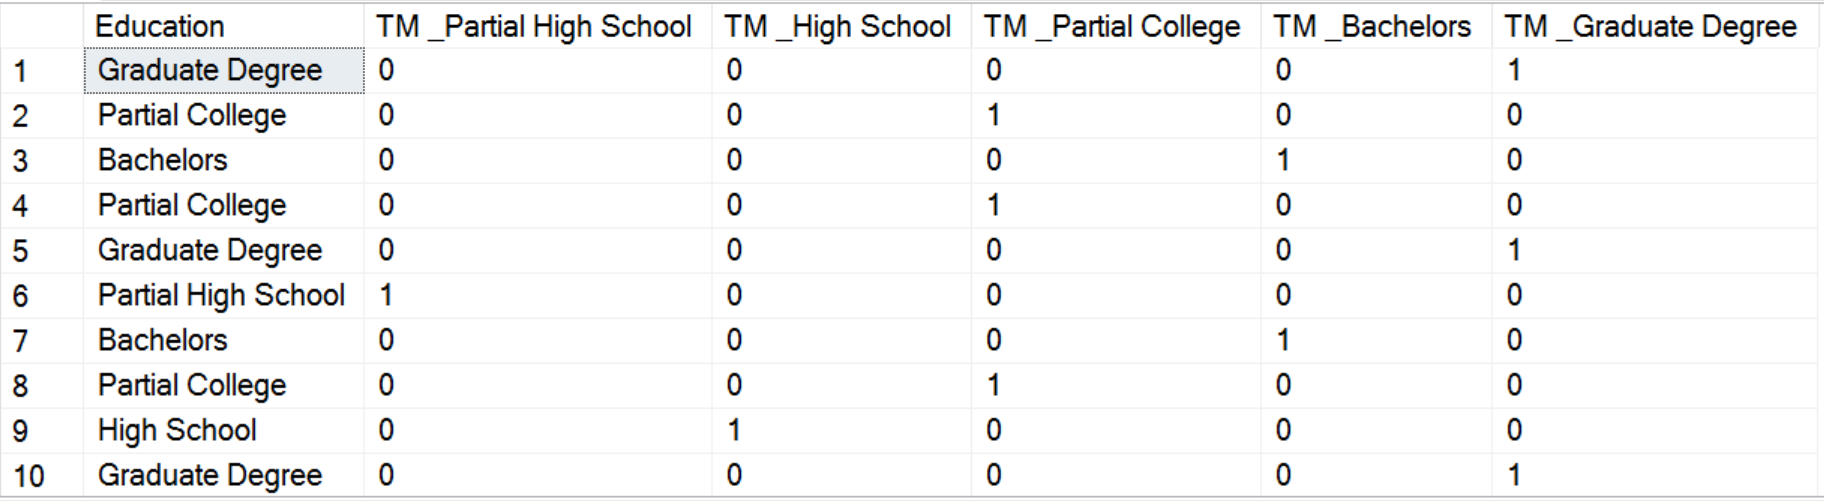
-- Getting dummies SELECT TOP 10 v.EnglishEducation AS Education, IIF(v.EnglishEducation = 'Partial High School', 1, 0) AS [TM _Partial High School], IIF(v.EnglishEducation = 'High School', 1, 0) AS [TM _High School], IIF(v.EnglishEducation = 'Partial College', 1, 0) AS [TM _Partial College], IIF(v.EnglishEducation = 'Bachelors', 1, 0) AS [TM _Bachelors], IIF(v.EnglishEducation = 'Graduate Degree', 1, 0) AS [TM _Graduate Degree] FROM dbo.vTargetMail AS v ORDER BY NEWID(); |
I ordered the results by the NEWID() function values just to quickly mix the rows, so I could get all possible distinct values of the Education SQL variable in first ten rows. Here are the results.
In R, there is a very convenient way to create dummies with the help of the dummies package, the dummy function. The following code installs the package and creates the dummies for the Education variable. For the sake of brevity, I am not showing the results of the code.
|
1 2 3 4 5 6 7 8 |
# Get dummies in R install.packages("dummies") library(dummies) # Create the dummies TM1 <- cbind(TM, dummy(TM$Education, sep = "_")) # Last 10 rows tail(TM1, 10) |
In Python, again you do not need to install any additional package. You already have the get_dummies() method in the pandas package. The following code shows how to create the dummies in Python. I don’t show the results of this code as well, as they are the same as in T-SQL and R.
|
1 2 3 |
# Create the dummies TM1 = TM[['Education']].join(pd.get_dummies(TM.Education, prefix = 'TM ')) TM1.tail(10) |
Conclusion
You can already see that, in data science, proper data preparation is not that simple as it might look at the first glimpse. And I am not done even with the discrete variables yet. In the next article on data science, I will show some possibilities for discretization, for transforming a continuous SQL variable to a discrete one.
Table of contents
Downloads
References
- R factor() function documentation
- Python data structures
- T-SQL CASE expression
- T-SQL IIF function
- R package dummies documentation
- Pandas get dummies() method

View all posts by Dejan Sarka
- Data Science in SQL Server: Unpivoting Data - October 29, 2018
- Data science in SQL Server: Data analysis and transformation – Using SQL pivot and transpose - October 11, 2018
- Data science in SQL Server: Data analysis and transformation – grouping and aggregating data II - September 28, 2018