
In the previous few articles in this series, we’ve set the foundations on how to create a report. We’ll take one step further and see how to use the SQL Server PIVOT table operator. We’ll start from the simple query and slowly progress towards dynamic SQL and PIVOT. Let’s start.
Data model and the general idea
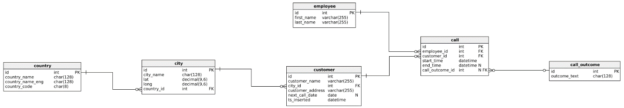
The data model we’ll use is the same one we’ve been using throughout this series.
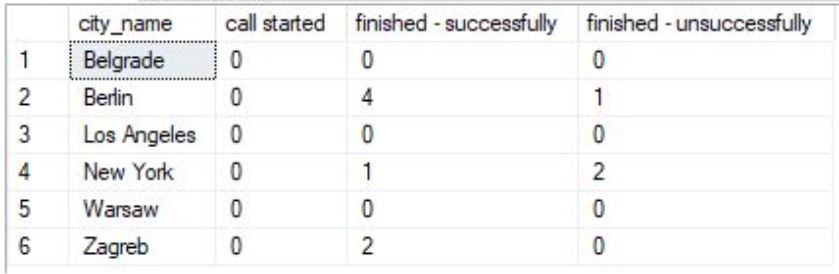
Our task today is to create a report (using SQL Server PIVOT operator) where each city will be in a separate row, and where we’ll count the number of all call outcomes related to each city. Therefore, all outcomes (all values from the dictionary) shall be columns in our report.
Since “a picture is worth a thousand words”, we’ll describe our final goal with the picture too.
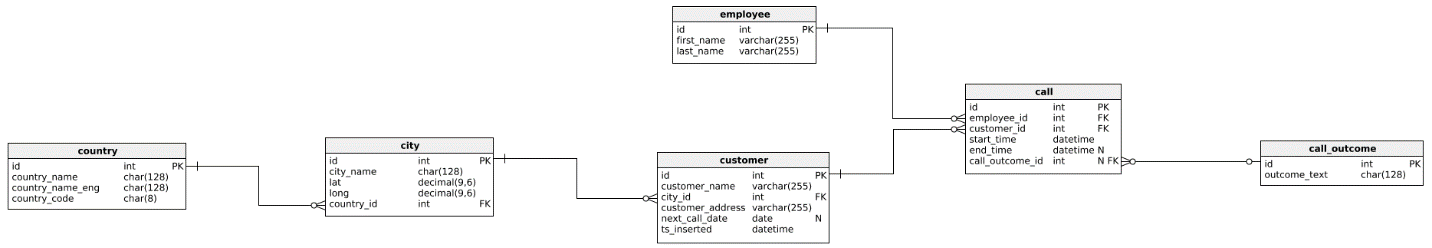
To achieve this, we’ll need to use data from 4 tables call, call_outcome, customer, and city. Therefore, it would be good that you take a closer look at the model below and analyze how these tables are related.
We’ll start by examining the data in the tables and, with each query, move one step closer to the desired result (query). The approach used here is the same as the one used in Learn SQL: Create a report manually using SQL queries article.
Report categories and data
The first set of queries we’ll start with is the one examining data currently present in all 4 tables we’ll need to use to create the report. We’ll be doing it so we can confirm that the final report returned what it should. After that, we’ll create queries which return reporting categories and the report data, as well as SQL Server PIVOT table queries.
|
1 2 3 4 5 |
-- 1 -- select data we need SELECT * FROM call; SELECT * FROM call_outcome; SELECT * FROM customer; SELECT * FROM city; |
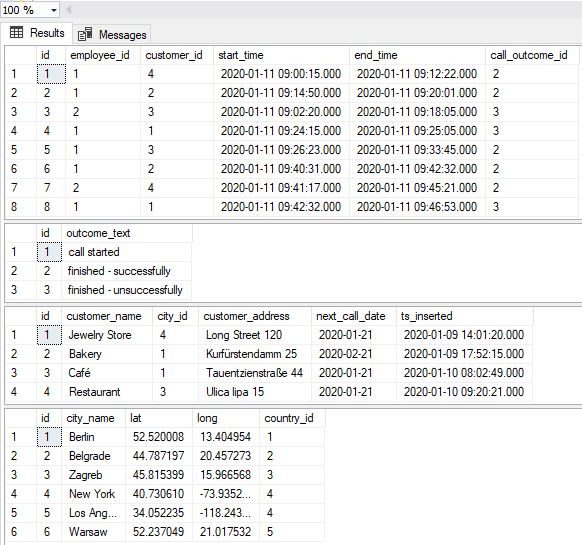
These queries are as simple as they could be, so there is nothing special to comment regarding their syntax. Regarding the data returned, we should be aware of the following:
- The city table contains 6 cities, and therefore we should have 6 rows in the final report
- There are 3 possible outcomes in the call_outcome table, so we should have 3 columns for outcomes (4 columns total -> one is for city name)
- The table call has 10 rows (only 8 on the picture above), so in the final table, the sum of all outcomes should be 10 (each call can have exactly 1 outcome)
The next thing to do is to prepare reporting categories. We want to have a combination of all cities and all possible call outcomes. To achieve that, we’ll use the CROSS JOIN (Cartesian product).
|
1 2 3 4 5 6 7 8 9 10 11 |
-- 2 -- report categories SELECT c.id AS city_id, c.city_name, co.id AS call_outcome_id, co.outcome_text FROM call_outcome co CROSS JOIN city c ORDER BY c.id ASC, co.id ASC; |
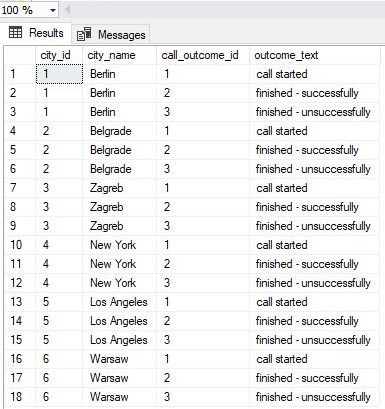
Having all the reporting categories shall guarantee that we’ll have a row in the report, no matter if that pair has data or not. And that is what we want – to see 0 in that reporting category, and not to miss that category entirely.
The next thing to do is joining all 4 tables containing the data we need.
|
1 2 3 4 5 6 7 8 9 |
-- 3 -- report data SELECT ci.id AS city_id, co.id AS call_outcome_id, DATEDIFF(SECOND, c.start_time, c.end_time) AS call_duration FROM call c INNER JOIN call_outcome co ON c.call_outcome_id = co.id INNER JOIN customer cu ON c.customer_id = cu.id INNER JOIN city ci ON cu.city_id = ci.id; |
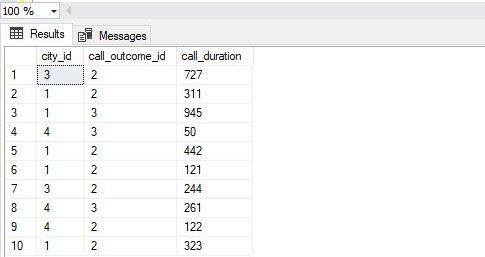
The query itself is not complex. In the result, we should notice that we have 10 rows, the same number as the number of calls we have in the database. Also, I’ve used the DATEDIFF function to return the duration of each call in seconds. I could simply put call.id here, but I wanted to remind ourselves of the DATEDIFF function we’ve mentioned in this article. We could use this duration if we need a SUM/AVG of seconds spent per each reporting category (city & call outcome).
Report without SQL Server PIVOT TABLE
Now we’re ready to join categories and data. We’ll use both previously mentioned queries as subqueries and join them using LEFT JOIN (in order to have all the categories present in the final output).
|
1 2 3 4 5 6 7 8 9 10 11 12 13 14 15 16 17 18 19 20 21 22 23 24 25 26 27 28 29 30 31 32 33 34 |
-- 4 -- report categories & data (without pivot) SELECT rc.city_id, rc.city_name, rc.call_outcome_id, rc.outcome_text, rd.call_duration FROM ( SELECT c.id AS city_id, c.city_name, co.id AS call_outcome_id, co.outcome_text FROM call_outcome co CROSS JOIN city c ) rc LEFT JOIN ( SELECT ci.id AS city_id, co.id AS call_outcome_id, DATEDIFF(SECOND, c.start_time, c.end_time) AS call_duration FROM call c INNER JOIN call_outcome co ON c.call_outcome_id = co.id INNER JOIN customer cu ON c.customer_id = cu.id INNER JOIN city ci ON cu.city_id = ci.id ) rd ON rc.city_id = rd.city_id AND rc.call_outcome_id = rd.call_outcome_id ORDER BY rc.city_id, rc.call_outcome_id; |
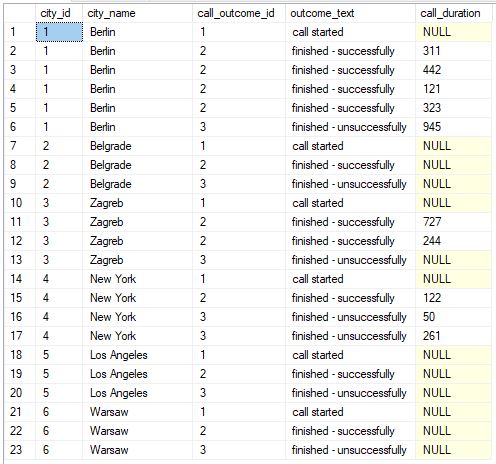
We have all 18 combinations (6 different cities * 3 different call outcomes), and we also have all 10 calls present here (rows with the call duration <> NULL).
Let’s now create the SQL Server PIVOT query.
SQL Server PIVOT TABLE (static)
So far, we’ve managed to pull the data we need, and we have them as the list. We could export data to Excel and make transformations there. We’ll actually do this in the upcoming article. Still, today, we want to solve this using SQL Server PIVOT operator. In this section, we’ll cover the “static” SQL Server PIVOT. Let’s take a look at the query used and the result first.
|
1 2 3 4 5 6 7 8 9 10 11 12 13 14 15 16 17 18 19 20 21 22 23 24 25 26 27 28 29 30 31 32 33 34 35 36 37 38 39 40 |
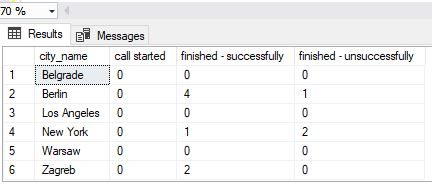
-- 5 -- report (including static PIVOT) SELECT * FROM ( SELECT -- rc.city_id, rc.city_name, -- rc.call_outcome_id, rc.outcome_text, rd.call_duration FROM ( SELECT c.id AS city_id, c.city_name, co.id AS call_outcome_id, co.outcome_text FROM call_outcome co CROSS JOIN city c ) rc LEFT JOIN ( SELECT ci.id AS city_id, co.id AS call_outcome_id, DATEDIFF(SECOND, c.start_time, c.end_time) AS call_duration FROM call c INNER JOIN call_outcome co ON c.call_outcome_id = co.id INNER JOIN customer cu ON c.customer_id = cu.id INNER JOIN city ci ON cu.city_id = ci.id ) rd ON rc.city_id = rd.city_id AND rc.call_outcome_id = rd.call_outcome_id ) report_data PIVOT( COUNT(call_duration) FOR outcome_text IN ( [call started], [finished - successfully], [finished - unsuccessfully]) ) AS pivot_table; |
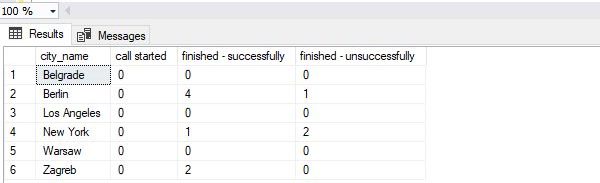
We can notice that the result is exactly what we wanted. We have each city in one row and all 3 categories for call outcomes in separate columns. If there is no data for a certain city-outcome pair, that cell shall contain the value 0.
Let’s comment on the SQL Server PIVOT query now. These are a few things I find important to mention here:
- In the first part of the query – report_data, we’ve copy-pasted the query from the previous section. The only change was that we had no ORDER BY and GROUP BY in this part of the query because they can’t be applied here (they should go after the final query result is generated)
- The PIVOT part of the query consists of 2 parts. In the first, we’ll define which aggregate function we want to apply. In our case, this is – COUNT(call_duration). In FOR part of the query, we’ll define columns. We literary list all the values we want to have as columns. This is hard-coding. If we add new value to the table, that won’t impact the query (and it should)
This query does its job, and it will work perfectly if we never change (add new, delete, update their names) call outcomes in the related table. That could prove to be the problem in cases we need to make changes in the dictionary. We don’t want to think if there is a query that doesn’t work as expected. To solve this, we’ll need to use a new concept – dynamic SQL.
Dynamic SQL Server PIVOT TABLE
Before moving to the code, let’s shortly explain what the dynamic SQL really is (we’ll give a much more detailed review of it in upcoming articles). The simplest explanation is that in SQL, you can “build” your queries as strings, and then pass that string as a parameter for the SQL Server stored procedure. This procedure shall execute the SQL statement(s) stored in that string (of course, if the syntax is OK).
While this might sound like something not so commonly used, it has quite a few places where it makes your life much easier. Creating a SQL Server PIVOT table query with an unknown number of columns is exactly one such case.
|
1 2 3 4 5 6 7 8 9 10 11 12 13 14 15 16 17 18 19 20 21 22 23 24 25 26 27 28 29 30 31 32 33 34 35 36 37 38 39 40 41 42 43 44 45 46 47 48 49 50 51 52 53 54 55 56 57 |
-- 6 -- report (including dynamic PIVOT) DECLARE @columns NVARCHAR(MAX) = '', @query NVARCHAR(MAX) = ''; -- get all column names for the table we need for pivot SELECT @columns += QUOTENAME(TRIM(co.outcome_text)) + ',' FROM call_outcome co ORDER BY co.outcome_text; -- remove "," from the end of the string SET @columns = LEFT(@columns, LEN(@columns) - 1); -- dynamic SQL query SET @query =' SELECT * FROM ( SELECT -- rc.city_id, rc.city_name, -- rc.call_outcome_id, rc.outcome_text, rd.call_duration FROM ( SELECT c.id AS city_id, c.city_name, co.id AS call_outcome_id, co.outcome_text FROM call_outcome co CROSS JOIN city c ) rc LEFT JOIN ( SELECT ci.id AS city_id, co.id AS call_outcome_id, DATEDIFF(SECOND, c.start_time, c.end_time) AS call_duration FROM call c INNER JOIN call_outcome co ON c.call_outcome_id = co.id INNER JOIN customer cu ON c.customer_id = cu.id INNER JOIN city ci ON cu.city_id = ci.id ) rd ON rc.city_id = rd.city_id AND rc.call_outcome_id = rd.call_outcome_id ) report_data PIVOT( COUNT(call_duration) FOR outcome_text IN ('+ @columns +') ) AS pivot_table;'; -- execute dynamic query EXECUTE sp_executesql @query; |
The idea of this approach is as follows:
- We’ll declare a variable where to store all column names (@columns), and the variable where to store the complete query (@query)
- Using the SELECT query, we’ll find all values stored in the outcome_text column. The following code – @columns += QUOTENAME(TRIM(co.outcome_text)) + ‘,’, shall append column name to the list of all previous column names returned by the query. The result is that we have all column names stored in the variable @columns
- In the @query variable, we’ll store the complete query from the previous section, except for the part where columns are defined. We’ll get this part from the variable @columns
- The last thing we need to do is to pass the complete query as the parameter to the SQL Server system procedure sp_executesql
The final result is the same as in the previous section, but this time we’re sure our query will work even if we make changes to the outcome.outcome_text values. Also, you can easily modify this query and calculate any other values, e.g., SUM/AVG call duration per city-outcome pair.
Conclusion
The SQL Server PIVOT operator gives you a completely new view of what you can achieve directly on the database layer. When combined with the dynamic SQL, this goes even further. I strongly encourage you to play with it – there is no better way of learning than to try it yourself. In the next article, we’ll show how we could use SQL query output and create tables and graphs in Excel (this shall work not only in SQL Server but generally).
Table of contents

His past and present engagements vary from database design and coding to teaching, consulting, and writing about databases. Also not to forget, BI, creating algorithms, chess, philately, 2 dogs, 2 cats, 1 wife, 1 baby...
You can find him on LinkedIn
View all posts by Emil Drkusic
- Learn SQL: How to prevent SQL Injection attacks - May 17, 2021
- Learn SQL: Dynamic SQL - March 3, 2021
- Learn SQL: SQL Injection - November 2, 2020