This article explains some of the popular SQL Server monitoring tools and techniques.
Database monitoring: a quick reminder
Database monitoring is a set of tools and techniques used to create and maintain an application infrastructure that is highly available and performs at high speed. It helps track the resource consumption, such as the amount of read and write operations, CPU and RAM consumption, storage, temporary storage size, etc. The resource consumption can be retrieved for a precise time or continuously measured in real time.
Several tasks could be performed with the information collected for monitoring, for example:
- Performance analysis of SQL queries, stored procedures, or applications.
- Analyzing low system performance.
- Analyzing how tables and indexes are used.
- Analyzing the impact of new features and updates (application, database management system, code optimization…)
- Predicting resource requirements (CPU, Memory, Disk …) based on previous monitoring output.
- The health of the database cluster.
- Assessing performance issues and abnormal behavior.
In the rest of this article, we will explain the different techniques available for SQL Server monitoring operations.
SQL Server Profiler
Since SQL Server 2000, Microsoft has provided a standalone tracing tool called SQL Server Profiler. This feature allows you to trace activities and operations executed on a SQL Server database engine or Analysis Service for later analysis. It is responsible for two primary SQL Server monitoring operations:
- Tracing: It can monitor all operations executed on an instance
- Replay: It can rerun all operations logged in a trace later
This tool can be accessed from Windows Explorer or SQL Server Management Studio.
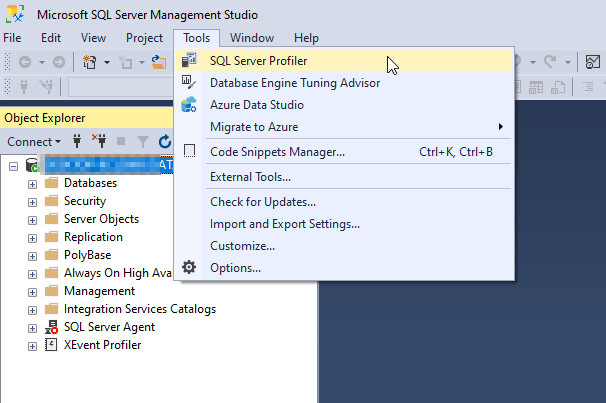
Figure 1 – Opening SQL Server Profiler from Management Studio
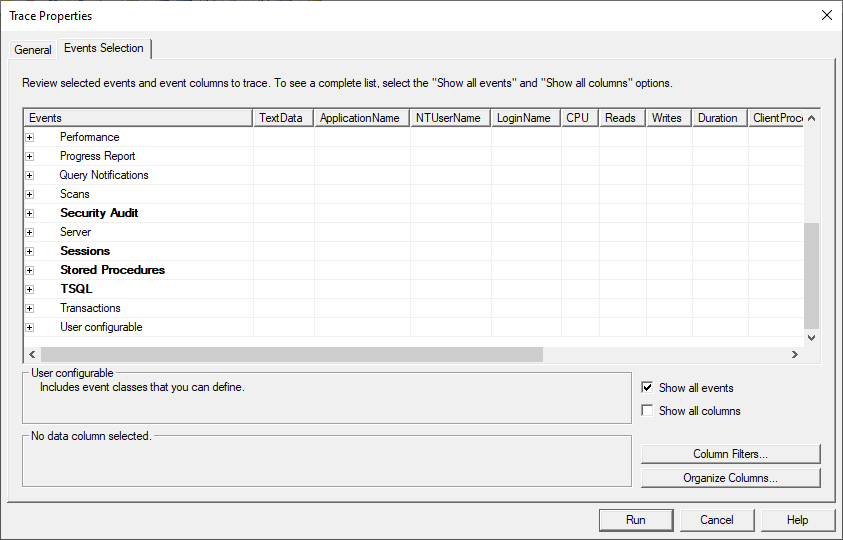
SQL Server Profiler allows tracing various operations performed by a specific server object or related to a specific database. Also, it can monitor specific databases or the whole SQL Server instance. Moreover, this tool can detect the commands executed by an application over a database for security and tuning purposes.
Figure 2 – SQL Server Profiler Events selection
Although Microsoft deprecated this tool several years ago, it is still one of the most popular and straightforward SQL Server monitoring tools.
More details on the SQL Server Profiler can be found in the article I published on the SQL Shack website: An overview of the SQL Server Profiler.
SQL Server Extended Events
SQL Server Extended Events is a performance monitoring tool integrated within SQL Server Management Studio. It was introduced with SQL Server 2008 as a replacement for SQL Server Profiler.
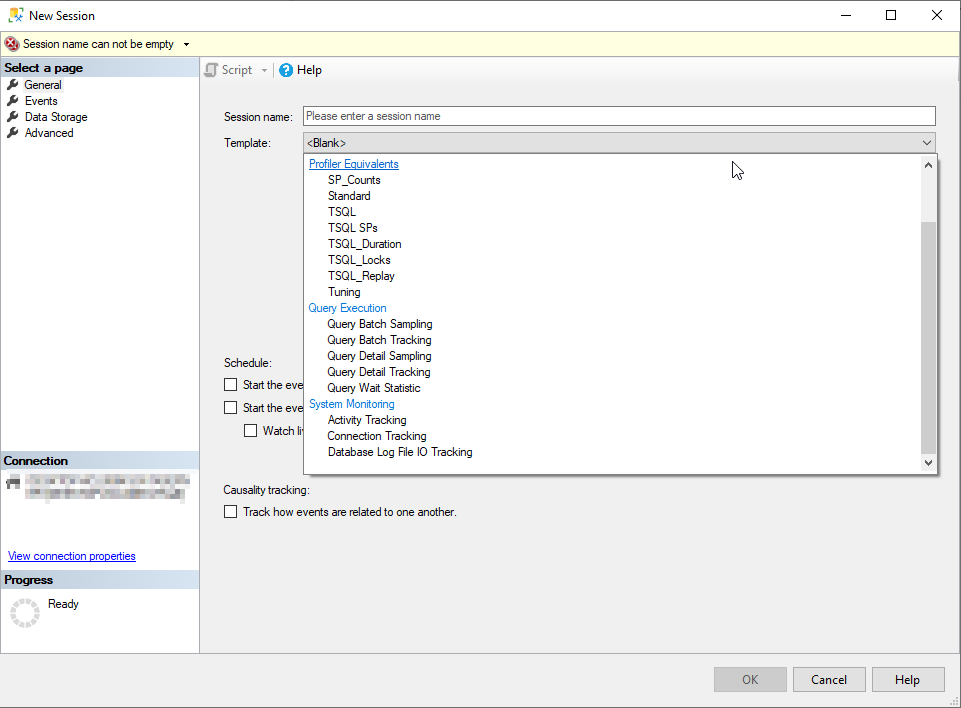
This SQL Server monitoring tool contains more templates than SQL Server Profiler.
Figure 3 – Choosing a monitoring template while creating an extended event
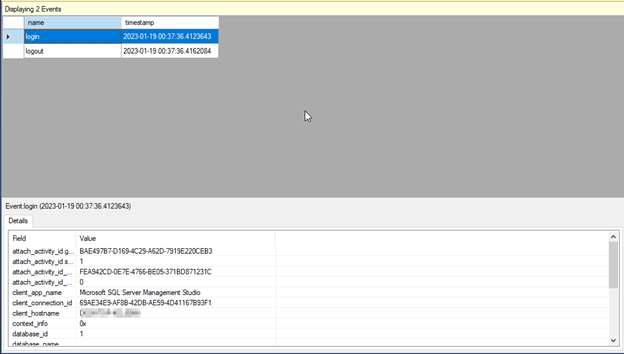
The extended event session will automatically start and collect data after we create it. Analyzing the collected data is possible using Watch Live Data.
Figure 4 – Watch live data
To learn more about SQL Server Extended Events, you can refer to the article on SQL Shack: Using SQL Server Extended Events to monitor query performance.
SQL Server Management Studio Reports
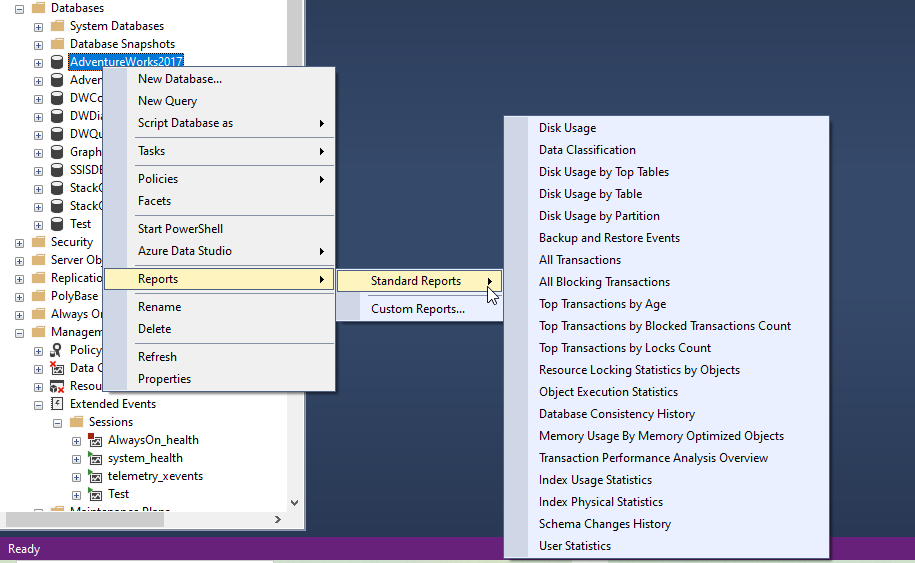
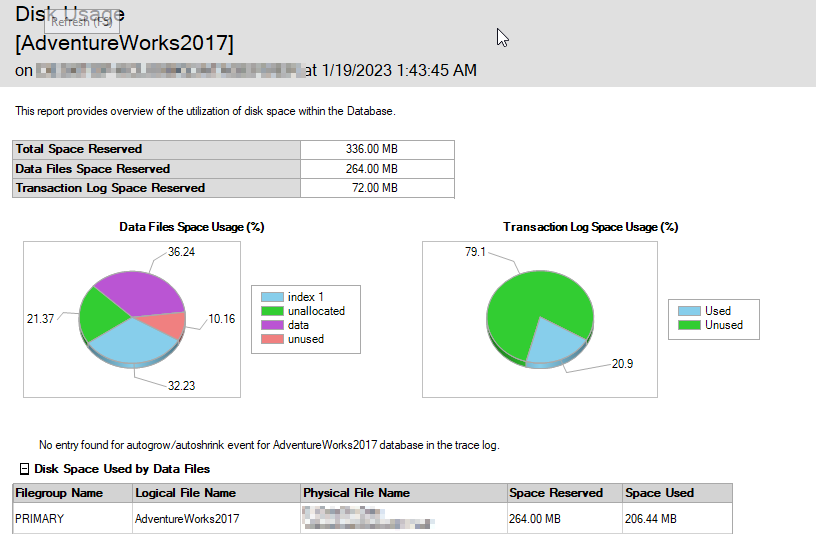
Another available SQL Server monitoring technique is utilizing the available reports within the SQL Server management studio. Those reports are available for different server objects (database, tables …).
Figure 5 – Generating reports
Users can choose from a list of standard reports available in the SQL Server management studio or create custom reports.
Figure 6 – Disk usage report
To learn more about SQL Server Management Studio standard reports, you can refer to the following article: SQL Server Management Studio performance reports.
SQL Server Management Studio Activity Monitor
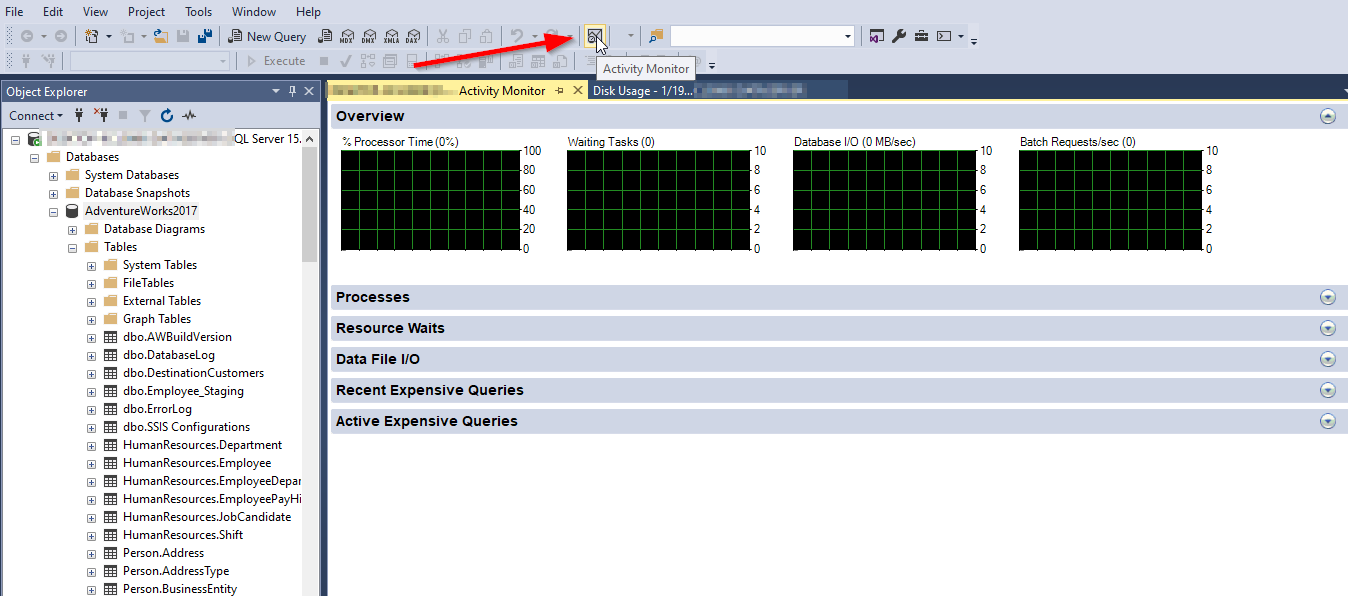
Another tool available within SQL Server Management Studio is the activity monitor. This tool displays information about SQL Server processes and how these processes affect the current instance of SQL Server. It provides information about the running processes, wait locks, read and write operations, and expensive queries.
Figure 7 – Activity Monitor
Dynamic management views and functions
Monitoring an SQL Server instance’s health, diagnosing problems, and tuning performance can be done using dynamic management views and functions. Those views and functions are available in two different scopes:
- Server-scoped dynamic management views and functions.
- Database-scoped dynamic management views and functions.
There are plenty of categories for the available system dynamic management views and functions:
- Always On Availability Groups
- Change Data Capture Related
- Change Tracking Related
- Common Language Runtime-Related
- Database Mirroring Related
- Database-Related
- Execution-Related
- Extended Events
- Filestream and FileTable
- Full-Text Search and Semantic Search
- Geo-Replication
- Index Related
- I/O Related
- PolyBase
- Memory-Optimized Table
- Object-Related
- Query Notifications Related
- Replication-Related
- Resource Governor-Related
- Security-Related
- Server-Related
- Service Broker-Related
- Spatial Data-Related
- Azure Synapse Analytics and Parallel Data Warehouse
- SQL Server Operating System-Related
- Stretch Database
- Transaction-Related
To learn more about dynamic management views and functions, you can refer to the following published articles on SQL Shack;
- Top 8 new (or enhanced) SQL Server 2017 DMVs and DMFs for DBAs
- Monitoring SQL Server TempDB with Dynamic Management Views
- Dynamic management views for monitoring availability replicas and databases for SQL Server Always On Availability Groups
- Discovering database-specific information using built-in functions and dynamic management views (DMVs)
- Discovering more SQL Server information using the built-in dynamic management view (DMVs)
Windows Resources Monitor
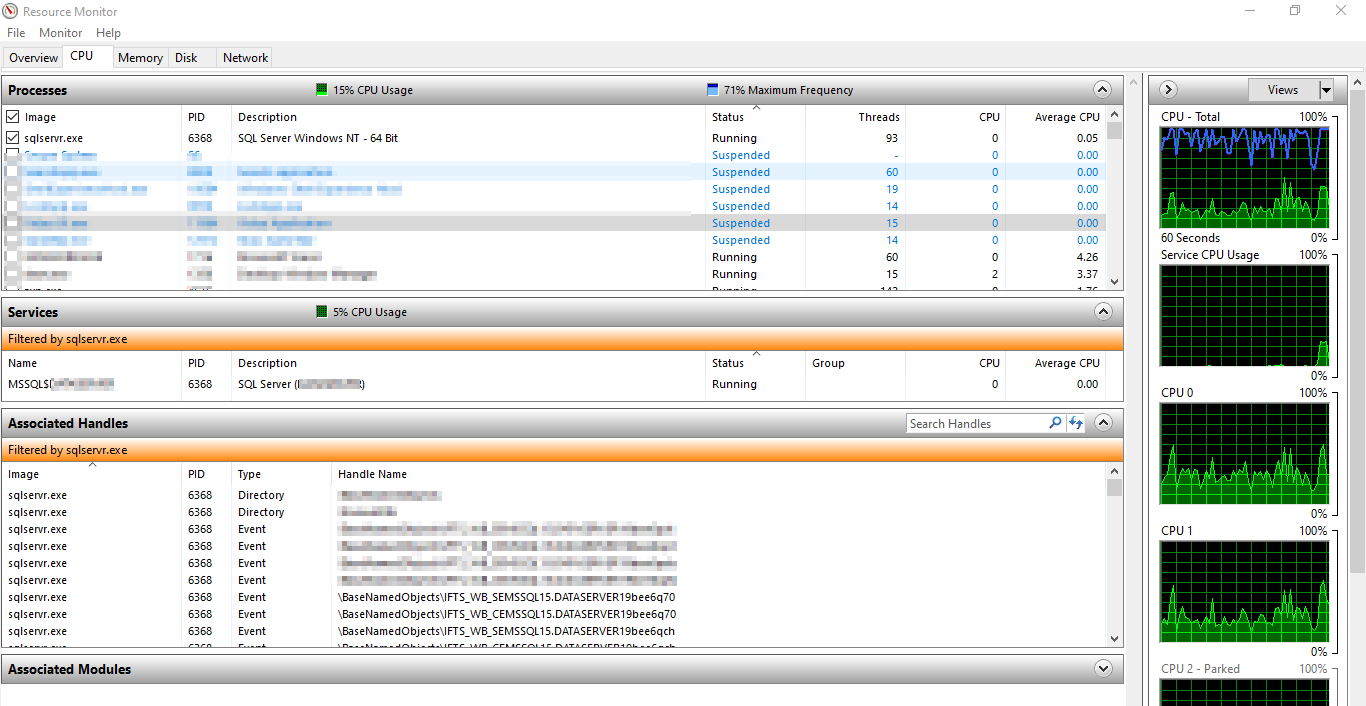
When installing SQL Server on Windows, users can benefit from the Windows resources monitor application available in the Task manager. We can get detailed information about the running SQL Server instance by clicking on the sqlservr.exe process, which relates to running SQL Server instance.
Figure 8 – Windows resource monitor
Third-Party Tools
After illustrating some of the SQL Server monitoring tools installed with SQL Server or found in Windows, this section illustrates some of the popular third-party tools.
Sp_Whoisactive stored procedure
As defined on their official website, sp_whoisactive is a comprehensive activity monitoring stored procedure that worked for all versions of SQL Server from 2005 through 2017. This stored procedure was created by Adam Machanic, and SQL Server DBAs widely use it.
To learn more about this stored procedure, you can refer to the following articles:
- Monitoring activities using sp_WhoIsActive in SQL Server
- An overview of the sp_WhoIsActive stored procedure
SQL Server First Responder Kit
The SQL Server first responder kit is an open-source project started by Brent Ozar. It contains a set of SQL Scripts and stored procedures that allow performing a health check for the SQL Server instance besides tuning several server objects such as stored procedures and indexes.
Figure 9 – Popular stored procedure in the first responder kit
Also, it contains scripts for analyzing query plan cache, backup and restore operations, and query performance.
Power BI dashboard
To visualize the output of the Real-Time Performance Advisor procedure “sp_blitzfirst”, Brent Ozar provided a Power BI dashboard that can facilitate reading the state of the SQL Server instance.
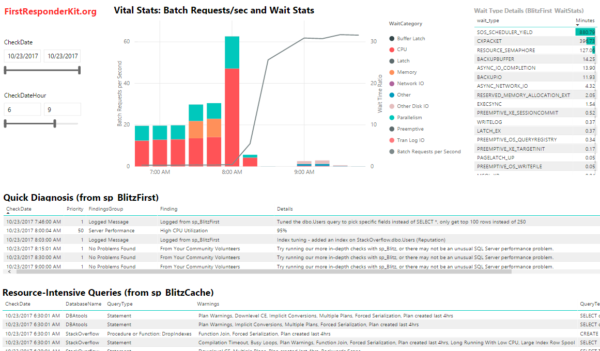
Figure 10 – Power BI dashboard (Reference)
Quest Foglight for SQL Server
Foglight for SQL Server quickly diagnoses and resolves performance problems and optimizes your workload to prevent future performance issues. This SQL Server monitoring tool includes real-time and historical diagnostics, reporting, and more, so you can confidently ensure the health of your entire database environment.
Summary
In this article, we explained SQL server monitoring and why it is essential. Then, we illustrated different free SQL server monitoring tools and services which provide critical information on the server and databases. Then, we listed some of the third-party commercial tools.
- An overview of SQL Server monitoring tools - December 12, 2023
- Different methods for monitoring MongoDB databases - June 14, 2023
- Learn SQL: Insert multiple rows commands - March 6, 2023

