
In this article, we will explore how we can use SQL Server extended events to monitor query performance in SQL Server.
Introduction
Monitoring the query performance is one of the important diagnosis methods to uncover poorly performing queries. However, sometimes this can be a bit of struggling activity. Therefore, we have to use proper tools and methods to monitor and analyze the query performance metrics. In order to monitor the query performance, we can use the following tools:
- Query Store
- Dynamic Management Views and Functions (DMV)
- Extended Events
- Performance Monitor
- Activity Monitor
- 3rd party SQL Server Monitoring tools
- SQL Server Management Studio (SSMS) reports
In the next sections of this article, we will focus on usage details of the SQL Server extended events to monitor query performance.
What is SQL Server extended events?
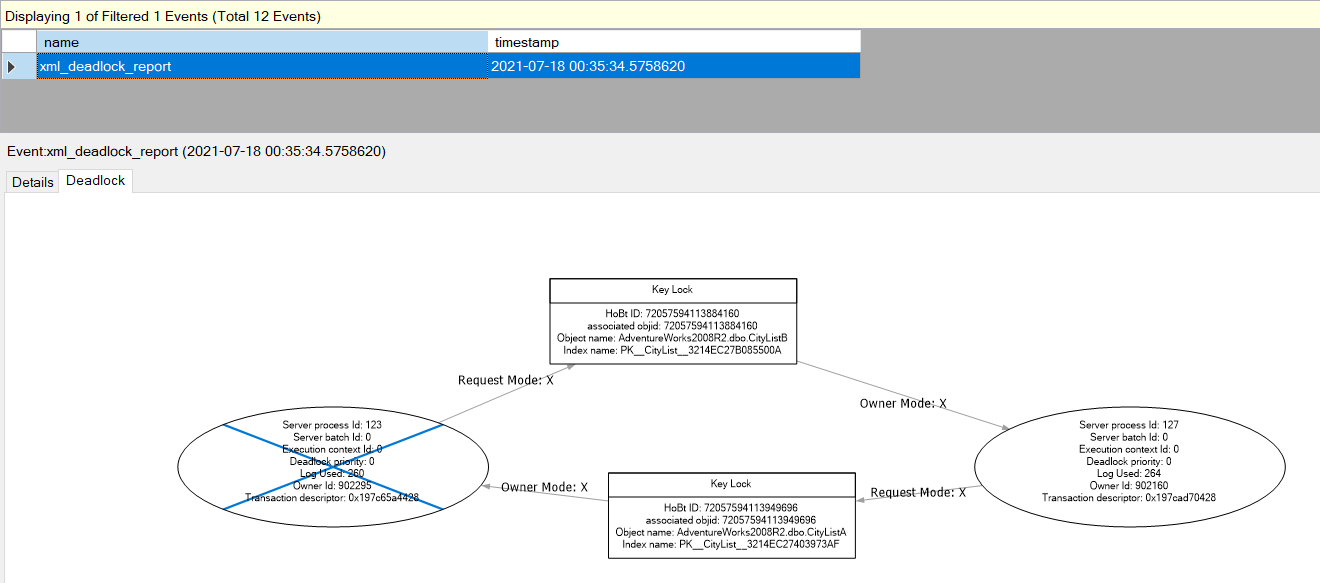
SQL Server Extended Events is a performance monitoring tool that helps to collect and monitor the database engine actions to diagnose problems in SQL Server. Microsoft has introduced the extended events with the SQL Server 2008 and then decided to retire the SQL profiler. Behind taking such a decision, there were some disadvantages of SQL profiler. The main problem of the profiler was related to performance because it consumes many system resources, and this situation was affecting the database performance negatively. SQL Server extended events do not impact the performance of the SQL Server as the profiler does and it also offers numerous events that help to troubleshoot the query performance and other problems. Such as to resolve the deadlock problems, it can be the first option and according to my idea, it must be the first option.
Identifying the long-running queries
One of the common complaining issues of SQL Server is long-running queries. For this reason, as a first step, we need to detect long-running queries to troubleshoot these queries. To define a query as problematic in terms of the runtime of a query, a certain threshold value must be determined for the relevant database because the database environment waiting tolerance can change. Some systems cannot tolerate microsecond wait, while some systems have higher thresholds for long wait times. As we stated, we can use different tools to find out the poorly performing queries. However, using extended events can be one of the effective methods to diagnose these queries in our database engine. At this point, the disorienting problem will be which event to use because SQL Server offers numerous events. The sql_statement_completed event captures all queries which are executed against in the database and it involves the following metrics:
- CPU time
- Duration of the query execution
- Number of the logical reads
- Number of the physical reads
- SQL text and statement
- Number of the writes
- Client hostname
- Client application name
Create an extended event session to identify the long-running queries
We can use the SQL Server Management Studio (SSMS) to create an SQL Server extended events session. At first, we expand the Management folder and right-click on the Sessions.
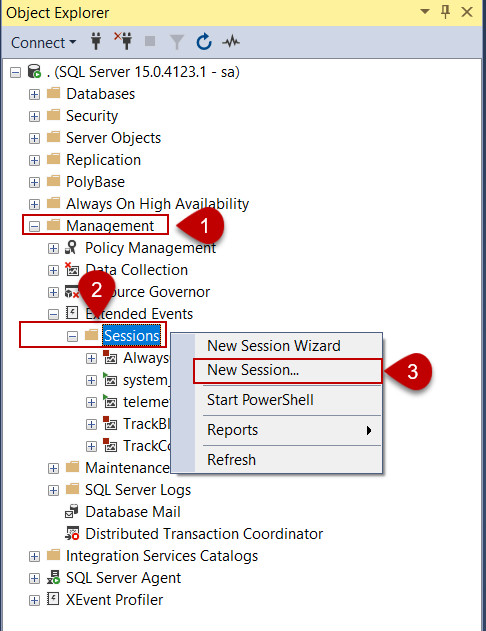
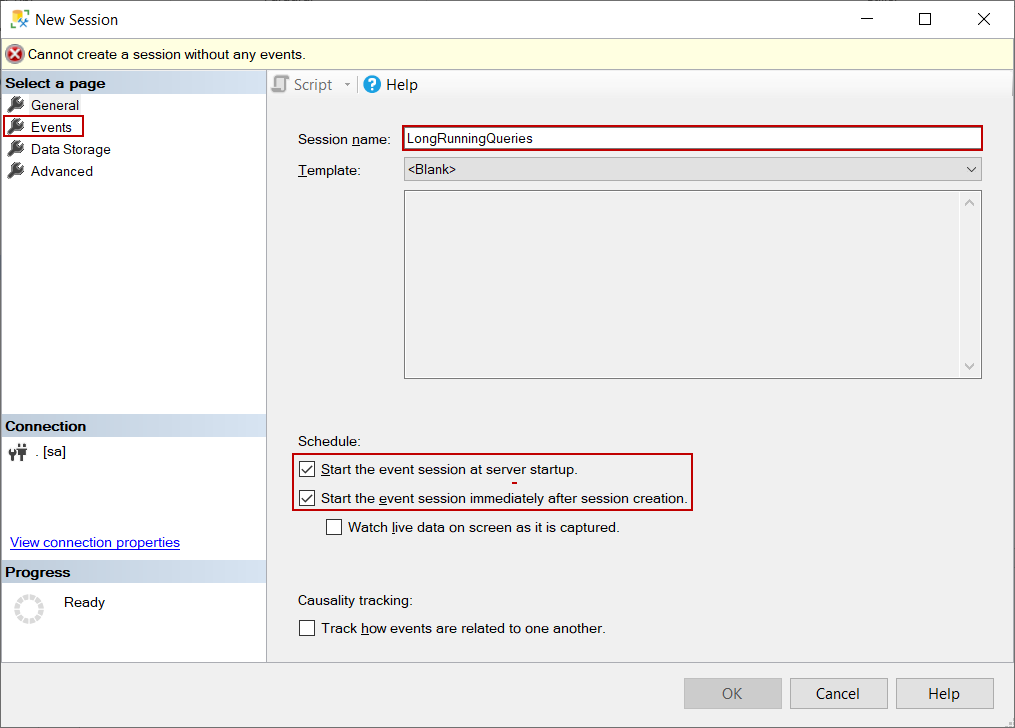
On the menu, we click the New Session… option to create a new extended event session, and then the New Session window will appear. In this window, we give a name to our extended event session and check the following options:
- Start the event session at server startup
- Start the event session immediately after session creation.
These two options allow starting the extended event session automatically when the database service is started and also after the creation of the session it automatically begins to collect data.
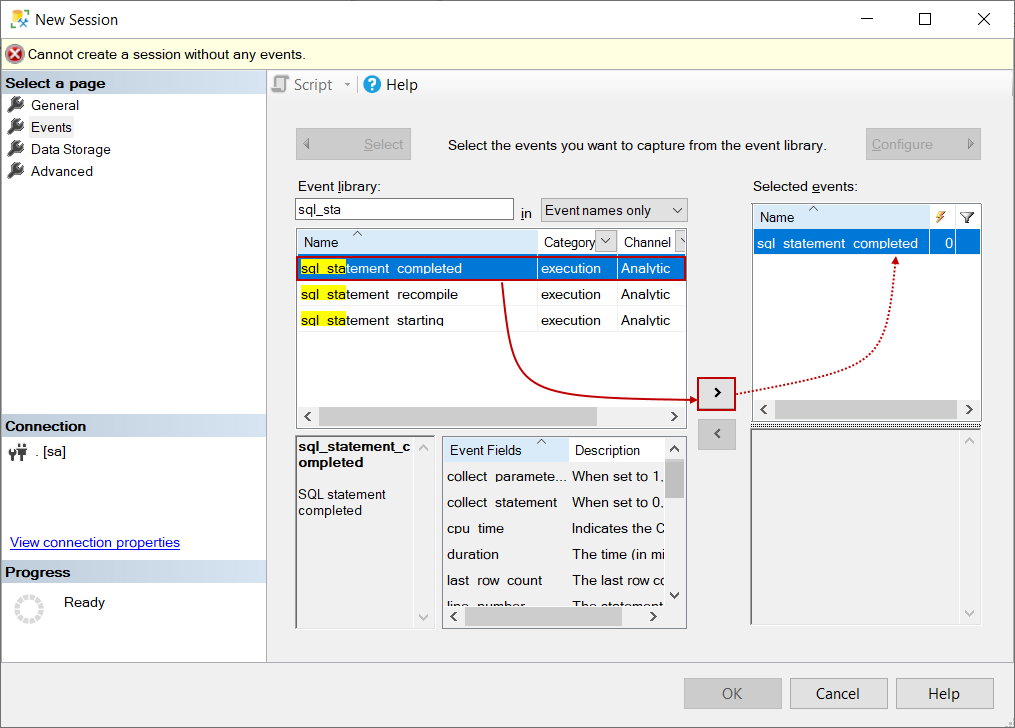
After giving a name to the session then we jump into the Events tab. Events are the objects that are triggered when a specific action occurs. On this screen, we can find all events and can filter the sql_statement_completed event. After finding the sql_statement_completed event, we send out it to the Selected events list through the right arrow button.
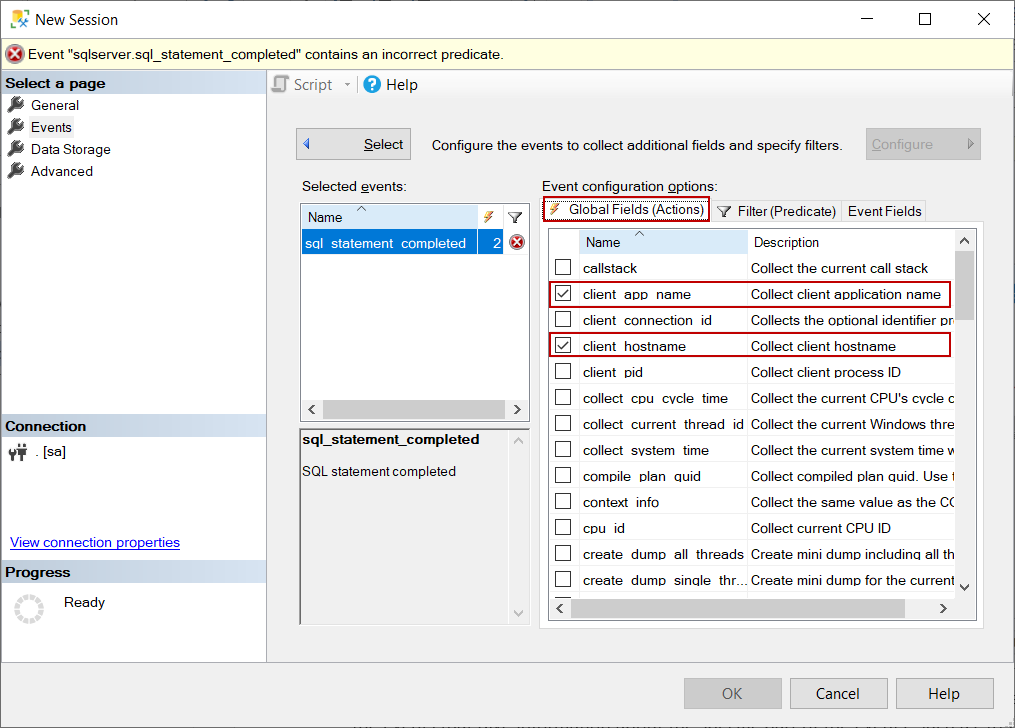
We click the Configure button to select the global event fields. Event fields are the elements of the events that give information about the specific part of the events. Such as, to find the application name that fired the event we need to choose the client app name field. We select the client app name and client hostname on the Global Fields (Action) list.
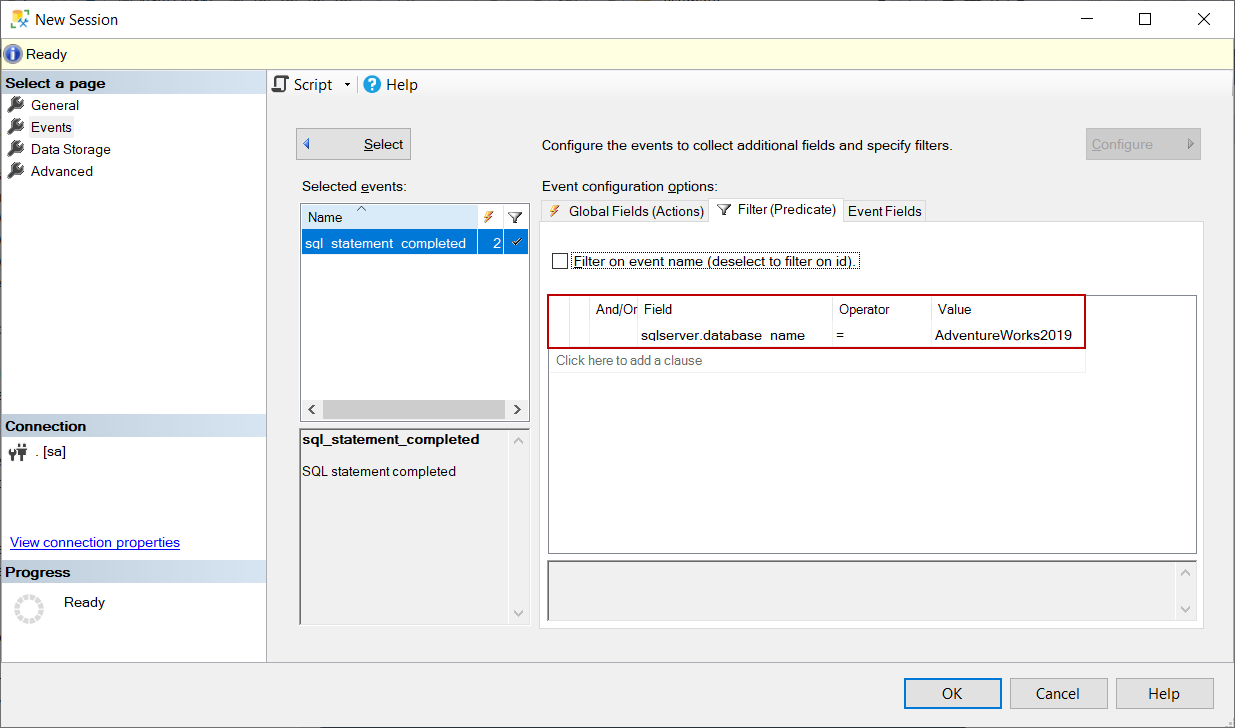
We can filter any specific event field on the Filter (Predicate) tab. For our sample SQL Server extended events session, we filter only the database name so that we will only track the SQL statements that are executed in that database.
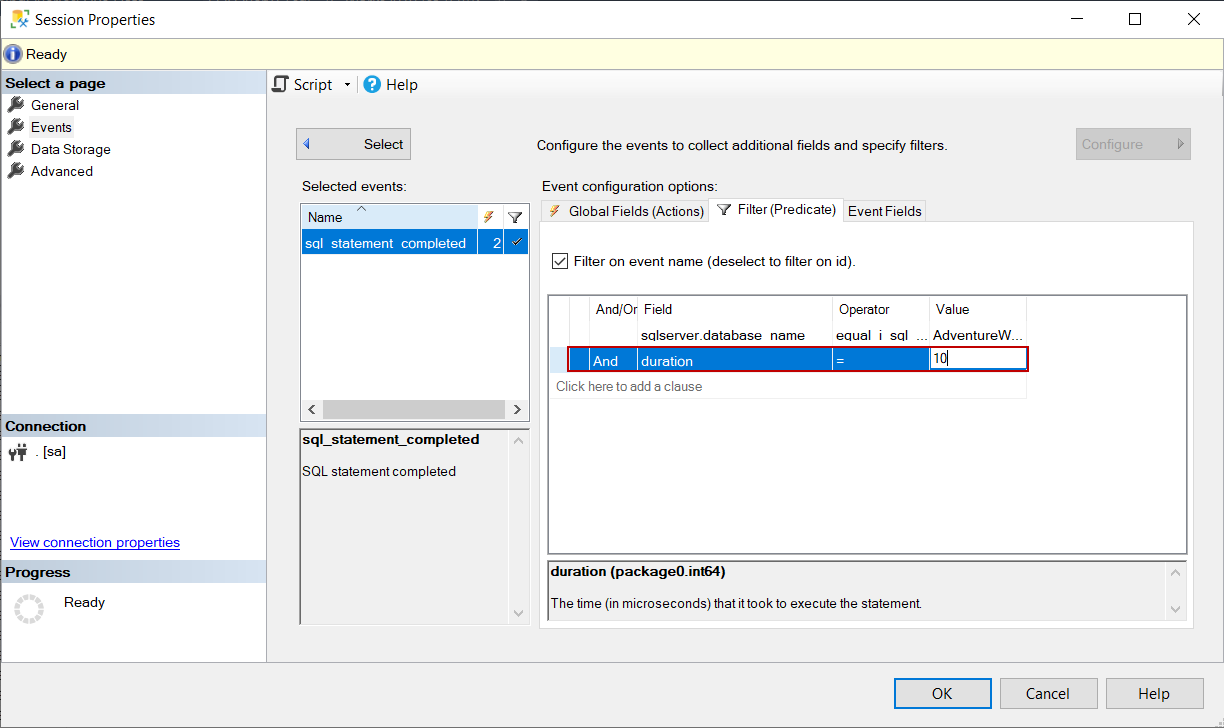
At the same time, we can filter the duration if we have already set a threshold for poor-performing queries. This option can help us troubleshoot query performance problems.
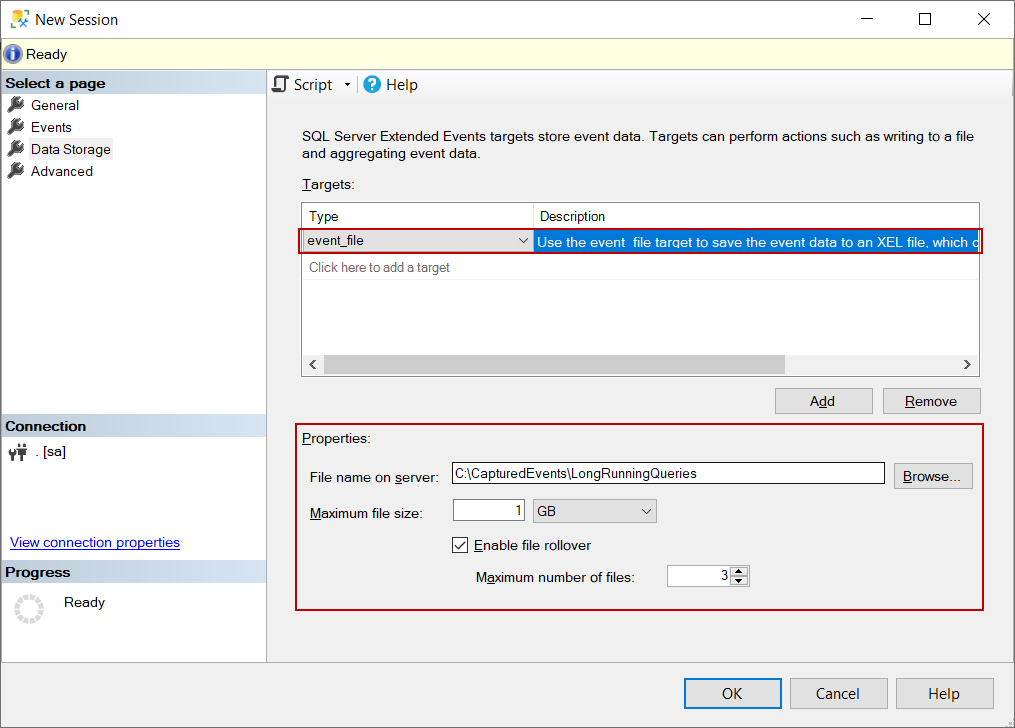
On the Data Storage tab, we will choose where the SQL Server extended events will store the collected data. We select the event file to write the collected data into an XEL file. After selecting the event_file type, we need to define the file location and the maximum size of the file. When the Enable file rollover option is checked, after the extended event XEL file reaches this maximum file size limit a new XEL file is created with the same filename but appends a sequence number to the end of the file name.
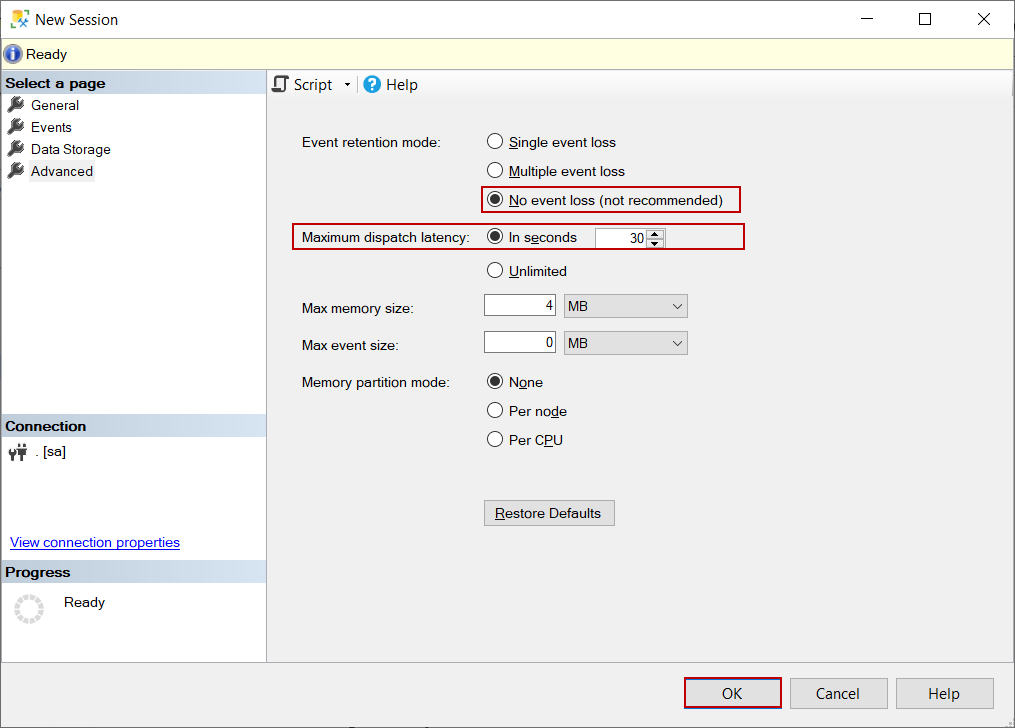
On the Advanced tab, we can find some detailed settings. We can set how much tolerance we have for data loss for the session we created in the event storage mode options. We will choose the No event loss but this option can affect the system performance negatively the databases which have heavy workloads. Another option is Maximum dispatch latency and this option specifies the maximum duration that an event can be kept in the buffer before being written to the target. Finally, we click the OK button and create the extended event.
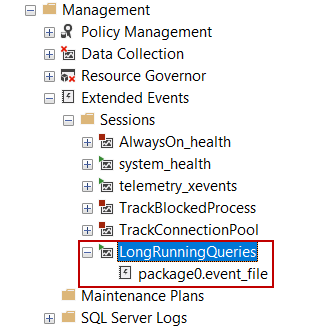
After creating the extended event session, it will be added to the extended events list.
Analyze the collected data
After we create the extended event session, it will automatically start and begin to collect the data. We can use the Watch Live Data option to analyze the collected data. For example, after executing the following query in the Adventureworks database, this query will be captured by the extended event.
|
1 2 3 4 |
SELECT SO.AccountNumber FROM Sales.SalesOrderHeader SO INNER JOIN Sales.SalesOrderDetail SD ON SO.ModifiedDate = SD.ModifiedDate |
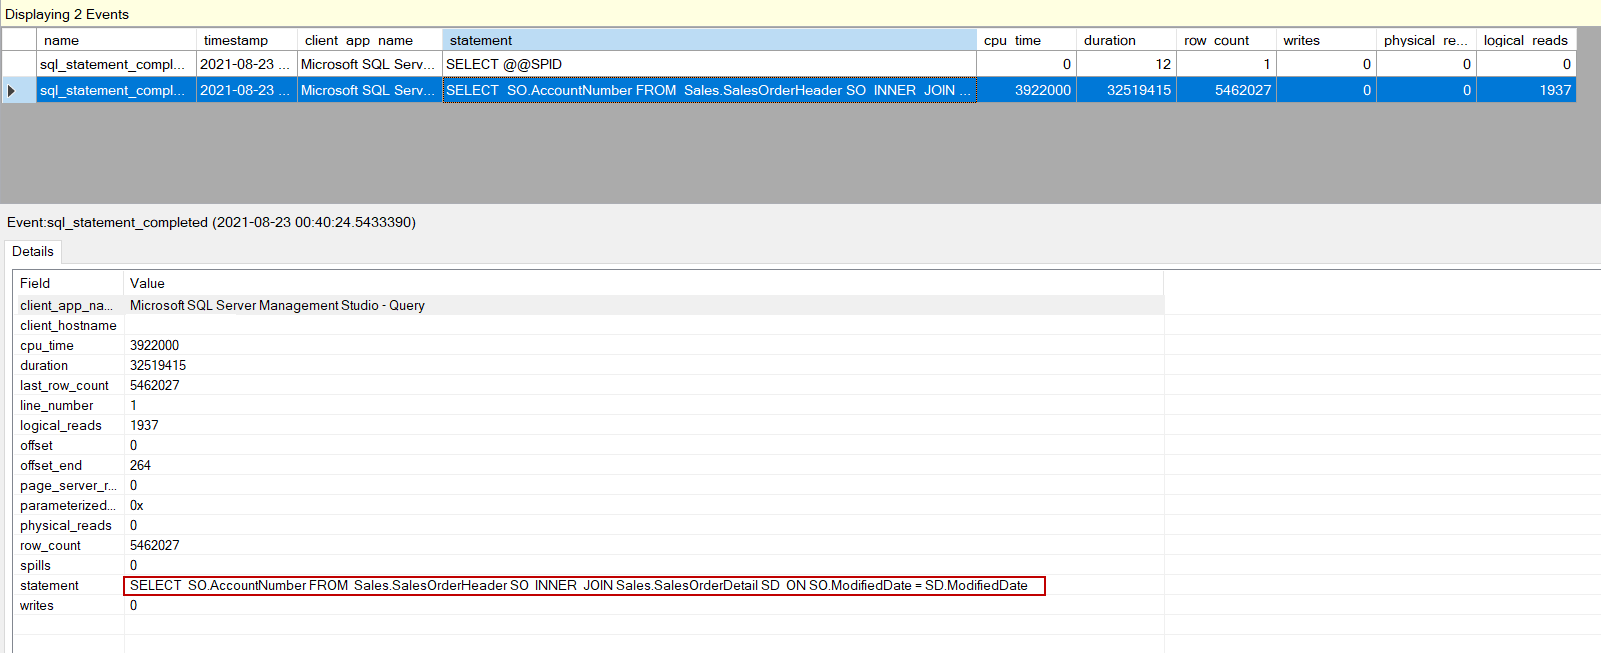
However, using a query is can be a much better way to analyze the query performance and can be more helpful to resolve the query performance issues. To do this at first, we need to find the location of the XEL files and read this file with help of the fn_xe_file_target_read_file.
|
1 2 3 4 5 6 7 8 9 |
SELECT s.name, CAST(t.target_data AS XML).value( '(EventFileTarget/File/@name)[1]', 'VARCHAR(MAX)' ) AS fileName FROM sys.dm_xe_sessions AS s INNER JOIN sys.dm_xe_session_targets AS t ON s.address = t.event_session_address WHERE t.target_name = 'event_file' AND name = 'LongRunningQueries'; SELECT CAST(event_data AS XML) AS event_data FROM sys.fn_xe_file_target_read_file( 'C:\CapturedEvents\LongRunningQueries_0_132741419843740000.xel', NULL, NULL, NULL ); |
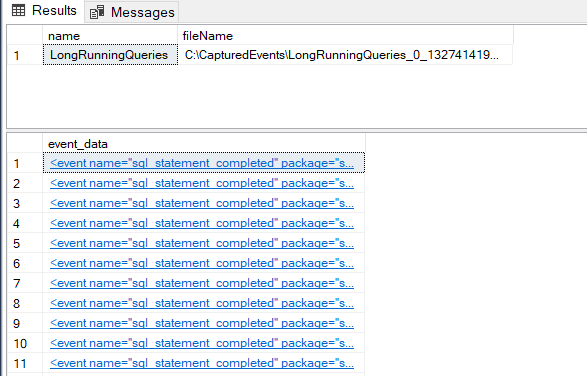
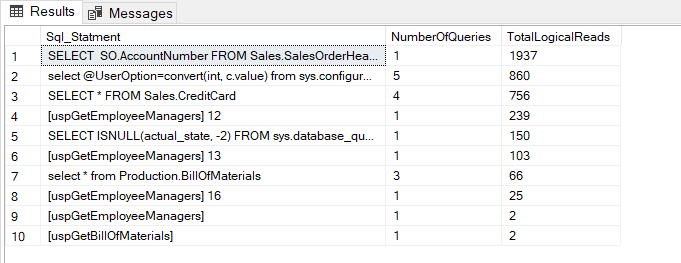
As we can see, the captured data is stored in the XML format and we need to convert them into the relational format. The following query returns the TOP 10 queries that generate the most I/O workload on the database.
|
1 2 3 4 5 6 7 8 9 10 11 12 13 14 15 16 17 18 19 20 21 22 23 24 25 26 27 28 29 30 31 32 33 34 35 36 37 |
drop table if exists #EX_FilePath drop table if exists #AnalyzeTable SELECT s.name, CAST(t.target_data AS XML).value( '(EventFileTarget/File/@name)[1]', 'VARCHAR(MAX)' ) AS fileName INTO #EX_FilePath FROM sys.dm_xe_sessions AS s INNER JOIN sys.dm_xe_session_targets AS t ON s.address = t.event_session_address WHERE t.target_name = 'event_file'; DECLARE @EventFileTarget AS NVARCHAR(500); SELECT @EventFileTarget = fileName FROM #EX_FilePath WHERE name = 'LongRunningQueries'; SELECT * INTO #AnalyzeTable FROM(SELECT n.value( '(@name)[1]', 'varchar(50)' ) AS event_name, n.value( '(@package)[1]', 'varchar(50)' ) AS package_name, n.value( '(@timestamp)[1]', 'datetime2' ) AS [utc_timestamp], n.value( '(data[@name="physical_reads"]/value)[1]', 'bigint' ) AS physical_reads, n.value( '(data[@name="logical_reads"]/value)[1]', 'bigint' ) AS logical_reads, n.value( '(data[@name="writes"]/value)[1]', 'bigint' ) AS writes, n.value( '(data[@name="row_count"]/value)[1]', 'bigint' ) AS row_count, n.value( '(action[@name="client_app_name"]/value)[1]', 'nvarchar(max)' ) AS client_app_name, n.value( '(data[@name="cpu_time"]/value)[1]', 'bigint' ) AS cpu_time, n.value( '(data[@name="duration"]/value)[1]', 'bigint' ) / 1000 AS duration_ms, n.value( '(data[@name="statement"]/value)[1]', 'nvarchar(max)' ) AS sql_text FROM ( SELECT CAST(event_data AS XML) AS event_data FROM sys.fn_xe_file_target_read_file( @EventFileTarget, NULL, NULL, NULL ) ) AS ed CROSS APPLY ed.event_data.nodes( 'event' ) AS q(n)) AS TMP_TBL SELECT TOP 10 sql_text AS Sql_Statment ,COUNT(*) AS NumberOfQueries, SUM(logical_reads) AS TotalLogicalReads FROM #AnalyzeTable GROUP BY sql_text ORDER BY 3 DESC |
There is no doubt that we can create other alternatives for this query to analyze the query performance within different aspects.
How to detect the TempDb spills with SQL Server extended events
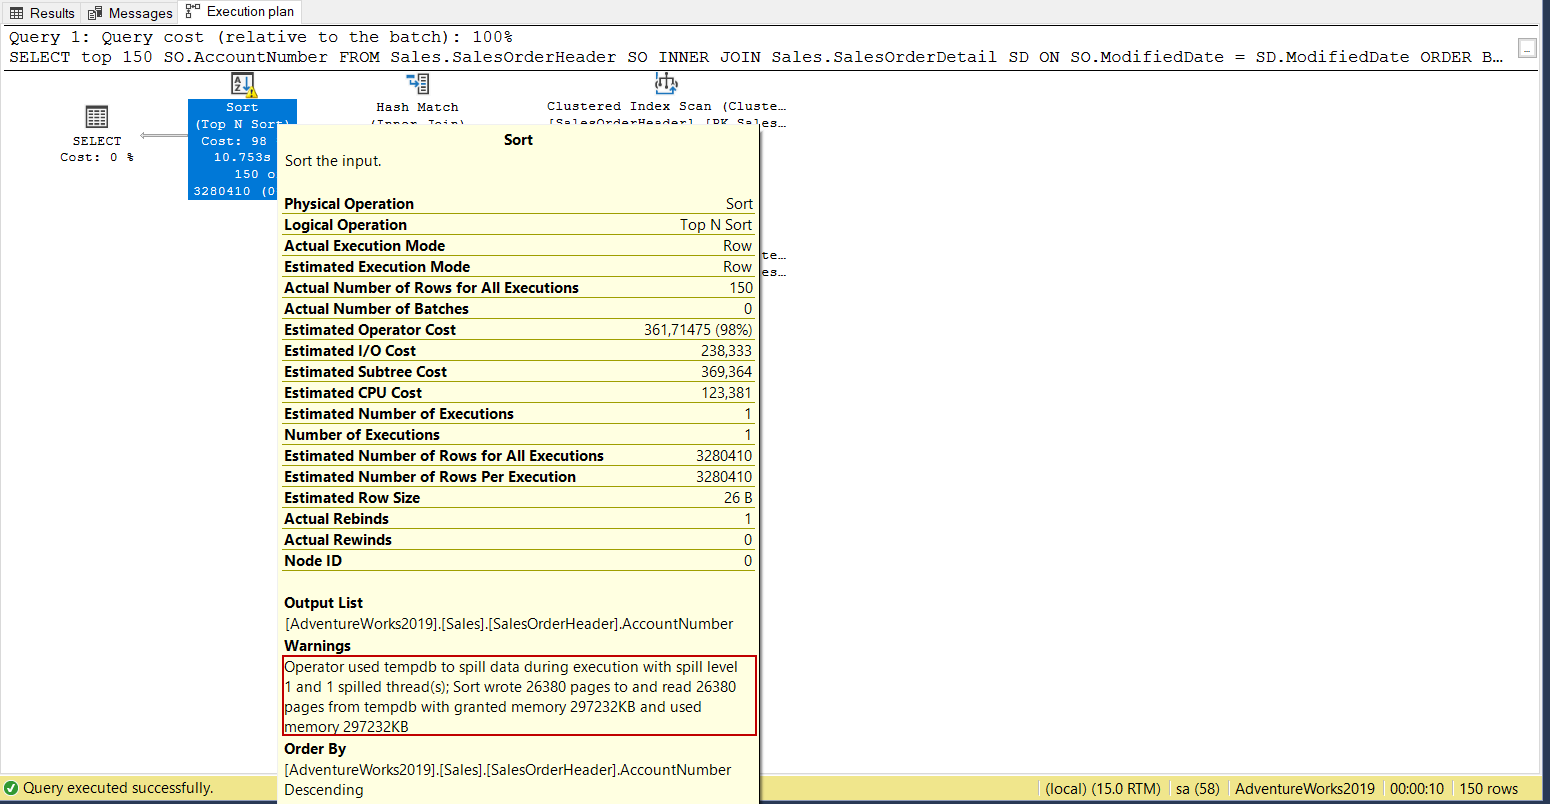
Query optimizer estimates how many rows are returned by a query and then based on this estimation it requests the memory grant from the SQL Server database engine. In some cases, the optimizer makes inaccurate estimations so the memory grant is not enough for the query. Under this circumstance, SQL Server requires much memory during the execution of the query and it uses tempdb database. However, using tempdb instead of memory is not a good choice, so it degrades the query performance. We can detect the queries which are spilled out in the tempdb using the SQL Server extended events. The spill shows the number of pages that were written while spilling data by the statement. For example, we enable the active execution plan and execute the following query.
|
1 2 3 4 5 6 |
SELECT top 150 SO.AccountNumber FROM Sales.SalesOrderHeader SO INNER JOIN Sales.SalesOrderDetail SD ON SO.ModifiedDate = SD.ModifiedDate ORDER BY SO.AccountNumber DESC OPTION (USE HINT ('DISABLE_OPTIMIZER_ROWGOAL'),MAXDOP 1); |
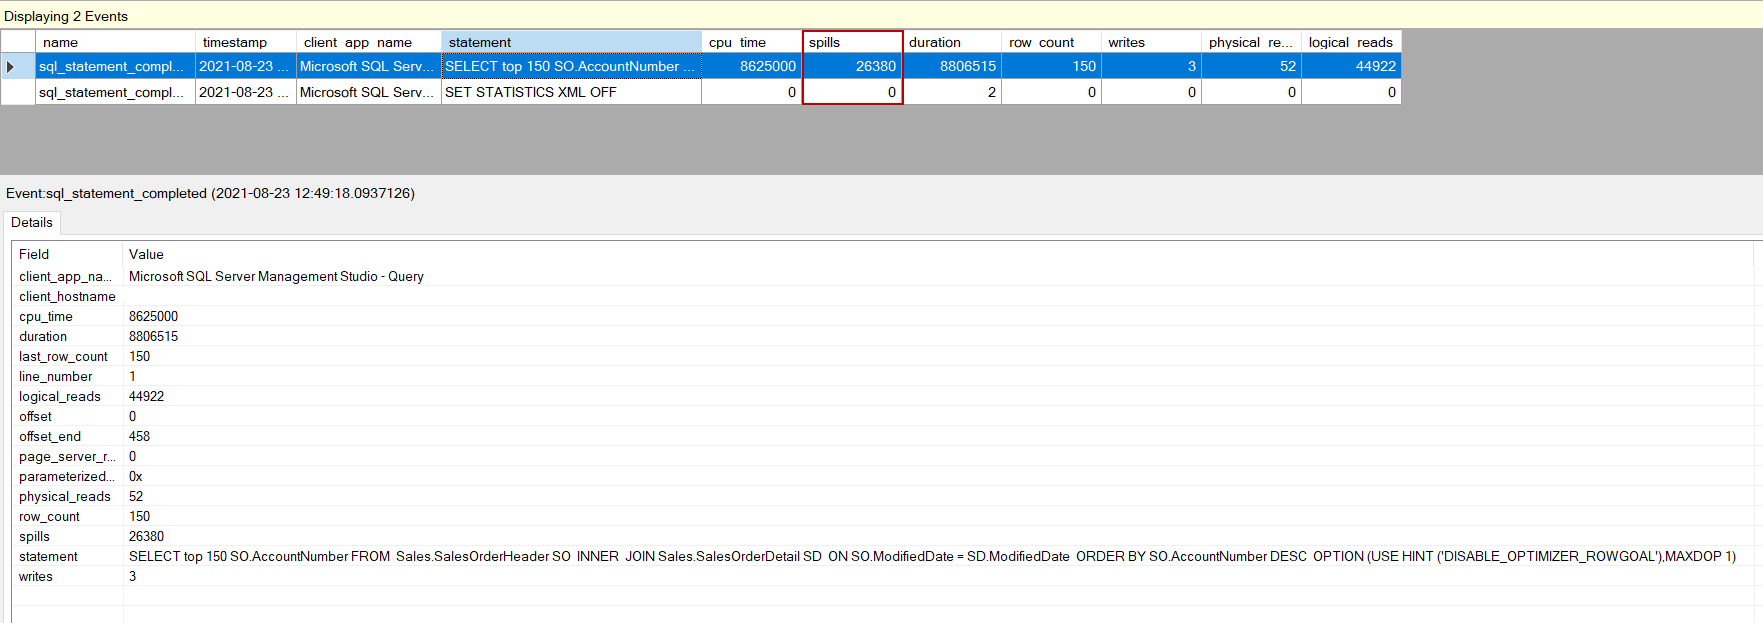
At the same time, we can see how many pages are spilled during the execution of the query in the SQL Server extended events session.
Conclusion
In this article, we learned to use SQL Server extended events to monitor the query performance in SQL Server.

Most of his career has been focused on SQL Server Database Administration and Development. His current interests are in database administration and Business Intelligence. You can find him on LinkedIn.
View all posts by Esat Erkec
- SQL Performance Tuning tips for newbies - April 15, 2024
- SQL Unit Testing reference guide for beginners - August 11, 2023
- SQL Cheat Sheet for Newbies - February 21, 2023