

This article explains what database monitoring is and why it is essential. Then, it illustrates the different methods for monitoring MongoDB NoSQL databases.
What is database monitoring?
Database monitoring consists of a set of techniques and operations that aims to maintain the health and performance of a database management system. Monitoring tools collect information related to the read and write operations, disk and memory usage, indexes, cache memory, and other information that could be useful.
Why is database monitoring needed?
Several tasks could be performed with the information collected for monitoring, for example:
- Analyzing the performance of SQL queries, Stored procedures, or applications.
- Identifying the cause of low system performance.
- Analyzing the tables and indexes usage.
- Assessing the impact of updates and newly added features (application, database management system, code optimization…)
- The collected information can help predict the resource requirements (CPU, Memory, Disk …).
- Database cluster health.
- Observe the presence of abnormal behavior and performance issues.
How is data monitoring performed?
Mainly database monitoring is performed using tools installed within the database management system (command line, user interface) or third-party tools. There are two approaches for database monitoring:
- Obtaining information about a specific point in time in the database’s state.
- Recording historical information on specific types of database events using a database event monitor.
Monitoring MongoDB databases
This section illustrates the different approaches for monitoring MongoDB databases. The monitoring techniques and tools could be grouped into five categories:
- The MongoDB tools providing statistics about the database and server.
- The MongoDB commands providing statistics about the database and server.
- The MongoDB Compass (official desktop user interface) monitoring tools.
- The MongoDB free cloud monitoring.
- Third-party tools for monitoring MongoDB databases.
Tools for monitoring MongoDB
Several utilities included with the MongoDB distribution provide statistics about instances’ performance and activity. Usually, they are used to diagnose problems and assess the functioning of a system.
The MongoDB database tools are a suite of command-line utilities for working with MongoDB. Starting with MongoDB 4.4, these tools are released separately from the MongoDB Server. To install them, we should follow the guidelines provided in the following documentation.
As I am using Windows operating system, the MongoDB database tools are located within the following directory: “<Installation Drive>: Program Files\MongoDB\Tools\<MongoDB Database Tools version>\bin”. In this tutorial, we are only interested in mongostat and mongotop.
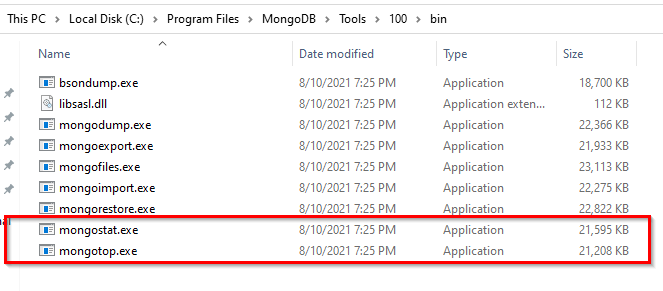
Figure 1 – MongoDB database tools directory
Mongostat
The mongostat utility provides an overview of a mongod (MongoDB daemon service) or mongos (MongoDB Sharded cluster routing service) instance currently running.
Once the mongostat utility is started from a command line, it generates the statistics regarding the CRUD operations counts, the number of connections, the cache memory usage, and other metrics. Those statistics are printed on the command line output each second.
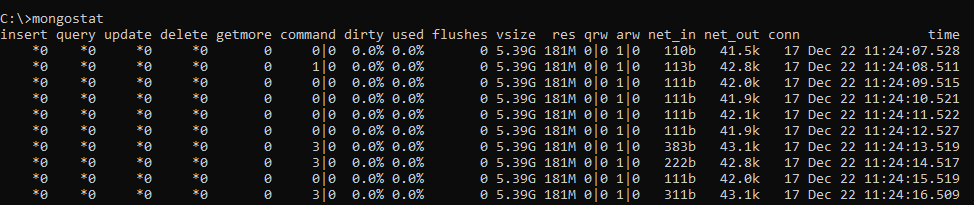
Figure 2 – mongostat output
If you need to change the time interval, you can pass the number of seconds as an argument, as shown in the screenshot below.

Figure 3 – change the time interval of the mongostat tool
Suppose you need to redirect the mongostat output to a log file. In that case, you can use the > character to tell the console to redirect the output to the file with the name provided.
mongostat > <filepath>
More details about mongostat can be found in the official documentation.
Mongotop
The mongotop utility tracks and reports a MongoDB server’s current read and write activity. Using this tool, users can verify whether database activity and usage align with expectations. The read and write operations are shown per collection.
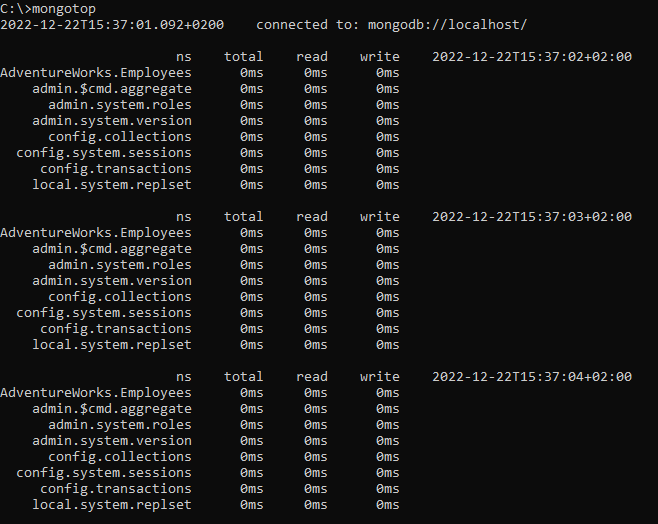
Figure 4 – mongotop output
The mongotop tool only reports active namespaces or databases. If a database or collection has no recent activity, it will not be shown. Moreover, if you need to change the time interval, you can pass the number of seconds as an argument, as shown in the screenshot below.
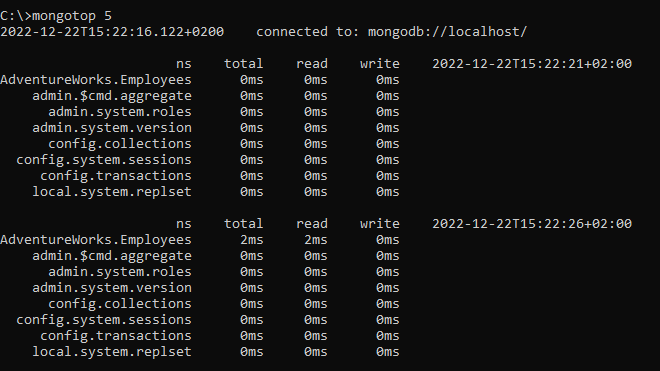
Figure 5 – change the time interval of the mongostat tool
More details about mongotop can be found in the official documentation.
Commands for monitoring MongoDB
Several commands provide necessary metrics for monitoring MongoDB clusters and databases.
When working with a replica set, the following commands can be used to retrieve information about the database cluster:
- rs.status(): It returns the replica set status. It is done from the point of view of the member where the method is run.
On the server level, the following commands are helpful for monitoring:
- db.serverStatus(): It provides you with a document representing the current instance metrics counters. Run this command at regular intervals to collect statistics about the instance.
On the database level, the following commands are useful to get metrics about the databases and collections:
- db.currentOp(): It identifies the database instance’s in-progress operations.
- db.stats(): It reflects the amount of storage used, the quantity of data contained in the database, and object, collection, and index counters.
- db.collection.stats(): It provides statistics on the collection level, including a count of the objects in the collection, the size of the collection, the amount of disk space used by the collection, and information about its indexes.
MongoDB Compass monitoring tools
MongoDB Compass is the official desktop graphical user interface for MongoDB. It allows querying, aggregating, analyzing, and monitoring MongoDB data in a visual environment.
MongoDB Compass contains a real-time server performance monitoring dashboard that visualizes the output of the mongostat, mongotop, and db.currentOp().
To access the real-time server performance monitoring dashboard, click the cluster name in the upper left corner and select the Performance tab. As shown in the screenshot below, six charts are in the performance dashboard.
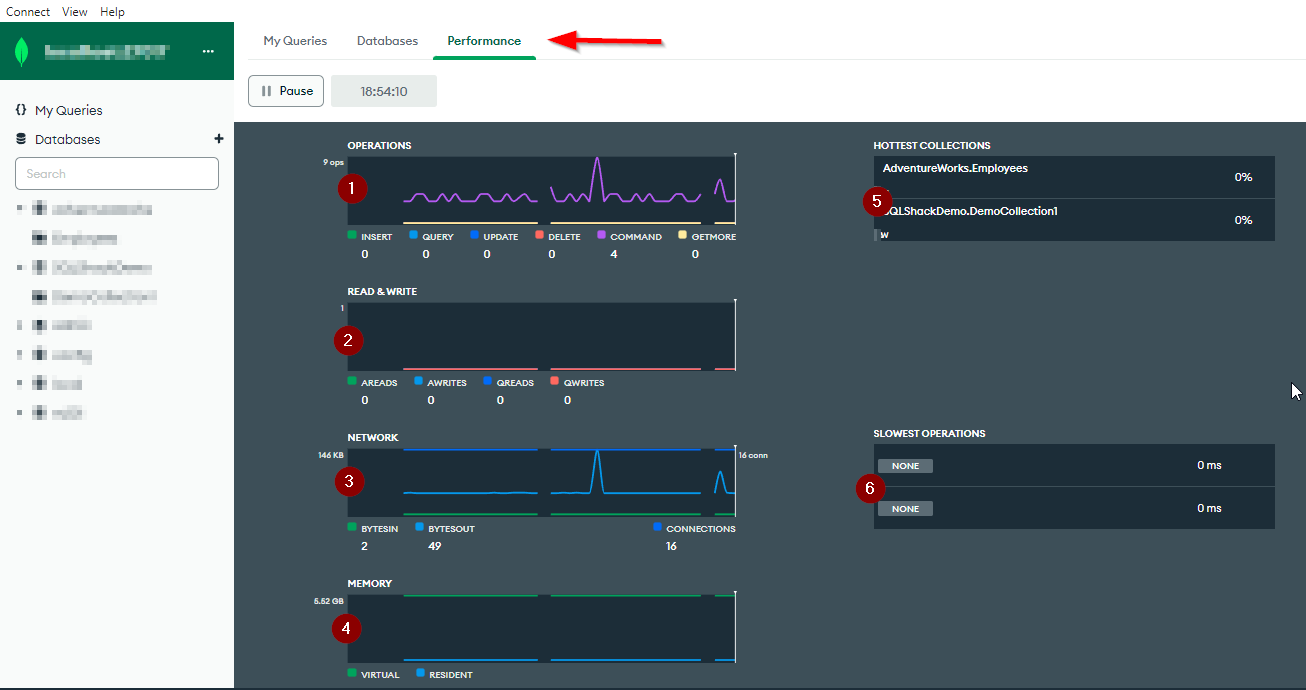
Figure 6 – MongoDB Compass performance monitoring dashboard
- Operations: Display the number of operations (Insert, Update, Delete, Aggregations …)
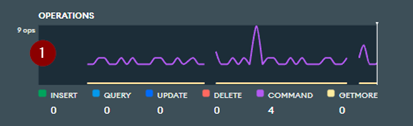
Figure 7 – Operations
- Read & Write: Displays the number of active reads, queued reads, active writes, and queued writes.
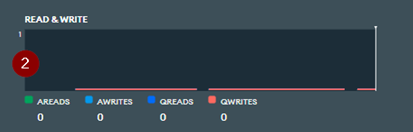
Figure 8 – Read and write
- Network: Displays the number of connections and the network traffic metrics.
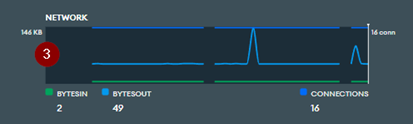
Figure 9 – Network
- Memory: Displays the memory stats.
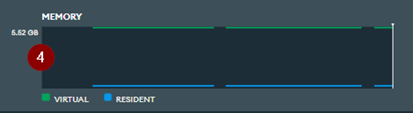
Figure 10 – Memory
- Hottest collections: Displays the collections with the most activities.
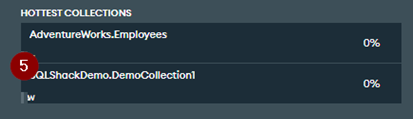
Figure 11 – Hottest collections
- Slowest operations: Displays the slowest operations.
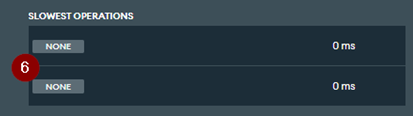
Figure 12 – Slowest operations
We can pause the real-time monitoring at any time by clicking on the pause button at the top of the dashboard.
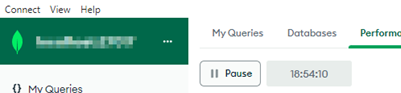
Figure 13 – The pause button
MongoDB free cloud monitoring
MongoDB offers a free Cloud monitoring service starting with version 4.0 for local standalone installation or database clusters (replica sets, shards).
We can enable/disable free monitoring from the mongo shell using db.enableFreeMonitoring() and db.disableFreeMonitoring() commands. Once we execute the db.enableFreeMonitoring() the following message is shown, including the monitoring dashboard URL.
|
1 2 3 4 5 6 7 8 9 |
{ state: 'enabled', message: 'To see your monitoring data, navigate to the unique URL below. Anyone you share the URL with will also be able to view this page. You can disable monitoring at any time by running db.disableFreeMonitoring().', url: 'https://cloud.mongodb.com/freemonitoring/cluster/<auto generated value>', userReminder: '', ok: 1 } |
The free monitoring service provides real-time graphs visualization about your MongoDB deployment, including:
- Operation Execution Times
- Disk Utilization
- Documents
- Network traffic
- Memory Usage
- Queues
- CPU Usage
- Operation Counts
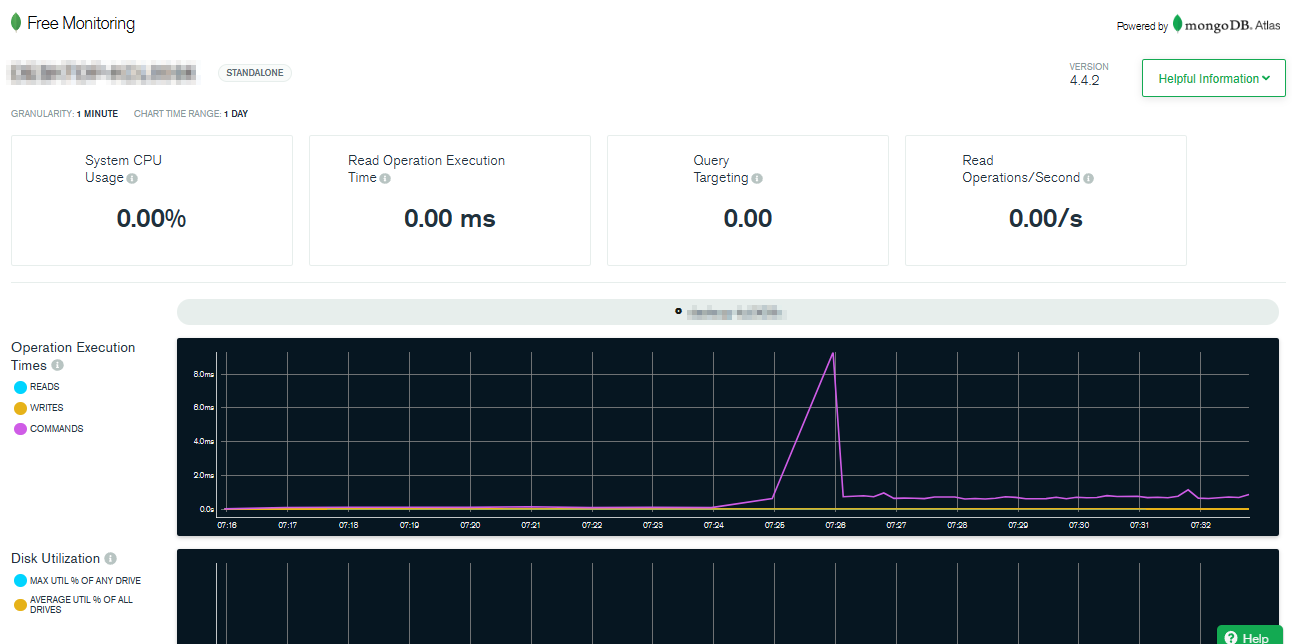
Figure 14 – Free monitoring web page
Third-party tools for monitoring MongoDB
Several tools and services were developed for monitoring MongoDB standalone installations and database clusters, such as SolarWinds Database Performance Monitor, OpsView, Datadog, and others.
Quest Foglight for MongoDB
Foglight for MongoDB is a powerful database monitoring tool for on-premises and cloud deployment. It provides consistent alerting and notification workflows, real-time and historical diagnostics and reporting, and unmatched analytics of collected data.
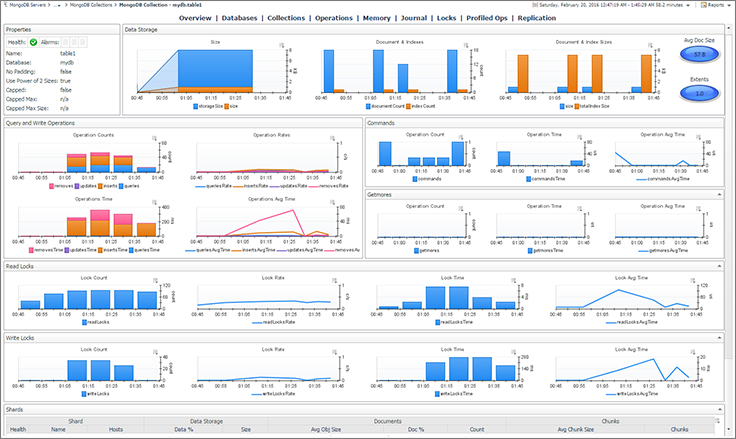
Figure 15 – Foglight for MongoDB (Reference)
Summary
In this article, we explained database monitoring and why it is essential. Then, we illustrated different free monitoring tools and services offered by MongoDB, which provides critical information on the server and databases. Then, we listed some of the third-party commercial tools.

Besides working with SQL Server, he worked with different data technologies such as NoSQL databases, Hadoop, Apache Spark. He is a MongoDB, Neo4j, and ArangoDB certified professional.
On the academic level, Hadi holds two master's degrees in computer science and business computing. Currently, he is a Ph.D. candidate in data science focusing on Big Data quality assessment techniques.
Hadi really enjoys learning new things everyday and sharing his knowledge. You can reach him on his personal website.
View all posts by Hadi Fadlallah
- An overview of SQL Server monitoring tools - December 12, 2023
- Different methods for monitoring MongoDB databases - June 14, 2023
- Learn SQL: Insert multiple rows commands - March 6, 2023