
Introduction
Context In previous article entitled “How to report on SQL Server deadlock occurrences“, we’ve seen how to extract deadlock information from either system_health or specialized Extended Event and store this information into a table in a SQL Server database. We also discussed a simple report which leads to the creation of a deadlock occurrences timeline. Now, it’s time to go deeper in the processing of this deadlock information… As we collect this information in XML format, we can query the XML contents directly in SQL Server using the XQuery feature of Transact-SQL. This means that we can do so much more than just store this XML. This would allow us the ability to generate reports based on deadlock properties like the application name, queries implied in deadlocks… These reports would be especially useful when we don’t always have the code of the application that generates these deadlocks and we must provide suitable information to the author to inform (and sometimes try to convince) them that it can be the root cause of performance problems then help him in solving these problems. This article will define a process that will collect these XML descriptors into a base table and split them into a series of columns. These columns will then be available to generate reports as we discussed just above.Deadlocks data processing using SQL Server Extended Events
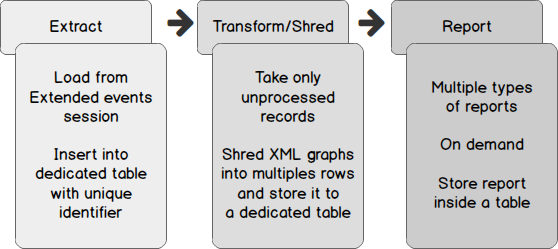
Now, let’s focus on a process for collecting and transforming XML version of deadlock graphs into something we can use for reporting, in short, something on which it’s easier to compute statistics. This process could be built in one piece of code: we could do all the job inside a single stored procedure, like we did to extract deadlock occurrence time from SQL Server Error Log in the previous article, but the complexity of such a procedure would be very high. So, we will divide the process into 3 steps as shown in following figure. Another advantage of this design is that we could change the extract method (we could use an extraction from SQL Server Error Log), remaining steps would be kept intact. Each step of this process can be run asynchronously and uses the results of its predecessor to generate its output. We could extract XML graphs every hour and transform only once a day while reporting can be performed at any time by authorized users.
The first step of this process, “Extract”, has been discussed in the previous article entitled How to report on SQL Server deadlock occurrences. Therefore, we won’t discuss a lot about it in following sub-sections and instead focus on deadlock XML processing. As soon as we designed the “Transform/Shred” operation, we will talk about how to automate both “Extract” and “Transform/Shred” steps using a single SQL Server Agent job.
Deadlock XML example and review
Now that we have extracted deadlocks from Extended Events and assigned a unique identifier to each record, we can take the product of this extraction and split up its XML contents. But, let’s first review what a deadlock XML graph looks like. Here is an example.
Each step of this process can be run asynchronously and uses the results of its predecessor to generate its output. We could extract XML graphs every hour and transform only once a day while reporting can be performed at any time by authorized users.
The first step of this process, “Extract”, has been discussed in the previous article entitled How to report on SQL Server deadlock occurrences. Therefore, we won’t discuss a lot about it in following sub-sections and instead focus on deadlock XML processing. As soon as we designed the “Transform/Shred” operation, we will talk about how to automate both “Extract” and “Transform/Shred” steps using a single SQL Server Agent job.
Deadlock XML example and review
Now that we have extracted deadlocks from Extended Events and assigned a unique identifier to each record, we can take the product of this extraction and split up its XML contents. But, let’s first review what a deadlock XML graph looks like. Here is an example.
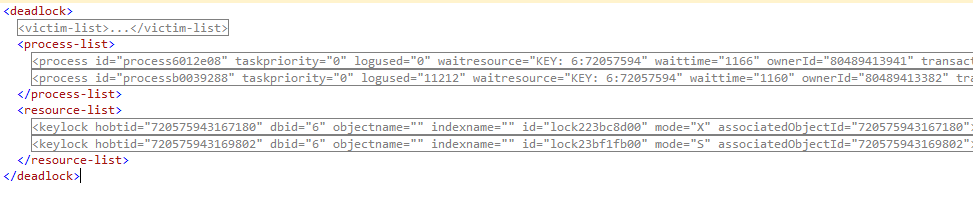 As we can notice, it’s divided into three XML sections:
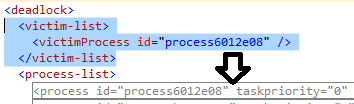
- The victim-list which actually only tells which process in next XML section has been killed by Deadlock Monitoring Thread.
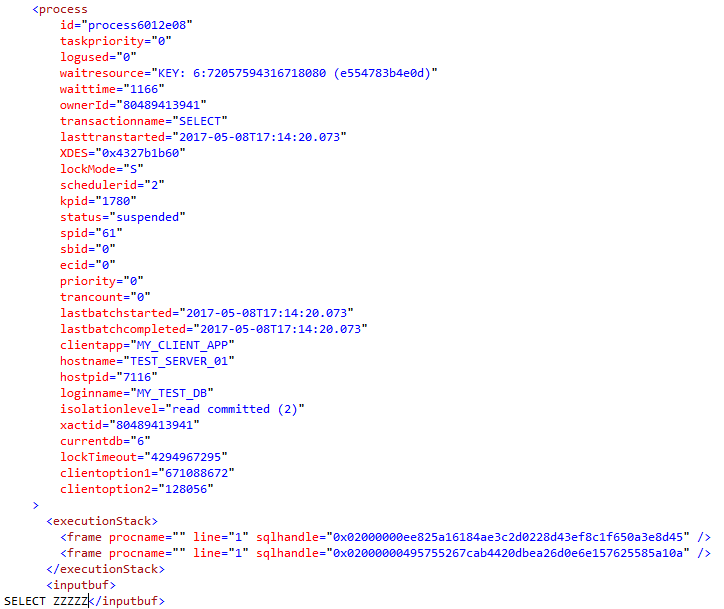
- The process-list which, as we could expect, lists the processes implied in deadlock situation. Each process sub-section has a wealth of information about it:
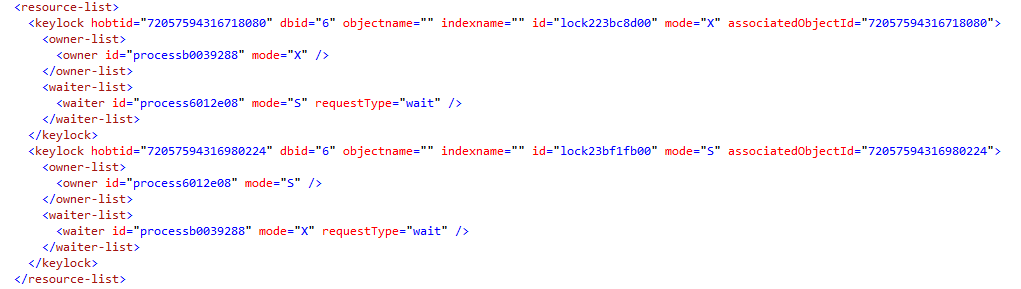
- The resource-list which lists database resources used by processes when deadlock situation occurred. Here is an example of its contents corresponding to current example.
 Designing Deadlock XML transformation process output table
So, there are plenty of properties that we could extract from the XML graph. But we need to keep only those which would be useful for reporting purposes! Let’s start to think about the design of destination table…
There are actually some facts that we need to consider. First, let’s recall that there are at least two processes implied in deadlocks. This means we will take the same kind of information for any of them. Furthermore, if we keep one row per deadlock and 10 process properties, we would get a table with at least 21 columns (deadlock identifier and twice the ten properties). Hence, this would not be easy to read and average size of a row could be very high. Instead, we will base our table by process for a single deadlock identifier.
But we could have noticed that, for a single process, there can be multiple frame elements in the executionStack element and if we want to store extended information about queries (based on the value of sql_handle property), then we should shred the XML graph to that level of details.
Here is the list of process properties that I consider important and, so, that should be kept.
Designing Deadlock XML transformation process output table
So, there are plenty of properties that we could extract from the XML graph. But we need to keep only those which would be useful for reporting purposes! Let’s start to think about the design of destination table…
There are actually some facts that we need to consider. First, let’s recall that there are at least two processes implied in deadlocks. This means we will take the same kind of information for any of them. Furthermore, if we keep one row per deadlock and 10 process properties, we would get a table with at least 21 columns (deadlock identifier and twice the ten properties). Hence, this would not be easy to read and average size of a row could be very high. Instead, we will base our table by process for a single deadlock identifier.
But we could have noticed that, for a single process, there can be multiple frame elements in the executionStack element and if we want to store extended information about queries (based on the value of sql_handle property), then we should shred the XML graph to that level of details.
Here is the list of process properties that I consider important and, so, that should be kept.
- Whether this process is the victim in deadlock description or not
- The corresponding client application and hostname
- The name of the login used to establish connection to SQL Server
- Number of transactions held by process
- Its transaction Isolation level
- Its execution stack
- When it started and completed
- Which database was in use
- Which object is locked (and which kind of lock)
- On which object process was waiting for lock (and which kind of lock)
I grouped these properties in logical buckets, not in their order of appearance inside the example deadlock graph XML descriptor. When we get values for sql_handle and as corresponding queries may disappear from plan cache because of DBCC FREEPROCCACHE usage, instance restart or whatever, we should also collect these queries during our “Transform/Shred” process. Based on these needs, we will define a table with following columns definition:
|
1 2 3 4 5 6 7 8 9 10 11 12 13 14 15 16 17 18 19 20 21 22 23 24 25 26 27 28 29 30 31 32 33 34 35 |
[DeadlockID] BIGINT NOT NULL, [isVictim] BIT NOT NULL, [ProcessQty] INT NOT NULL, [ProcessNbr] BIGINT NOT NULL, [LockMode] VARCHAR(10) NOT NULL, [LockedObject] VARCHAR(1024) NULL, [DatabaseId] INT NULL, [AssociatedObjectId] BIGINT NULL, [AssociatedObjectName] VARCHAR(1024) NULL, [LockProcess] VARCHAR(50) NOT NULL, [ThreadId] INT NOT NULL, [SPID] INT NOT NULL, [SBID] INT NOT NULL, [ECID] INT NOT NULL, [TranCount] INT NOT NULL, [LockEvent] VARCHAR(8000) NULL, [LockedMode] VARCHAR(10) NULL, [WaitProcessID] VARCHAR(200) NULL, [WaitMode] VARCHAR(10) NULL, [WaitResource] VARCHAR(200) NOT NULL, [WaitType] VARCHAR(100) NULL, [IsolationLevel] VARCHAR(200) NOT NULL, [LogUsed] BIGINT NOT NULL, [ClientApp] VARCHAR(512) NULL, [HostName] VARCHAR(512) NOT NULL, [LoginName] VARCHAR(256) NOT NULL, [TransactionTime] DATETIME NOT NULL, [BatchStarted] DATETIME NOT NULL, [BatchCompleted] DATETIME NOT NULL, [QueryStatement] VARCHAR(max) NULL, [SQLHandle] VARCHAR(64) NULL, [SQLHandleText] VARCHAR(max) NULL, [InputBuffer] XML NULL, [ExecutionStack] XML NULL |
|
1 2 3 4 5 6 7 8 9 10 11 12 |
ALTER PROCEDURE [Reporting].[ShredDeadlockHistoryTbl] ( @SourceDatabaseName VARCHAR(256) = NULL, @SourceSchemaName VARCHAR(256) = NULL, @SourceTableName VARCHAR(256), @DeadlockIdentifierColumnName VARCHAR(256) = 'DeadlockId', @DeadlockGraphColumnName VARCHAR(256) = 'DeadlockGraph', @TargetDatabaseName VARCHAR(256) = NULL, @TargetSchemaName VARCHAR(256) = NULL, @TargetTableName VARCHAR(256), @Debug BIT = 0 ) |
|
1 2 3 4 5 6 7 8 9 10 11 |
"Check source and destination table existence" "Create temporary destination table" "Get the list of new deadlocks into temporary table" FOREACH new deadlock in temporary table DO "Shred Deadlock XML graph and insert into temporary destination table" "update temporary destination table with related object names" "update temporary destination table with T-SQL text corresponding to each sql_handle value" DONE "Store temporary destination table contents to actual destination table" |
A part of this step, that we can’t neglect, makes use of set-based programming approached that is discussed in another series on SQLShack. In following, we will assume you know these principles.
- An introduction to set-based vs procedural programming approaches in T-SQL
- From mathematics to SQL Server, a fast introduction to set theory
- T-SQL as an asset to set-based programming approach
|
1 2 3 4 5 6 7 8 9 |
WITH <cte_title1> AS …, <cte_title2> AS …, <cte_title3> AS …, … ) INSERT INTO … SELECT … </cte_title3></cte_title2></cte_title1> |
|
1 2 3 4 5 6 7 8 |
'WITH DeadlockDataSource AS (' + @LineFeed + ' SELECT ' + @LineFeed + ' ' + @DeadlockIdentifierColumnName + ' AS DeadlockId,' + @LineFeed+ ' ' + @DeadlockGraphColumnName + ' AS DeadlockGraph' + @LineFeed + ' FROM ' + @SourceTableFullName + @LineFeed + ' WHERE ' + @DeadlockIdentifierColumnName + ' = @DeadlockId' + @LineFeed + '), ' |
|
1 2 3 4 5 6 7 8 |
'VictimIds ' + @LineFeed + 'AS (' + @LineFeed + ' SELECT VictimsInfos.VictimsLst.value(''@id'', ''VARCHAR(64)'') as ID' + @LineFeed + ' FROM DeadlockDataSource' + @LineFeed + ' CROSS APPLY ' + @LineFeed + ' DeadlockDataSource.DeadlockGraph.nodes(''//deadlock/victim-list/victimProcess'') AS VictimsInfos (VictimsLst)' + @LineFeed + '), ' |
|
1 2 3 4 5 6 7 8 9 10 11 12 13 14 15 16 17 18 19 20 21 22 23 24 25 26 |
'Locks AS (' + @LineFeed + ' -- Merge all of the lock information together.' + @LineFeed + ' SELECT ' + @LineFeed + ' DeadlockDataSource.DeadlockID,' + @LineFeed + ' MainLockInfo.ProcessInfo.value(''@id'', ''varchar(100)'') AS LockID,' + @LineFeed + ' OwnerList.OwnerInfo.value(''@id'', ''varchar(200)'') AS LockProcessId,' + @LineFeed + ' REPLACE(MainLockInfo.ProcessInfo.value(''local-name(.)'', ''varchar(128)''), ''lock'', '''') AS LockEvent,' + @LineFeed + ' MainLockInfo.ProcessInfo.value(''@objectname'', ''sysname'') AS ObjectName,' + @LineFeed + ' OwnerList.OwnerInfo.value(''@mode'', ''varchar(10)'') AS LockMode,' + @LineFeed + ' MainLockInfo.ProcessInfo.value(''@dbid'', ''INTEGER'') AS DatabaseId,' + @LineFeed + ' MainLockInfo.ProcessInfo.value(''@associatedObjectId'', ''BIGINT'') AS AssociatedObjectId,' + @LineFeed + ' MainLockInfo.ProcessInfo.value(''@WaitType'', ''varchar(100)'') AS WaitType,' + @LineFeed + ' WaitersList.OwnerInfo.value(''@id'', ''varchar(200)'') AS WaitProcessID,' + @LineFeed + ' WaitersList.OwnerInfo.value(''@mode'', ''varchar(10)'') AS WaitMode' + @LineFeed + ' FROM ' + @LineFeed + ' DeadlockDataSource' + @LineFeed + ' CROSS APPLY ' + @LineFeed + ' DeadlockDataSource.DeadlockGraph.nodes(''//deadlock/resource-list'') AS Lock (list)' + @LineFeed + ' CROSS APPLY ' + @LineFeed + ' Lock.list.nodes(''*'') AS MainLockInfo (ProcessInfo)' + @LineFeed + ' OUTER APPLY ' + @LineFeed + ' MainLockInfo.ProcessInfo.nodes(''owner-list/owner'') AS OwnerList (OwnerInfo)' + @LineFeed + ' CROSS APPLY ' + @LineFeed + ' MainLockInfo.ProcessInfo.nodes(''waiter-list/waiter'') AS WaitersList (OwnerInfo)' + @LineFeed + '), ' |
- when did it run,
- when did it complete,
- what client application was used
- and so on
|
1 2 3 4 5 6 7 8 9 10 11 12 13 14 15 16 17 18 19 20 21 22 23 24 25 26 27 28 29 30 31 32 33 34 35 36 37 38 39 40 41 42 43 44 45 46 47 48 49 50 51 52 |
'Processes AS (' + @LineFeed + ' -- get data from the process node' + @LineFeed + ' SELECT DeadlockDataSource.DeadlockID,' + @LineFeed + ' [isVictim] = CONVERT(BIT, CASE WHEN DeadlockInfo.ProcessInfo.value(''@id'', ''VARCHAR(64)'') = ISNULL(DeadlockInfo.ProcessInfo.value(''../../@victim'', ''varchar(50)''), v.ID) ' + @LineFeed + ' THEN 1' + @LineFeed + ' ELSE 0' + @LineFeed + ' END),' + @LineFeed + ' [LockMode] = DeadlockInfo.ProcessInfo.value(''@lockMode'', ''varchar(10)''), ' + @LineFeed + ' [ProcessID] = ProcessInfo.ID,' + @LineFeed + ' [ThreadId] = DeadlockInfo.ProcessInfo.value(''@kpid'', ''int''), ' + @LineFeed + ' [SPID] = DeadlockInfo.ProcessInfo.value(''@spid'', ''int''),' + @LineFeed + ' [SBID] = DeadlockInfo.ProcessInfo.value(''@sbid'', ''int''), ' + @LineFeed + ' [ECID] = DeadlockInfo.ProcessInfo.value(''@ecid'', ''int''), ' + @LineFeed + ' [IsolationLevel] = DeadlockInfo.ProcessInfo.value(''@isolationlevel'', ''varchar(200)''),' + @LineFeed + ' [WaitResource] = DeadlockInfo.ProcessInfo.value(''@waitresource'', ''varchar(200)''),' + @LineFeed + ' [LogUsed] = DeadlockInfo.ProcessInfo.value(''@logused'', ''int''),' + @LineFeed + ' [ClientApp] = DeadlockInfo.ProcessInfo.value(''@clientapp'', ''varchar(100)''),' + @LineFeed + ' [HostName] = DeadlockInfo.ProcessInfo.value(''@hostname'', ''varchar(20)''),' + @LineFeed + ' [LoginName] = DeadlockInfo.ProcessInfo.value(''@loginname'', ''varchar(20)''),' + @LineFeed + ' [TransactionTime] = DeadlockInfo.ProcessInfo.value(''@lasttranstarted'', ''datetime''),' + @LineFeed + ' [BatchStarted] = DeadlockInfo.ProcessInfo.value(''@lastbatchstarted'', ''datetime''),' + @LineFeed + ' [BatchCompleted] = DeadlockInfo.ProcessInfo.value(''@lastbatchcompleted'', ''datetime''),' + @LineFeed + ' [InputBuffer] = CAST(Input.Buffer.query(''.'') AS xml),' + @LineFeed + ' es.ExecutionStack,' + @LineFeed + ' [SQLHandle] = ExecStack.Stack.value(''@sqlhandle'', ''varchar(64)''),' + @LineFeed + ' [QueryStatement] = NULLIF(ExecStack.Stack.value(''.'', ''varchar(max)''), ''''),' + @LineFeed + ' [ProcessQty] = SUM(1) OVER (PARTITION BY DeadlockDataSource.DeadlockID),' + @LineFeed + ' [TranCount] = DeadlockInfo.ProcessInfo.value(''@trancount'', ''int'')' + @LineFeed + ' FROM DeadlockDataSource' + @LineFeed + ' CROSS APPLY DeadlockDataSource.DeadlockGraph.nodes(''//deadlock/process-list/process'') AS DeadlockInfo (ProcessInfo)' + @LineFeed + ' CROSS APPLY (SELECT DeadlockInfo.ProcessInfo.value(''@id'', ''VARCHAR(64)'') ) AS ProcessInfo (ID)' + @LineFeed + ' LEFT JOIN VictimIds v ON ProcessInfo.ID = v.ID' + @LineFeed + ' CROSS APPLY DeadlockInfo.ProcessInfo.nodes(''inputbuf'') AS Input (Buffer)' + @LineFeed + ' CROSS APPLY DeadlockInfo.ProcessInfo.nodes(''executionStack'') AS Execution (Frame)' + @LineFeed + ' -- get the data from the executionStack node as XML' + @LineFeed + ' CROSS APPLY (SELECT ExecutionStack = (SELECT ProcNumber = ROW_NUMBER() ' + @LineFeed + ' OVER (PARTITION BY DeadlockDataSource.DeadlockID,' + @LineFeed + ' DeadlockInfo.ProcessInfo.value(''@id'', ''VARCHAR(64)''),' + @LineFeed + ' Execution.Stack.value(''@procname'', ''sysname''),' + @LineFeed + ' Execution.Stack.value(''@code'', ''varchar(MAX)'') ' + @LineFeed + ' ORDER BY (SELECT 1)),' + @LineFeed + ' ProcName = Execution.Stack.value(''@procname'', ''sysname''),' + @LineFeed + ' Line = Execution.Stack.value(''@line'', ''int''),' + @LineFeed + ' SQLHandle = Execution.Stack.value(''@sqlhandle'', ''varchar(64)''),' + @LineFeed + ' Code = LTRIM(RTRIM(Execution.Stack.value(''.'', ''varchar(MAX)'')))' + @LineFeed + ' FROM Execution.Frame.nodes(''frame'') AS Execution (Stack)' + @LineFeed + ' ORDER BY ProcNumber' + @LineFeed + ' FOR XML PATH(''frame''), ROOT(''executionStack''), TYPE )' + @LineFeed + ' ) es' + @LineFeed + ' CROSS APPLY Execution.Frame.nodes(''frame'') AS ExecStack (Stack)' + @LineFeed + ')' |
|
1 2 3 |
SELECT DENSE_RANK ( ) OVER ( [ <partition_by_clause> ] < order_by_clause > ) </partition_by_clause> |
|
1 2 3 4 5 |
ProcessNbr = DENSE_RANK() OVER ( PARTITION BY p.DeadlockId ORDER BY p.ProcessID ) |
Example reports
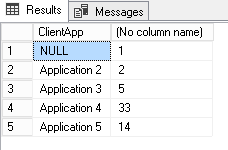
I created an example table called dbo.ShreddedDL_Example. I will use data from that table to show you potential reports that we could generate so that we can pinpoint and prioritize actions to remove deadlocks. These reports could help developers in deciding where efforts should be made at first. Top Applications Let’s say your databases are used with multiple executables and these sets the ApplicationName property of its database connection descriptor. We will be able to tell which of them are most implied in deadlocks using following query:|
1 2 3 4 5 6 |
select TOP 5 ClientApp, COUNT_BIG(*) From dbo.ShreddedDL_Example --where isVictim = 0 group by ClientApp |
 Top Databases
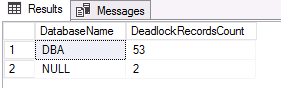
If we have multiple databases on same server, we could look at which databases were implied in deadlocks using following query:
Top Databases
If we have multiple databases on same server, we could look at which databases were implied in deadlocks using following query:
|
1 2 3 4 5 6 7 8 |
select TOP 5 DB_NAME(DatabaseId) as DatabaseName, COUNT_BIG(*) as DeadlockRecordsCount From dbo.ShreddedDL_Example group by DatabaseId order by 2 desc ; |
 Top Objects
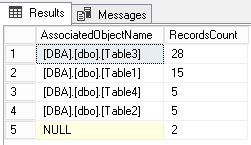
We could also pinpoint which objects are most implied in deadlocks. This will pinpoint objects we might be willing to tune (indexing, redesign, access review inside code…)
Here is a sample query that can be used for that followed by its results against the dbo.ShreddedDL_Example table:
Top Objects
We could also pinpoint which objects are most implied in deadlocks. This will pinpoint objects we might be willing to tune (indexing, redesign, access review inside code…)
Here is a sample query that can be used for that followed by its results against the dbo.ShreddedDL_Example table:
|
1 2 3 4 5 6 7 |
select TOP 5 AssociatedObjectName, COUNT_BIG(*) as RecordsCount From dbo.ShreddedDL_Example group by AssociatedObjectName order by 2 desc |
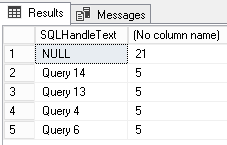
 Top Queries
Finally, it’s possible to get back just most implied queries using following statement:
Top Queries
Finally, it’s possible to get back just most implied queries using following statement:
|
1 2 3 4 5 6 7 |
select TOP 5 SQLHandleText, COUNT_BIG(*) as RecordsCount From dbo.ShreddedDL_Example group by SQLHandleText order by 2 desc |
For security matters, I updated the content of dbo.ShreddedDL_Example table so that queries do not match the actual query used on server.
 Going further
Until now, we just used one single column to get statistics but we could also combine columns. For instance, we could add the ClientApp column to tell that most deadlocks occurred with this application accessing that object. This is performed with following query:
Going further
Until now, we just used one single column to get statistics but we could also combine columns. For instance, we could add the ClientApp column to tell that most deadlocks occurred with this application accessing that object. This is performed with following query:
|
1 2 3 4 5 6 |
select TOP 5 AssociatedObjectName, ClientApp, COUNT_BIG(*) as RecordsCount From dbo.ShreddedDL_Example group by AssociatedObjectName,ClientApp order by 3 desc |
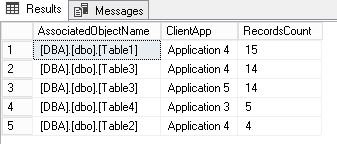 There we can see that most of deadlocks where Application4 is implied (there were 33 in previous example) occur when this application accesses Table1 and Table3.
Notice that we could also filter results with a WHERE clause.
Please don’t hesitate to comment out this article to share report elements you find most useful
There we can see that most of deadlocks where Application4 is implied (there were 33 in previous example) occur when this application accesses Table1 and Table3.
Notice that we could also filter results with a WHERE clause.
Please don’t hesitate to comment out this article to share report elements you find most useful
Conclusion
Until now, in this series, we’ve defined a process that:- Collects deadlock information in an XML format from an SQL Server Extended Events and stores this XML into a table
- Takes the resulting table and split each XML line of this table into a set of records based on process identifier and sql_handle values.
- What are SQL Server deadlocks and how to monitor them
- How to report on SQL Server deadlock occurrences
- How to automate SQL Server deadlock collection process using Extended Events and SQL Server Agent
Downloads

I'm one of the rare guys out there who started to work as a DBA immediately after his graduation. So, I work at the university hospital of Liege since 2011. Initially involved in Oracle Database administration (which are still under my charge), I had the opportunity to learn and manage SQL Server instances in 2013. Since 2013, I've learned a lot about SQL Server in administration and development.
I like the job of DBA because you need to have a general knowledge in every field of IT. That's the reason why I won't stop learning (and share) the products of my learnings.
View all posts by Jefferson Elias
- How to perform a performance test against a SQL Server instance - September 14, 2018
- Concurrency problems – theory and experimentation in SQL Server - July 24, 2018
- How to link two SQL Server instances with Kerberos - July 5, 2018