

Introduction
In the previous article entitled “What are SQL Server deadlocks and how to monitor them“, we’ve seen how a deadlock can occur and which tools are available to DBA or developer to get simple or extended information about the conditions that lead a particular deadlock situation to occur.
Now, we will need to use collected data in order to build a graph with deadlock occurrences over time. After a little word about a check that should be done before investing time into deadlock data collection, this article will present two different approaches to plot a diagram with deadlock occurrences over time. The first one will use SQL Server Error Logs while the second one will take advantage of SQL Server Extended Events.
The initial check
In my opinion, logging and reporting must be used wisely. So, I prefer to take gradual information about deadlocks. With that in mind, it’s a good idea to get an overview on how often they happen. That’s the subject of this section.
We could run following query to get how many deadlocks happened since startup, when startup occurred and how many deadlocks per day (on average). In order to get startup date, we will use the creation date value of [tempdb] database as this database is recreated at startup of SQL Server. This query can be customized to keep the value of ‘Number of Deadlocks/sec’ performance counter over time.
|
1 2 3 4 5 6 7 8 9 10 11 12 13 14 15 |
SELECT 'Deadlocks Occurrences Report', CONVERT(BIGINT,((1.0 * p.cntr_value / NULLIF(datediff(DD,d.create_date,CURRENT_TIMESTAMP),0)))) as AveragePerDay, CAST(p.cntr_value AS NVARCHAR(100)) + ' deadlocks have been recorded since startup.' AS Details, d.create_date as StartupDateTime FROM sys.dm_os_performance_counters p INNER JOIN sys.databases d ON d.name = 'tempdb' WHERE RTRIM(p.counter_name) = 'Number of Deadlocks/sec' AND RTRIM(p.instance_name) = '_Total' ; |
Here is a sample output for former query:

I would not recommend investing time on solving deadlock problems when we don’t have at least 10 deadlocks happening a day. But I would also recommend checking the value of StartupDateTime column value because if this value is over a year, then the value of the AveragePerDay column could be very skewed and further investigations should be done. Alternately, if it’s possible, you could restart SQL Server.
Deadlock occurrences diagrams from a SQL Server Error Log
If we find deadlocks happening daily, we might want to see when they happen with more accuracy. Actually, we could extract this information from the SQL Server Error Log.
In the previous article, we’ve seen that there is a thread called “Deadlock monitor” which generates a 1205 error. We also saw that following statement will tell SQL Server to write an entry in its Error Log every time a 1205 error is raised:
|
1 2 3 |
EXEC sp_altermessage 1205, 'WITH_LOG', 'true' |
We can count on a stored procedure called xp_readerrorlog to read from Error log and get back any record related to 1205 error.
You will find attached to this article a stored procedure called Reporting.DeadlockTimeLine that will take care of extracting these occurrences from the SQL Server Error Log.
Let’s look at the way this procedure is designed. First of all, let’s review its parameters.
|
1 2 3 4 5 6 7 8 9 10 11 12 13 14 15 16 17 18 19 20 21 |
ALTER PROCEDURE [Reporting].[DeadlockTimeLine]( @OnlyCurrentLog BIT = 0, @ErrorLogID INT = NULL, @StartDatePivot DATETIME = NULL, @EndDatePivot DATETIME = NULL, @TargetDatabaseName4OccurrencesReport SYSNAME = NULL, @TargetSchemaName4OccurrencesReport SYSNAME = NULL, @TargetTableName4OccurrencesReport SYSNAME = NULL, @AppendMode4OccurrencesReport BIT = 0, @TargetDatabaseName4HourlyReport SYSNAME = NULL, @TargetSchemaName4HourlyReport SYSNAME = NULL, @TargetTableName4HourlyReport SYSNAME = NULL, @AppendMode4HourlyReport BIT = 0, @TargetDatabaseName4DailyReport SYSNAME = NULL, @TargetSchemaName4DailyReport SYSNAME = NULL, @TargetTableName4DailyReport SYSNAME = NULL, @AppendMode4DailyReport BIT = 0, @Debug BIT = 1 ) |
Its first two parameters are related to error log management. We can tell the stored procedure to extract only from current log or for a given error log file. Actually, the number of error log is configurable. We can also force SQL Server to create a new one using sp_cycle_errorlog stored procedure.
After that, we have two parameters to define a time interval. Even though DateTime data type has limitations, this data type has been kept for compatibility with older systems. There are four possibilities for these parameters:
| @StartDatePivot | @EndDatePivot | Resulting Interval |
| NULL | NULL | Take every occurrences as no interval is provided |
| NULL | With Value | All occurrences until EndDate |
| WithValue | NULL | All occurrences since StartDate |
| WithValue | With Value | All occurrences between StartDate and EndDate |
Then, there are a few sets of parameters that will tell the stored procedure to store computed results to tables. We must provide a target database name, schema name and table name for one or more of following situations:
- Occurrences by seconds, simply referred to as « Occurrences »
- Occurrences by hours, referred to as « Hourly »
- Occurrences by days, referred to as « Daily »
To do so, we must provide @Target[Database|Schema|Table]Name4[SituationName]Report parameters where SituationName can be either Occurrences, Daily or Monthly. If Database name or Schema name is omitted, it will set it to the value returned by respectively DB_NAME() and SCHEMA_NAME() built-in functions.
In addition, there are @AppendMode[SituationName]Report flags to tell the stored procedure whether to truncate target table before inserting records into it or not.
Finally, there is a @Debug flag to tell stored procedure whether to become talkative or not during its execution.
Its execution summary is pretty straight forward:
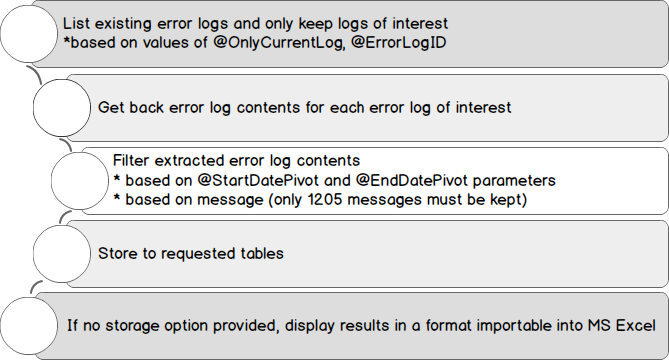
To get the list of available SQL Server Error Logs, this procedure calls xp_enumerrorlogs stored procedure and stores its results in a temporary table. A similar processing is performed to read entries in each error log using xp_readerrorlog stored procedure. These are the noticeable aspects of this stored procedure. The code, itself, is pretty trivial.
The stored procedure source code contains some example usages. Here is one that I generally use to get a report on deadlock occurrences by hours in a timed interval. This helped me to explain to a supplier that performance issues were (obviously) linked to user activity and that there were a lot of deadlocks in an hour.
|
1 2 3 4 5 6 7 8 9 10 11 12 |
EXEC [DBA].[Reporting].[DeadlockTimeLine] @TargetDatabaseName4HourlyReport = 'DBA', @TargetSchemaName4HourlyReport = 'dbo', @TargetTableName4HourlyReport = 'DeadlockHourlyReport', @TargetDatabaseName4DailyReport = 'DBA', @TargetSchemaName4DailyReport = 'dbo', @TargetTableName4DailyReport = 'DeadlockDailyReport', @StartDatePivot = '2017-02-10 00:00:00.000', @EndDatePivot = '2017-03-20 12:00:00.000' ; |
Note
We could automate table population with a SQL Server Agent Job or equivalent with @AppendMode* variables set to 1 and dynamic determination of @StartDatePivot and @EndDatePivot values.
Whether we stored results in tables or we get a result set, we can’t use these data directly to generate a histogram. As you will see below, there are holes in date and times.
To fill these holes, we will take advantage of with some « tally » tables. To do so, we will use:
-
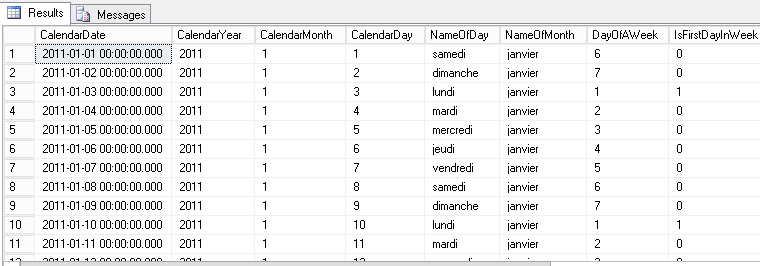
A calendar table called Common.TallyCalendar that is similar to the one created by Ed Pollack in his article series about calendar table.
Here is a sample content of that table:

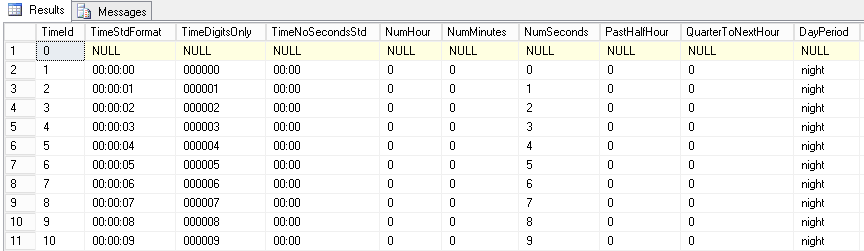
- A timing dimension table called Common.TimeDimension that contains a row for every single second in 24 hours. You could refer to my article « T-SQL as an asset to set-based programming approach » to learn how to build such a table (part 5.1 « Generate all seconds in a day »).
Here is a sample of its content:
We will use common tabular expression in conjunction with these tables to get a suitable reporting data and be able to generate a pretty report that we can share.
We will actually only get from the first table records that sit into our time interval, join them to the subset of the second table as we want to report by hour. This will generate all the lines for X axis and we can finally join with hour report table.
And this gives us this kind of query:
|
1 2 3 4 5 6 7 8 9 10 11 12 13 14 15 16 17 18 19 20 21 22 23 24 25 26 27 28 29 30 31 32 33 34 35 36 37 38 39 40 41 42 43 44 45 46 47 48 49 |
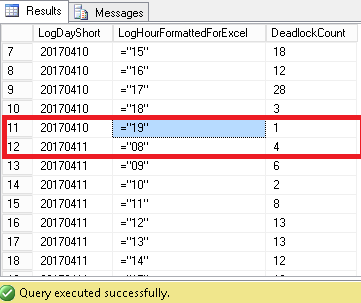
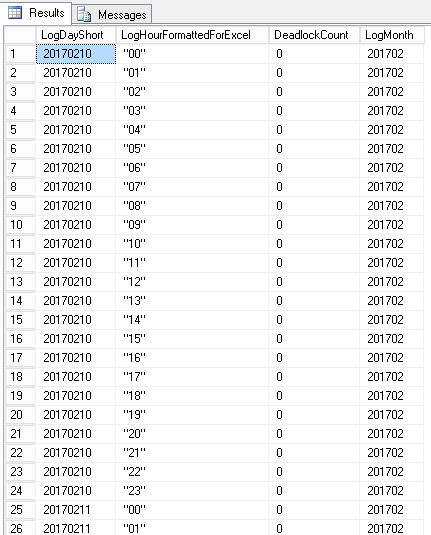
DECLARE @StartDatePivot DATETIME = '2017-02-10' ; DECLARE @EndDatePivot DATETIME = '2017-03-20' ; with Dates AS ( select CalendarDate,CONVERT(CHAR(4),CalendarYear) + RIGHT('0000' + CONVERT(VARCHAR(2),CalendarMonth),2) + RIGHT('0000' + CONVERT(VARCHAR(2),CalendarDay),2) as YearMonthDay From DBA.Common.TallyCalendar where CalendarDate BETWEEN @StartDatePivot AND @EndDatePivot ), Hourly AS ( SELECT TimeStdFormat, RIGHT('0000' + CONVERT( VARCHAR(2), SUBSTRING(TimeDigitsOnly,1,2) ), 2 ) as HourDigits FROM Common.TimeDimension where TimeStdFormat IS NOT NULL AND NumMinutes = 0 AND NumSeconds = 0 ), DateTimes AS ( select YearMonthDay + HourDigits as DateHourStr, YearMonthDay, HourDigits FROM Dates , Hourly ) select --DateHourStr as LogDateWithHour, YearMonthDay as LogDayShort, '"' + HourDigits + '"' as LogHourFormattedForExcel, ISNULL(DeadlockCount,0) as DeadlockCount, SUBSTRING(YearMonthDay,1,6) as LogMonth from DateTimes dt left join DBA.dbo.DeadlockHourlyReport r on dt.DateHourStr = r.LogDateWithHour order by DateHourStr,HourDigits ; |
Here are sample results:
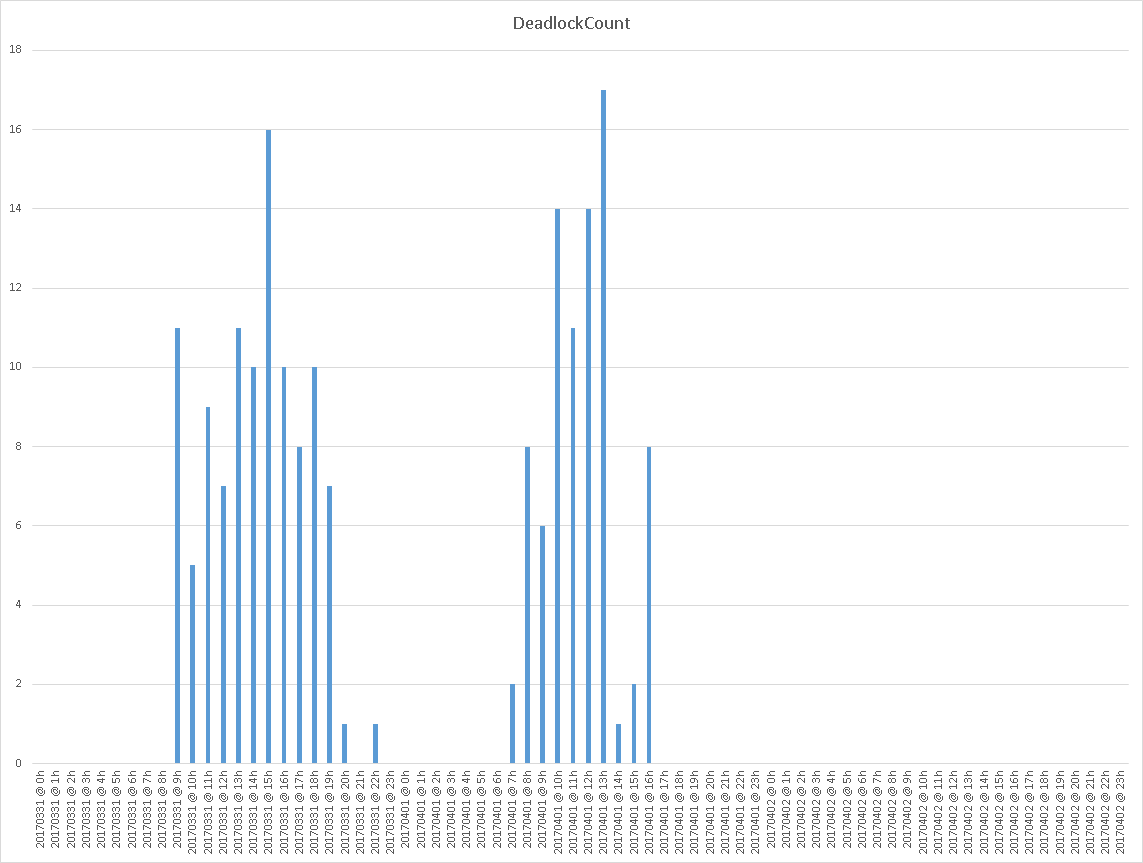
And here is an example graphical representation of these data on a system with deadlocks happening hourly.
As a final word about this method, we should pinpoint that this method is a little tricky as it uses undocumented stored procedures and as it performs mining on the SQL Server Error Log.
While this can be useful in an incremental information collection approach (so as when SQL Server version is below 2008), we could (and should) take advantage of SQL Server Extended Events.
Deadlock occurrences diagrams from SQL Server Extended Events
We could do the same way as we did to generate deadlock occurrence timelines from SQL Server Error Log inside a single procedure that would extract, transform and store results in tables.
But, as we get an XML description out of the box, we can plan to implement advanced reporting and we would use the exact same code in the body of multiple stored procedures. Instead, we will create a stored procedure that will extract deadlock information from Extended Events into a table. The results of this procedure (records in the output table) will be used as input for further processing like generating a deadlock timeline report, which is the actual purpose of this section.
Extracting deadlock information from Extended Events
In the previous article, we’ve seen that we can either use system_health default Extended Events Session or create a new one specialized for keeping track of XML deadlock graphs. But there is a point that wasn’t mentioned.
Still in this article, we saw that we can get back system_health data using the following query:
|
1 2 3 4 5 6 7 8 9 10 11 12 13 14 15 16 17 18 19 20 21 22 23 24 25 26 27 28 29 30 31 32 33 34 35 36 37 38 39 40 41 42 43 44 45 46 47 48 49 50 51 52 53 54 55 56 57 58 59 60 |
DECLARE @LineFeedStr CHAR(2); DECLARE @versionNb int; DECLARE @EventSessionName VARCHAR(256); DECLARE @tsql NVARCHAR(MAX); DECLARE @DeadlockXMLLookup VARCHAR(4000); SELECT @versionNb = (@@microsoftversion / 0x1000000) & 0xff, @LineFeedStr = CHAR(13) + CHAR(10), @EventSessionName = ISNULL(@EventSessionName,'system_health') ; IF (@versionNb = 10) BEGIN SET @DeadlockXMLLookup = 'XEventData.XEvent.value(''(data/value)[1]'',''VARCHAR(MAX)'')'; END; ELSE IF(@versionNb <= 9) BEGIN RAISERROR('Extended events feature does not exist in this version',12,1) WITH NOWAIT; RETURN; END; ELSE BEGIN SET @DeadlockXMLLookup = 'XEventData.XEvent.query(''(data/value/deadlock)[1]'')'; END; SET @tsql = 'WITH DeadlockData' + @LineFeedStr + 'AS (' + @LineFeedStr + ' SELECT' + @LineFeedStr + ' CAST(target_data as xml) AS XMLData' + @LineFeedStr + ' FROM' + @LineFeedStr + ' sys.dm_xe_session_targets st' + @LineFeedStr + ' JOIN' + @LineFeedStr + ' sys.dm_xe_sessions s ' + @LineFeedStr + ' ON s.address = st.event_session_address' + @LineFeedStr + ' WHERE name = ''' + 'system_health' + '''' + @LineFeedStr + ' AND st.target_name = ''ring_buffer'' ' + @LineFeedStr + ')' + @LineFeedStr + 'SELECT ' + @LineFeedStr + ' XEventData.XEvent.value(''@name'', ''varchar(128)'') as eventName,' + @LineFeedStr + ' XEventData.XEvent.value(''@timestamp'', ''datetime2'') as eventDate,' + @LineFeedStr + ' CAST(' + @DeadlockXMLLookup + ' AS XML) AS DeadLockGraph ' + @LineFeedStr + 'FROM ' + @LineFeedStr + ' DeadlockData' + @LineFeedStr + 'CROSS APPLY' + @LineFeedStr + ' XMLData.nodes(''//RingBufferTarget/event'') AS XEventData (XEvent)' + @LineFeedStr + 'WHERE' + @LineFeedStr + ' XEventData.XEvent.value(''@name'',''varchar(4000)'') = ''xml_deadlock_report''' + @LineFeedStr + ';' ; EXEC sp_executesql @tsql; |
This query will actually work for any Extended Event Session that has a ring_buffer target type. This is not the case for the [Collect-Deadlocks] event session discussed in that article because its target type is an asynchronous file. We can easily understand it once we run following query and we check for differences between returned data for target_data column.
|
1 2 3 |
SELECT * FROM sys.dm_xe_session_targets |
Here is a sample output:

First, we can notice that there is not RingBufferTarget node at the beginning of target_data column, so the CROSS APPLY operation won’t work. But it’s not the only difference! Let’s take a look at the full content of each value…
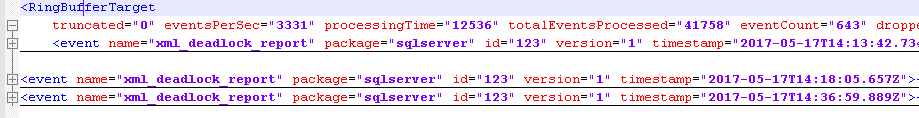
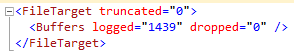
We see that in the case of RingBufferTarget node, there are instances of event sub-nodes named xml_deadlock_report while the FileTarget node doesn’t.
In conclusion, we need to build another query to be able to get back results. Actually, we need to tell SQL Server to read from files. This is performed by sys.fn_xe_file_target_read_file built-in function. But this function needs at least to provide 2 parameters: the path to the file(s) we want to read and the metadata descriptor for the file(s) it has to read. We must compute these values before execution. As this article is not about SQL Server Extended Events, I will just present the resulting query.
|
1 2 3 4 5 6 7 8 9 10 11 12 13 14 15 16 17 18 19 20 21 22 23 24 25 26 27 28 29 30 31 32 33 34 35 36 37 38 39 40 41 42 43 44 45 46 47 48 49 50 51 52 53 54 55 56 57 58 59 60 61 62 63 64 65 66 67 68 69 70 71 72 73 74 75 76 77 78 79 80 81 82 83 84 85 86 |
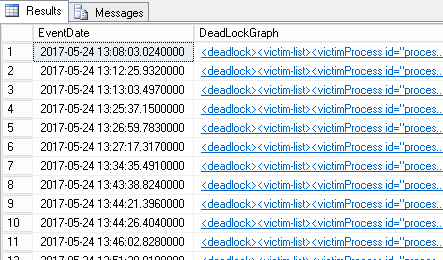
DECLARE @versionNb int; DECLARE @EventSessionName VARCHAR(256); DECLARE @DeadlockXMLLookup VARCHAR(4000); DECLARE @tsql NVARCHAR(MAX); DECLARE @LineFeedStr CHAR(2); DECLARE @EventFilePath VARCHAR(MAX); DECLARE @EventMetaFilePath VARCHAR(MAX); SELECT @LineFeedStr = CHAR(13) + CHAR(10), @versionNb = (@@microsoftversion / 0x1000000) & 0xff, @EventSessionName = 'Collect-Deadlocks' ; IF(@versionNb < 10) BEGIN RAISERROR('Extended events do not exist in this version',12,1) WITH NOWAIT; RETURN; END; SELECT @EventFilePath = LEFT(column_value, LEN(column_value) - CHARINDEX('.', REVERSE(column_value))) + '*' + RIGHT(column_value, CHARINDEX('.', REVERSE(column_value))-1) FROM sys.dm_xe_sessions s JOIN sys.dm_xe_session_object_columns soc ON s.address = soc.event_session_address WHERE s.name = @EventSessionName AND soc.object_name = 'asynchronous_file_target' AND soc.column_name = 'filename' ; -- getting back metadata file path SELECT @EventMetaFilePath = LEFT(column_value, LEN(column_value)- CHARINDEX('.', REVERSE(column_value))) + '*' + RIGHT(column_value, CHARINDEX('.', REVERSE(column_value))-1) FROM sys.dm_xe_sessions s JOIN sys.dm_xe_session_object_columns soc ON s.address = soc.event_session_address WHERE s.name = @EventSessionName AND soc.object_name = 'asynchronous_file_target' AND soc.column_name = ' metadatafile' ; -- Set the metadata filename if it is NULL to the log file name with xem extension SET @EventMetaFilePath = ISNULL(@EventMetaFilePath, LEFT(@EventFilePath, LEN(@EventFilePath)-CHARINDEX('*', REVERSE(@EventFilePath))) + '*xem') ; SET @tsql = 'WITH EventsData' + @LineFeedStr + 'AS (' + @LineFeedStr + ' SELECT' + @LineFeedStr + ' CAST(event_data AS xml) as XMLData' + @LineFeedStr + ' FROM sys.fn_xe_file_target_read_file(N''' + @EventFilePath + ''', N''' + @EventMetaFilePath + ''', null, null)' + @LineFeedStr + ')' + @LineFeedStr + 'SELECT' + @LineFeedStr + ' --n.value(''(@name)[1]'', ''varchar(100)'') AS event_name,' + @LineFeedStr + ' DATEADD(hh,DATEDIFF(hh,GETUTCDATE(),SYSDATETIME()),n.value(''@timestamp'', ''datetime2'')) as EventDate,' + @LineFeedStr + ' CAST(n.value(''(data/value)[1]'',''VARCHAR(MAX)'') AS xml) as DeadLockGraph' + @LineFeedStr + 'FROM EventsData ' + @LineFeedStr + 'CROSS APPLY ' + @LineFeedStr + ' XMLData.nodes(''event'') as q(n)' + @LineFeedStr + 'WHERE ' + @LineFeedStr + ' n.value(''(@name)[1]'', ''varchar(100)'') = ''xml_deadlock_report''' + @LineFeedStr + ';' ; --PRINT @tsql; EXEC sp_executesql @tsql; |
And here are sample results:
Code reuse
Almost all stored procedure will have to check if a table exists and some of them will need to create this table. So, for code reuse, those procedures will call a stored procedure called Utils.CheckTableExists that does the job. This procedure is functional but won’t check table structure. It could be an improvement for this procedure though.
Some procedure might also use different components for which articles have already been published on SQL Shack. It can also optionally use a table called Common.ApplicationParams that is just a parameter table with following structure:
|
1 2 3 4 5 6 7 8 9 10 11 12 13 14 15 16 17 18 19 20 21 22 23 24 25 26 |
CREATE TABLE [Common].[ApplicationParams]( [ApplicationName] [varchar](128) NOT NULL, [ParamName] [varchar](64) NOT NULL, [ParamValue] [varchar](max) , [DefaultValue] [varchar](max) , [ValueCanBeNULL] [bit] DEFAULT 0 NOT NULL, [isDepreciated] [bit] NOT NULL, [ParamDescription] [varchar](max) NULL, [creationdate] [datetime] NOT NULL, [lastmodified] [datetime] NOT NULL, CONSTRAINT [PK_ApplicationParams] PRIMARY KEY CLUSTERED ( [ApplicationName] ASC, [ParamName] ASC ) WITH ( PAD_INDEX = OFF, STATISTICS_NORECOMPUTE = OFF, IGNORE_DUP_KEY = OFF, ALLOW_ROW_LOCKS = ON, ALLOW_PAGE_LOCKS = ON ) ON [PRIMARY] )ON [PRIMARY] |
A stored procedure called Common.getApplicationParam is used to get value from this table.
Writing the extraction stored procedure
Now we defined the core components of our extraction, we can build a stored procedure that we can call no matter Extended Event target type. We will call this stored procedure Monitoring.CollectDeadlockInformation. It will have following parameters.
|
1 2 3 4 5 6 7 8 9 10 11 12 13 14 15 16 17 18 19 20 21 |
ALTER PROCEDURE [Monitoring].[CollectDeadlockInformation] ( @OutputType VARCHAR(16) = 'NONE', -- Possible values: NONE, SCHEMA, TABLE @EventSessionName VARCHAR(256) = 'system_health', @EventSessionTargetType VARCHAR(32) = NULL, @UseApplicationParamsTable BIT = 1, @ApplicationName VARCHAR(256) = '$(SolutionName)', @LastCollectionParameterName VARCHAR(256) = 'DeadlockEvents:LastCollectionTime', @StartDatePivot DATETIME2 = NULL, @EndDatePivot DATETIME2 = NULL, @OutputDatabaseName SYSNAME = NULL, @OutputSchemaName SYSNAME = NULL, @OutputTableName SYSNAME = NULL, @OutputAppendMode BIT = 1, -- set it to 0 to tell procedure to truncate table before inserting @Debug BIT = 0, @_NoEventSessionNameCheck BIT = 0 ) |
Note
- The @UseApplicationParamsTable, @ApplicationName and @LastCollectionParameterName are added for automated collection perspective. This automation will be covered in the next article of the series.
- The @_NoEventSessionNameCheck parameter will tell stored procedure to proceed without checking that the event session exists.
-
If the @OutputType value is TABLE then it will return a dataset with following columns:
- NULL value as DeadlockId
- ServerName, value returned by @@SERVERNAME
- DateStamp, when deadlock is marked to have occurred
- DeadlockGraph, the XML deadlock graph
- CollectionTime, when stored procedure ran.
The following steps will compose the body of this stored procedure.
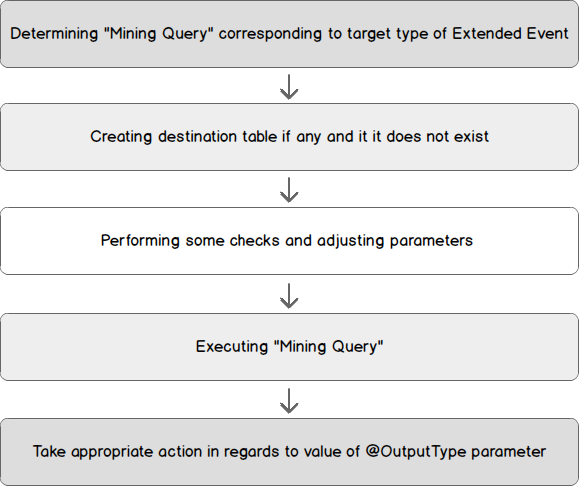
The creation script for this stored procedure and related objects are attached to this article with instructions for setup.
Writing the reporting stored procedure
The stored procedure presented here is an adaptation of the one we’ve seen for the generation of timelines from SQL Server Error Log. We will call it Reporting.DeadlockTimeLineFromTable. This procedure will generate a single dataset for a given time precision. This precision can be from days to minutes.
As the extraction procedure might change its destination table, this procedure will take a reference to an input table and will use dynamic SQL to retrieve data. We will also define an output table so that we can query its results a while after it has run without extra computation.
The user will also be able to define a time interval for this report so that only values in that interval will be found in the output dataset.
In addition, we will simplify the transfer to any spreadsheet tool to generate a bar diagram by adding a parameter that will fill the gaps between two records in the source dataset. This is the problem we already mentioned when we extracted deadlock occurrences from the SQL Server Error Log.
Finally, we will use the « Generic Reporting Execution Log » implementation presented in the article entitled A T-SQL design pattern for logging process execution.
So, this gives us following interface for Reporting.DeadlockTimeLineFromTable stored procedure:
|
1 2 3 4 5 6 7 8 9 10 11 12 13 14 15 16 17 18 19 |
PROCEDURE [Reporting].[DeadlockTimeLineFromTable]( @ReportTemplateName VARCHAR(256) = NULL , -- "Hour" | "minute" | "Day" | NULL @SourceDatabaseName VARCHAR(256) = NULL, @SourceSchemaName VARCHAR(256) = NULL, @SourceTableName VARCHAR(256), @SourceTimeColumnName VARCHAR(256), @FilterStartDate DATETIME = NULL, @FilterEndDate DATETIME = NULL, @OutputType VARCHAR(32) = 'NONE', -- NONE | TABLE | SCHEMA @OutputDatabaseName VARCHAR(256) = NULL, @OutputSchemaName VARCHAR(256) = NULL, @OutputTableName VARCHAR(256) = NULL, @FillTimeGaps BIT = 0, @Debug BIT = 1 ) |
Note
We could also refactor Reporting.DeadlockTimeLine stored procedure presented above to a procedure that would just extract deadlock occurrences from SQL Server Error Log to a table. (We could call this procedure Monitoring.CollectDeadlockInformationInLegacyMode).
If we do that, we could use Reporting.DeadlockTimeLineFromTable stored procedure to also generate reports based on its output table.
Summary
In the last article, we’ve seen what deadlocks are and how to keep track of them. In this article, we’ve seen two approaches to extract information:
- Reading and parsing the SQL Server Error Log
- Reading SQL Server Extended Events feature
For the second approach, we also defined the basis or the input of a process that would allow us to answer questions like “What applications are mostly implied in deadlocks?” or “Which queries lead to deadlock?” and so on. We will review this process in the next article.
Other articles in this series:
- What are SQL Server deadlocks and how to monitor them
- How to use SQL Server Extended Events to parse Deadlock XML and generate statistical reports
- How to automate SQL Server deadlock collection process using Extended Events and SQL Server Agent
Downloads

I'm one of the rare guys out there who started to work as a DBA immediately after his graduation. So, I work at the university hospital of Liege since 2011. Initially involved in Oracle Database administration (which are still under my charge), I had the opportunity to learn and manage SQL Server instances in 2013. Since 2013, I've learned a lot about SQL Server in administration and development.
I like the job of DBA because you need to have a general knowledge in every field of IT. That's the reason why I won't stop learning (and share) the products of my learnings.
View all posts by Jefferson Elias
- How to perform a performance test against a SQL Server instance - September 14, 2018
- Concurrency problems – theory and experimentation in SQL Server - July 24, 2018
- How to link two SQL Server instances with Kerberos - July 5, 2018