
Introduction
This article is the last one of a series in which we discussed how to collect data about deadlocks so that we can not only monitor them but also build reports based on our collection results.
If you came directly to this article, you will find below a list of previous articles with a little word about each of them. We recommend you to read them all before going any further.
- What are SQL Server deadlocks and how to monitor them
In this article, we’ve described what a deadlock is and what are the differences between deadlocks and blocking. We’ve also seen that there are multiple ways to monitor them (SQL Server Error Log, SQL Server Profiler and, starting SQL Server 2008, system_health or homemade Extended Events). - How to report on SQL Server deadlock occurrences
In the next article, we talked about data collection procedures that can be used to store information about deadlocks into a table from either Error Log and Extended Events. This information takes the form of an XML description of the deadlock events.We’ve also seen that we could generate a nice timeline of their occurrences over time for a given time period.
- How to use SQL Server Extended Events to parse a Deadlock XML and generate statistical reports
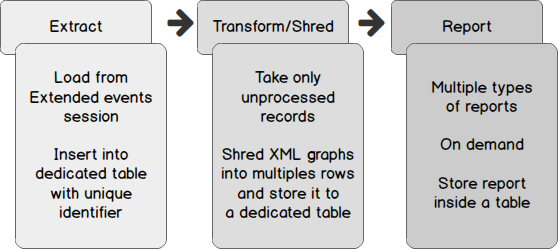
In the previous article, we defined and implemented (as dynamically as possible) a process for deadlock handling based on Extended Events consisting into three steps that were:
The „Extract” step is implemented in a stored procedure called Monitoring.CollectDeadlockInformation while the “Transform/Shred” step is implemented in the Reporting.ShredDeadlockHistoryTbl stored procedure. You can download the code of this procedure (and for related objects) from the following link, or at the end of third article of this series.
Now, it’s time to automate the first two steps of the above process. This means that we need to make choices on different aspects:
- Which data source will be used; system_health or homemade? And in what configuration?
- Which tables should be used as input or output of which part of the process?
- How will we automate things? Will we use a SQL Agent Job or a Windows Scheduled Task?
These questions will find answers in following sections.
Choosing source of our initial data collection
Here, we have two choices. We can either use a built-in Extended Events called system_health or create a specific one. If we choose system_health Extended Events though, there are some additional tasks that may be necessary to get something equivalent to a homemade Extended Event.
In order to properly choose our source, let’s first review what has to be done for each option.
Creating an Extended Event dedicated to deadlock monitoring
You will find attached to this article a file called:
Runnable.SetupMonitoringExtendedEvent.sql
This file contains the code to create such a specialized Extended Event Session. It’s a modified version of the one provided in first article and is almost executable directly: all we have to do is to edit following lines to match our configuration and requirements:
|
1 2 3 4 5 6 7 8 9 |
-- ======================== ( User Configuration ) SET @EventsOutputPath = 'D:\ScriptsLOGS\Monitoring\ExtendedEvents'; SET @EventSessionName = 'Collect-Deadlocks'; SET @EventMaxFileSizeMb = 512; SET @EventFileMaxNumber = 3; -- ======================== (DO NOT EDIT FROM HERE) |
As we can see, we can specify the output directory and the event session name. Filenames corresponding to that event session will bear the name of that session with a .xel extension.
We can also provide a maximum file size for these files and the number of files for roll-over logging.
This script is version-aware and generates different statement based on the version you are currently running. The reason for this is that File Target definition is slightly different between SQL Server 2008 (R2) and SQL Server 2012+. For further details about these differences, refer to first article of this series.
You can run this script multiple times if you want. It will check for the existence of an Extended Event Session called by the value of @EventSessionName and will only launch creation statement if no session exists. This means that it won’t alter an existing Extended Events Session.
If we want to check for the existence of our Extended Events Session, we can use following T-SQL statement:
|
1 2 3 4 5 6 7 8 9 10 11 12 13 14 15 16 17 |
SELECT es.Name as SessionName, CASE WHEN ISNULL(es.name,'No') = 'No' THEN 'NO' ELSE 'YES' END AS EventSessionExists, CASE WHEN ISNULL(xe.name,'No') = 'No' THEN 'NO' ELSE 'YES' END AS EventSessionRunning FROM sys.server_event_sessions es LEFT OUTER JOIN sys.dm_xe_sessions xe ON es.name = xe.name -- WHERE es.Name = 'Collect-Deadlocks' ; |
Here is a sample output:
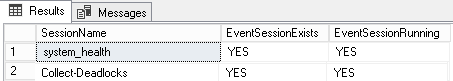
As soon as we see a state like second line in previous example, we are able to get deadlock graphs from Collect-Deadlocks Event Session using a modified version of the script presented in section entitled Option 3: Extended Events and system_health session of first article. This version can be downloaded as a stored procedure call Monitoring.CollectDeadlockInformation in the archive containing All scripts used along this series. The link to this archive can be found at the end of this article.
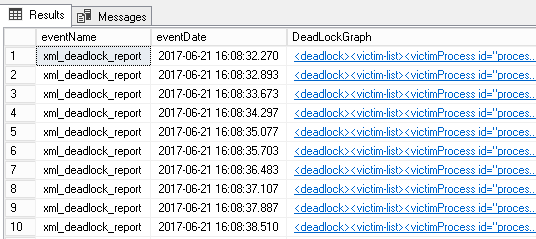
Note that, as stated above, we can say that it collects live data because it reads corresponding session log files and displays the results but.
Here is the kind of the output you would get when executing the modified version of this query:
In the configurable values presented above, there is a variable called @EventsOutputPath. This variable tends to tell that the Extended Events Session we created writes its data to disk and it’s absolutely the case! Expressed in technical terms, we used a File Target Type for our Extended Events. If we consider system_health and we generate the script to recreate it, we will see that there is another Target Type called Ring Buffer. Let’s see the differences between both target types and make the appropriate choice.
Target types considerations: Ring Buffer vs File
According to Microsoft’s documentation page about Ring Buffer Target, this target type holds event data in memory while the event session is active. This means that when the Event Session is stopped, SQL Server frees allocated memory buffers and therefore we can’t access previously collected data anymore.
This also means that a restart of SQL Server instance would lead to a loss of collected data too.
In contrast, stopping an Event Session or restarting SQL Server won’t affect a File target.
We can conclude that we should choose File Target over Ring Buffer whenever data persistence is considered important.
Customizing system_health Extended Event
Before SQL Server 2012
In SQL Server 2008 and 2008R2, system_health only has ring_buffer target, so no persisting data could be retrieved.
The following query will give you a list of target types per event session.
|
1 2 3 4 5 6 |
select sess.name as SessionName, tgt.target_name from sys.dm_xe_sessions sess inner join sys.dm_xe_session_targets tgt on sess.address = tgt.event_session_address |
If we run it against a SQL Server 2008 R2 instance, we will get following results:
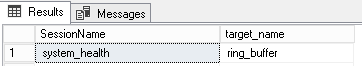
Since we’ve seen how to create a complete Extended Event Session with a file target, it’s not a difficult task to edit the system_health session in SQL Server 2008 (R2) so that it also writes to an asynchronous file target.
Starting SQL Server 2012
Starting this version, both targets ring_buffer and file targets are defined.
We can run the previous query against a SQL Server 2012 instance and we will get:
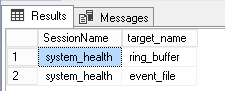
So, data from system_health event now can persist after a server restart. Let’s first check its configuration with the following query.
|
1 2 3 4 5 6 7 8 9 10 11 12 13 14 15 16 17 |
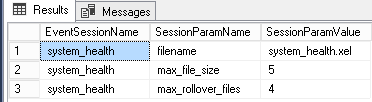
SELECT es.name as EventSessionName, esf.name as SessionParamName, esf.value as SessionParamValue FROM sys.server_event_session_fields AS esf JOIN sys.server_event_sessions AS es ON esf.event_session_id=es.event_session_id WHERE es.startup_state=1 AND es.name = 'system_health' AND esf.name IN ('filename','max_file_size','max_rollover_files') ; |
We will notice that this target will roll over four files of 5 Mb each. This means that we only keep 20 Mb of data.
If we estimate this is not enough, we could edit the configuration for this target. This is done by dropping the event target and creating a new file target to the system_health extended event.
|
1 2 3 4 5 6 7 8 9 10 11 12 13 14 15 16 17 18 19 20 21 22 23 |
-- Preferable to stop server activity -- and prevent end user connections. ALTER EVENT SESSION [system_health] ON SERVER STATE = STOP ; GO -- Remove the file target ALTER EVENT SESSION [system_health] ON SERVER DROP TARGET package0.event_file ; -- Define new file target with new settings ALTER EVENT SESSION [system_health] ON SERVER ADD TARGET package0.event_file ( SET FILENAME = N'system_health.xel', max_file_size = (100), --size of each file in MB max_rollover_files = (10) ) GO -- Restart Session ALTER EVENT SESSION [system_health] ON SERVER STATE = START GO |
Note
Don’t forget to check that there is enough space on event file target partition or disk.
Setting values to variable components once for all
We are about to create an automatic data collection and split of data related to deadlock. The stored procedures presented above have variable input and output and so are parameterizable.
We will now define, once for all, values to these parameters as follows:
-
Source Extended Event (name and target type).
Based on considerations from the previous section, we will choose the Collect-Deadlocks Extended Events option that we can create using attached script called Runnable.SetupMonitoringExtendedEvent.sql vs the system_health Extended Event. Another reason to that choice it that I think it’s preferable not to “hack” the system.As a reminder, the Collect-Deadlocks Extended Event is defined to use a file target type.
-
The name of the output table of the “Extract” step.
We will call it Monitoring.DeadlocksHistory. This will be the name of the source for next step. -
The name of the output table of the “Transform/Shred” step.
This table will be called Reporting.ShreddedDeadlocksHistory.
For simplicity of management, these two tables will be stored in the same database as the stored procedures.
In terms of Transact SQL, this means the script that will setup the automation process will contain following lines, assuming we are already connected to the appropriate database:
|
1 2 3 4 5 6 7 8 9 10 11 12 13 14 15 |
DECLARE @TargetDatabaseName VARCHAR(256); DECLARE @HistorySchemaName VARCHAR(256); DECLARE @HistoryTableName VARCHAR(256); DECLARE @ShreddingSchemaName VARCHAR(256); DECLARE @ShreddingTableName VARCHAR(256); SELECT @TargetDatabaseName = DB_NAME(), @HistorySchemaName = 'Monitoring', @HistoryTableName = 'DeadlocksHistory', @ShreddingSchemaName = 'Reporting', @ShreddingTableName = 'ShreddedDeadlocksHistory' ; |
For an automation mechanism, we have multiple choices, but, for simplicity, we will choose to create a SQL Server Agent Job and schedule its execution regularly so that collection of deadlocks information won’t be too long.
Creating the automation mechanism, using SQL Server Agent
Now, we will review the steps we should follow in order to create a SQL Server Agent Job that will call both Monitoring.CollectDeadlockInformation and Reporting.ShredDeadlockHistoryTbl procedures.
Each procedure call will be defined as a step of this SQL Server Agent Job with a transition condition: the first step (corresponding to “Collect” step) must succeed for the second step to run (corresponding to the “Transform/shred” step).
We will schedule this collection every hour as:
- The main purpose is more reporting than monitoring because there is no DBA action required when it happens
- Following the same logic, we don’t need live data
- In our configuration, data will be collected to disk, so there is no emergency for getting back data.
Here are the steps in SQL Server Management Studio (SSMS) to create such a job.
- Open SQL Server Management Studio (SSMS) and connect to the target database server for which you want to monitor and analyze deadlocks
- In Object Explorer, go down to “SQL Server Agent” node and right-click on it.
-
This will open a contextual menu. With your mouse, go over an item called ”New” and click on “Job”.
-
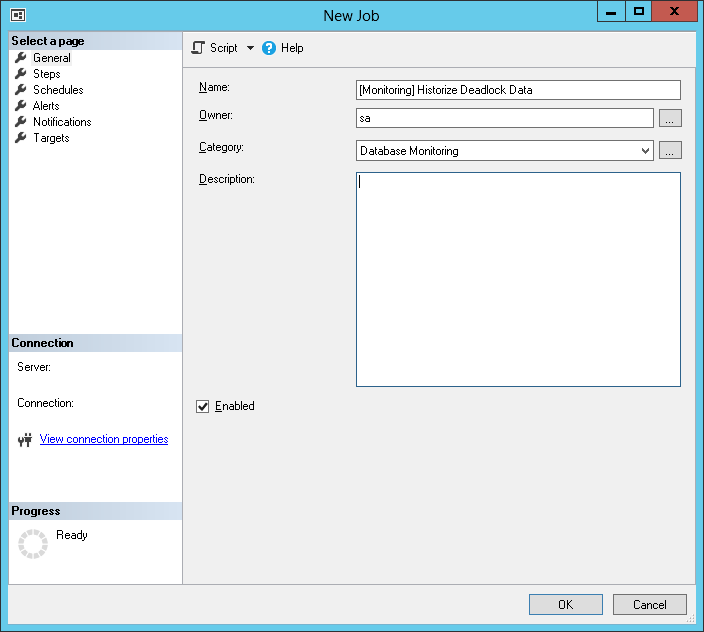
In “New Job” dialog, fill in general information as follows:
- Then, select “Steps” page.
-
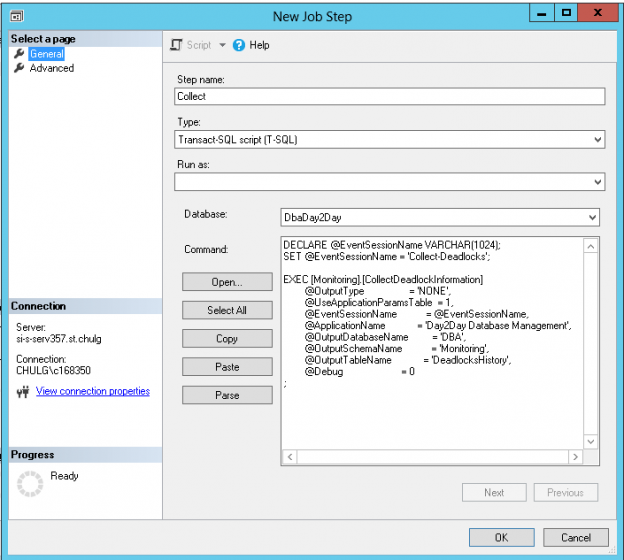
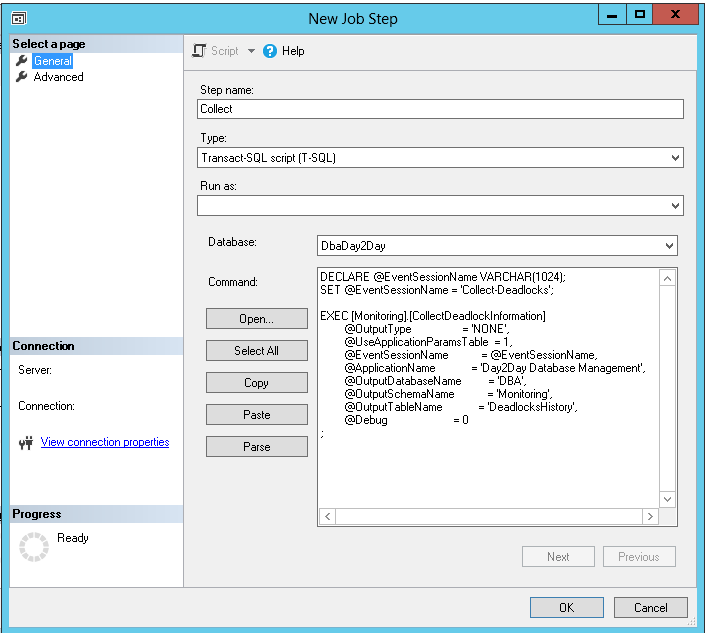
Click on “New” button and add a new step called “Collect” as follows
For convenience, here is the code pasted in “Command” text field:
123456789101112131415DECLARE @EventSessionName VARCHAR(1024);SET @EventSessionName = 'Collect-Deadlocks';EXEC [Monitoring].[CollectDeadlockInformation]@OutputType = 'NONE',@UseApplicationParamsTable = 1,@EventSessionName = @EventSessionName,@ApplicationName = 'Day2Day Database Management',@OutputDatabaseName = 'DBA',@OutputSchemaName = 'Monitoring',@OutputTableName = 'DeadlocksHistory',@Debug = 0; -
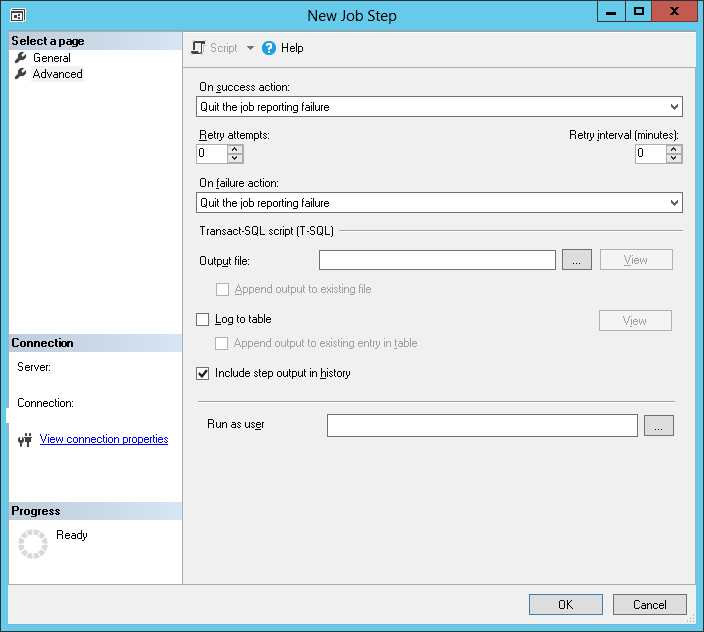
Go to “Advanced” page and set that the job should fail if this step fails. Set also that SQL Server Agent should include step output to job history. Then click OK.
-
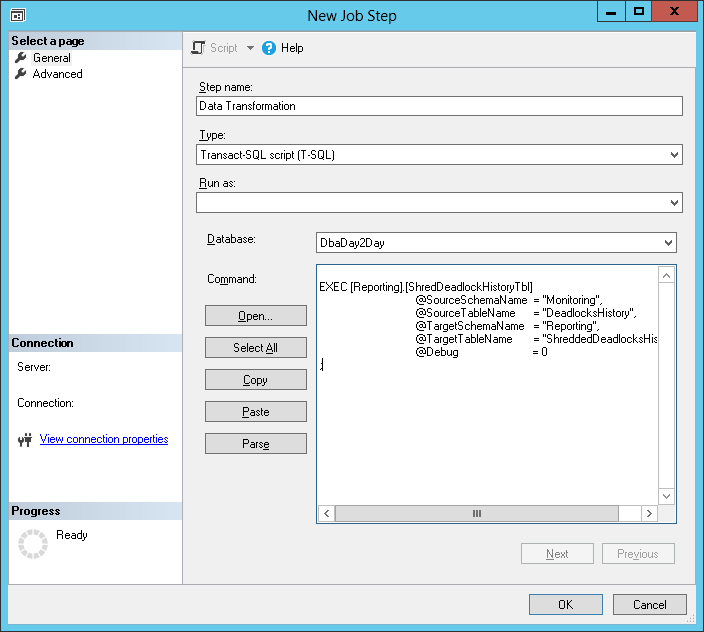
Create a “Data Transformation” step that will transform collected data and split it into a set of records in the table we defined above. It should look like following screen capture:
Still for convenience, here is the code used in the “Command” text field:
123456789EXEC [Reporting].[ShredDeadlockHistoryTbl]@SourceSchemaName = ''Monitoring'',@SourceTableName = ''DeadlocksHistory'',@TargetSchemaName = ''Reporting'',@TargetTableName = ''ShreddedDeadlocksHistory'',@Debug = 0;Once done, also check the “include step output in history” checkbox in “Advanced” page then click OK.
- Go to “Schedules” page
-
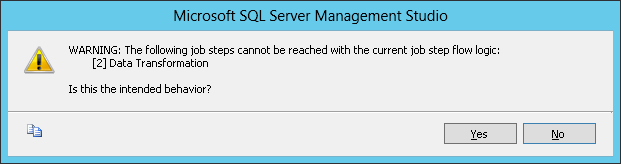
SSMS will detect that step 2 could be by-passed in some situations and will show you a warning dialog:
Just ignore it and click on “Yes”.
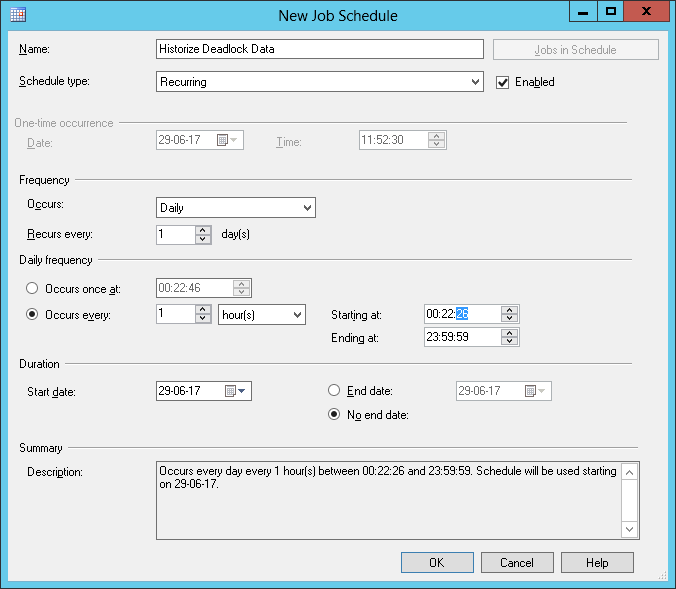
-
Add a specific schedule for this job. Here is an example:
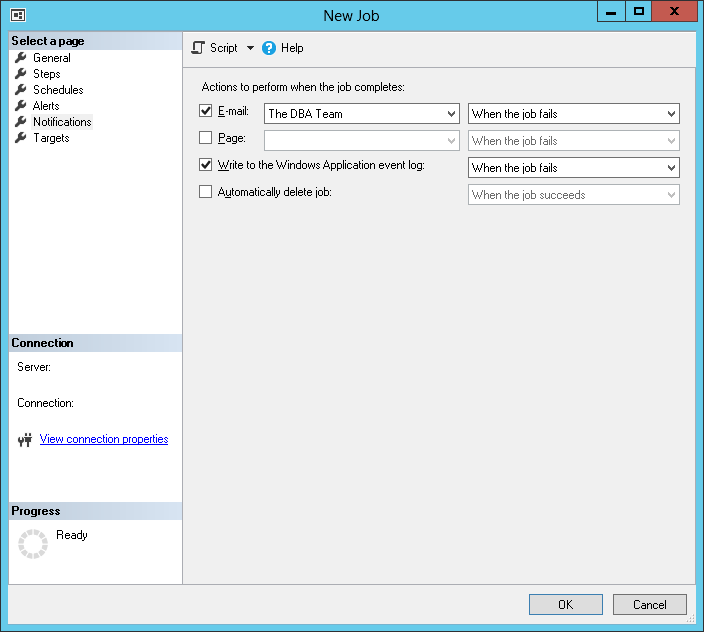
-
Go to the “Notifications” page and set the options you want. Here I told SQL Server Agent to send an email and write to Event Log whenever this job fails.
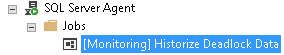
- Once you think everything is ok, press the “OK” button.

And now, the job will appear in Jobs list:
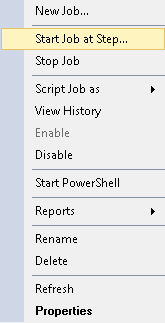
If you want to check everything is OK, you could run the job by right-clicking on it then clicking on “Start Job at Step…” in contextual menu
If we don’t have centralized management and execution for SQL Server Agent jobs, we have to set this job for each and every SQL Server instance. To do so, we could follow these steps but it would be nicer to automate this process.
There are two alternatives:
- You can script the job to a file and run it against each SQL Server instance. But this means you should ask for a “Drop and create” script. Otherwise, you could get an error when the job already exists.
- You could create your own script that would work at every execution and would let intact an existing SQL Agent job called “[Monitoring] Historize Deadlock Data”. Such a script is attached to this article and bear the name of “Runnable.SetupMonitoringAgentob.sql”.
Note
Once this collection process is in place, you should take time to define a data management process that will delete rows that are too old and so not needed anymore.
Conclusion
This closes our series of articles about deadlocks.
We’ve made a great journey from the first article, where we learned what a deadlock in contrast to blocking is, until this one, where we used everything we defined in previous articles to create an automated collection of information about deadlock.
If everything went successfully and collection runs regularly, we are now able to report issues to developers or support teams with valuable information they can use in order to fix recurrent deadlock signatures.
Previous articles in this series:
- What are SQL Server deadlocks and how to monitor them
- How to report on SQL Server deadlock occurrences
- How to use SQL Server Extended Events to parse Deadlock XML and generate statistical reports
Downloads
- Runnable.SetupMonitoringAgentJob.sql
- Runnable.SetupMonitoringExtendedEvent.sql
- All scripts used along this series

I'm one of the rare guys out there who started to work as a DBA immediately after his graduation. So, I work at the university hospital of Liege since 2011. Initially involved in Oracle Database administration (which are still under my charge), I had the opportunity to learn and manage SQL Server instances in 2013. Since 2013, I've learned a lot about SQL Server in administration and development.
I like the job of DBA because you need to have a general knowledge in every field of IT. That's the reason why I won't stop learning (and share) the products of my learnings.
View all posts by Jefferson Elias
- How to perform a performance test against a SQL Server instance - September 14, 2018
- Concurrency problems – theory and experimentation in SQL Server - July 24, 2018
- How to link two SQL Server instances with Kerberos - July 5, 2018