
Introduction
As a DBA, I’ve been, more than, confronted with performance problems. Sometimes, poorly written code or lack of indexes will generate blocking conditions that we refer to as a“Deadlock”. Due to their nature and like any similar blocking situation, deadlocks can have a direct impact on user experience and the more they occur, the bigger the impact.
This article is the first one of a series that will focus on deadlock issues and reporting. After reading this article you will be able to explain how a deadlock can occur and how we can get extended information about this deadlock so that we will be able to diagnose and take the appropriate actions. These actions would lead to either a lower occurrence frequency or a total disappearance of deadlock conditions.
So, in the following sections, we will try to understand, basically, what a deadlock is and how it occurs with a practical example in T-SQL. Then we will see that SQL Server actually has some tools to help detect their occurrences and get everything we need to find and fix it, although the solution might be simpler said than done…
Basics understanding
Intuitive comprehension
So, what is a “deadlock”? Etymologically, it can be divided into two root words: “dead” and “lock”. We could intuitively understand it as a lock that leads to a dead end…
In relational database management systems, locking is a mechanism that happens every time. Actually, we can acquire a lock on different kind of resources (row identifier, key, page, table…) and using different modes (shared, exclusive…). Choosing a mode instead of another to access a given resource in a session will either let other sessions (or transaction) access the same resource or will make other sessions wait for that resource to be unlocked. Let’s notice that all locking modes are not compatible. For that reason, Microsoft provided a documentation page about what they call lock compatibility.
Still, intuitively, we could say that a deadlock falls into the second case, the one that tells other sessions to wait for a resource, but this wait might never end. This second case is commonly referred to as “blocking”. We will take some time to understand blocking before talking about deadlocks as they seem to be the worst case of blocking
Understanding blocking
A blocking situation can be understood with the following example.
Let’s assume that we have two database users already connected to SQL Server using an application: UserA and UserB.
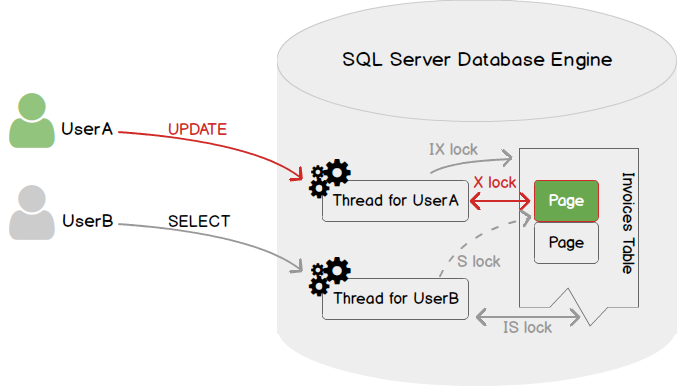
UserA is currently editing an invoice, which implies an UPDATE statement against an Invoice table with a WHERE clause that restricts to a particular value of InvoiceId column of that table. To perform this operation, the thread associated to that session inside SQL Server database engine has to acquire and hold:
- An Intent-Exclusive (IX) lock on the Invoice table and on the page, that contain the row userA is editing. This lock is used to establish a lock hierarchy in order to perform data modifications.
- An Exclusive (X) lock on the row userA is editing. This means that the session will be the only one allowed to modify that row until it releases this lock.
At the same time, UserB wants to get a list of the invoices for current month and unfortunately, the invoice UserA is editing sits in that list. UserB’s thread will:
- Acquire an Intent Shared (IS) lock on the Invoice table. This lock is used to establish a lock hierarchy in order to perform read-only operations. This will work as IX and IS on a table are compatible.
- Try to attempt a shared (S) lock on the pages needed to display the list. Among them, the page with an X lock acquired by UserA. However, shared and exclusive locks are incompatible (even semantically). This means that thread taking care of UserB’s session has to wait for UserA’s session to release this X lock. Until that happen, we can say that UserB’s session is blocked by UserA’s session.
The situation can be graphically summarized as follows:
As we may expect, we can encounter a lot more complex situations, involving a session holding multiple locks on multiple resources. However, when blocking occurs, using the appropriate query, we will be able to get a tree view of blocking like the following one:
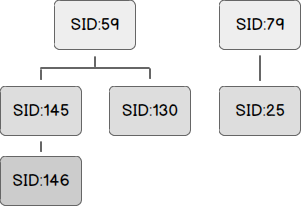
In this example, we would pinpoint three blocking sessions (59, 79, 145) but as the session with id 145 is actually blocked by the session with id 59, there are actually two “top blocking sessions” (59 and 79). These are called “head blockers” while the other sessions are called “waiters”.
Understanding deadlocks
Although it’s based on the same principles, deadlocks are different from blocking. Actually, when a deadlock situation happens, there is no identifiable head blocker as both sessions implied hold incompatible locks on objects the other session needs to access. It’s a circular blocking chain.
For better understanding, we will go back to the situation we used for blocking presentation and add some complexity to that situation.
Let’s say that in order to modify a row in Invoice table, UserA must also read from an InvoiceDetails table to get the total that is billed to customer. Let’s say that, no matter the reason, UserB has already acquired an exclusive lock on a page containing a row of InvoiceDetails table that UserA needs to read.
In such a case, we are in the situation depicted by following figure. (As a reminder, green is used to refer to UserA and orange for UserB)
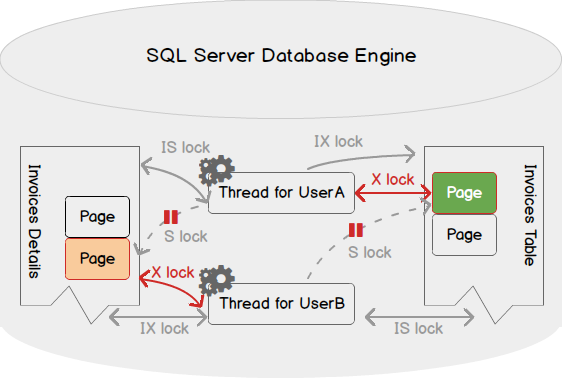
As you can see in the figure above, both threads are waiting for a lock that won’t be ever released as the activity of one is suspended until the other releases its acquired locks. There can be more complicated in real-life situations and I would suggest those interested in the subject to search the web for resources like the one written by Minette Steynberg in 2016 entitled What is a SQL Server deadlock?.
Fortunately, the SQL Server database engine comes with a deadlock monitor thread that will periodically check for deadlock situations, choose one of the processes implied as a victim for termination. While this is a good point for one of the sessions, this is not for the other. The “victim” is actually terminated with an error and has to be run again.
Here is some further information about the deadlock monitor thread:
- It runs every 5 seconds by default
- When it detects a deadlock, this interval falls from 5 seconds to as low as 100 milliseconds based on frequency of deadlock occurrences
- When it finally finds no deadlock, it put the interval to its default of 5 seconds
-
Once the deadlock victim is chosen, it will roll back the transaction of this victim and return a 1205 error message to the user. The error message looks like follows
Transaction (Process ID 89) was deadlocked on resources with another process and has been chosen as the deadlock victim. Rerun the transaction.
- By default, the deadlock victim is chosen based on the estimated amount of resource consumption for rolling back. It’s the least expensive one that is chosen. We can use SET DEADLOCK_PRIORITY <Value> statement to influence the choice of deadlock victim.
Deadlock in action
In this section, we will implement the example explained above in T-SQL and check that the explanation corresponds to what actually happens in the real world.
In this example, we have 2 tables: Invoices and InvoiceDetails. We will build these tables based on AdventureWorks database.
|
1 2 3 4 5 6 7 8 9 10 |
-- Invoices SELECT * INTO dbo.Invoices FROM [AdventureWorks].[Sales].[SalesOrderHeader] -- InvoiceDetails SELECT * INTO dbo.InvoiceDetails FROM [AdventureWorks].[Sales].[SalesOrderDetail] |
First session, representing UserA in the example, will run following statement. Notice that there is no commit.
|
1 2 3 4 5 6 7 8 9 10 11 12 13 14 15 16 17 18 19 20 |
DECLARE @SalesOrderId BIGINT; DECLARE @SumValue BIGINT; SET @SalesOrderId = 43659; --SELECT * From dbo.Invoices where SalesOrderId = @SalesOrderId ; BEGIN TRAN SELECT @SumValue = SUM(LineTotal) -- we will round up to next int FROM dbo.InvoiceDetails WHERE SalesOrderId = @SalesOrderId UPDATE dbo.Invoices SET SubTotal = @SumValue , TaxAmt = @SumValue * .21 WHERE SalesOrderId = @SalesOrderId ; |
We can check that the transaction is still open, so not rolled back neither committed using following query:
|
1 2 3 |
SELECT * FROM sys.sysprocesses WHERE open_tran = 1 |
Now, let’s run following statement in another session which will play the role of UserB in our example.
|
1 2 3 4 5 6 7 8 9 10 |
DECLARE @SalesOrderId BIGINT; DECLARE @SumValue BIGINT; SET @SalesOrderId = 43659; BEGIN TRAN UPDATE dbo.InvoiceDetails SET LineTotal = 0 where SalesOrderId = @SalesOrderId ; SELECT * FROM dbo.Invoices where SalesOrderId = @SalesOrderId ; |
If now, we run following statement in first session (UserA):
|
1 2 3 |
select * from dbo.InvoiceDetails; |
Then, either session (UserA or UserB) will be marked for deadlock. In my case, it was UserA’s session.

If we rollback, nothing should have changed for SalesOrderId #43659.
How to keep track of deadlocks occurrences only?
Well, we now know what a deadlock is and the error 1205 is raised by Deadlock monitor thread. If we only need to get an overview of deadlock occurrences for a timed interval, we could run the following statement against a SQL Server instance:
|
1 2 3 |
EXEC sp_altermessage 1205, 'WITH_LOG', 'true' |
This statement will tell SQL Server to log any 1205 error messages to SQL Server Error Log. Using xp_readerrorlog stored procedure, we will be able to read this log and get back only records of 1205 error.
How to keep track of deadlocks details
Option 1: Trace Flags 1204 and 1222
DBAs can tell SQL Server to (temporarily) change its behavior by specifying a trace flag. These trace flags are enabled and disabled using following instruction:
|
1 2 3 4 |
DBCC TRACEON(<Flag_Number>,-1) ; DBCC TRACEOFF(<Flag_Number>,-1) ; |
An alternate way to enabling trace flags is by defining them as startup parameters to SQL Server service:
|
1 2 3 |
-T<Flag_Number> |
Note that this requires a restart of SQL Server services.
There are two trace flags or interest for deadlock monitoring: 1204 and 1222.
According to documentation on Microsoft’s website, the first one will tell SQL Server to return resources and types of lock participating in a deadlock and also the current command affected while the second one returns the resources and types of lock that are participating in a deadlock and also the current command affected in an XML format.
Basically, both do the same job and I would recommend using 1222 trace flag in preference to the first one as it will generate an XML which is easier to parse and integrate.
The output of both trace flags will be visible in SQL Server Error Log.
This is an old-fashioned way to get deadlock information and I would only recommend this one when the other methods are not available. Plus, we will need to build a specific parser to extract data for further analysis.
Option 2: SQL Server Profiler and SQL Server Trace
This is also an old way to get detailed information about deadlock occurrences introduced in SQL Server 2005. This seems to be the most commonly used by developers and DBAs.
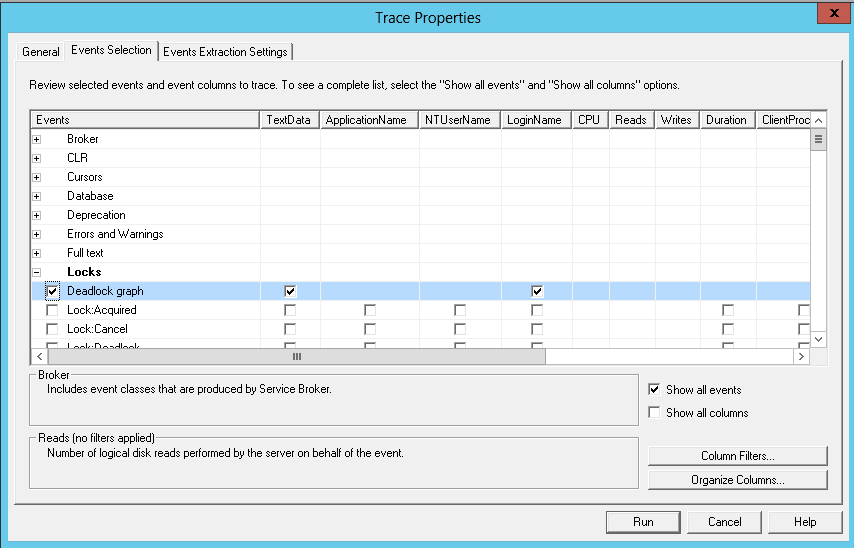
We open SQL Server Profiler and create a new trace with selected Locks/Deadlock Graph item:
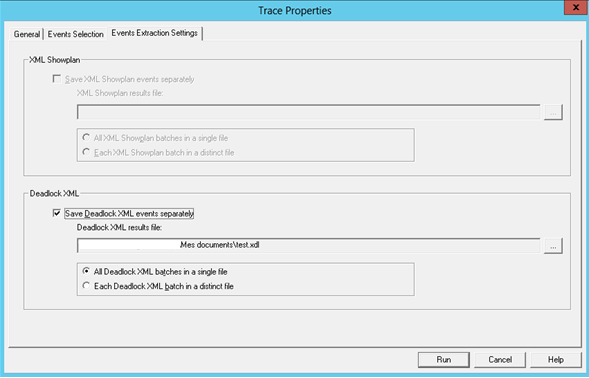
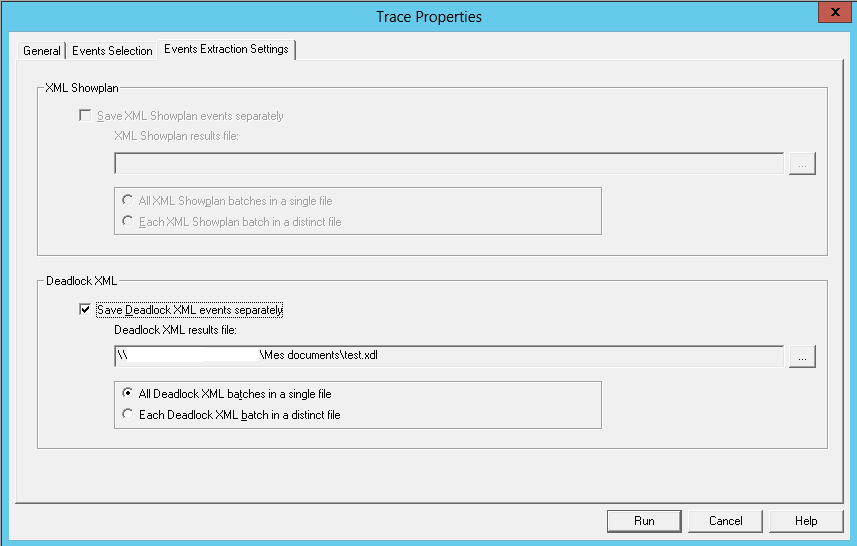
When this item is selected, we can go to the third tab and specify whether to save deadlock XML events in a separate results file. We will need to parse this file with a script or something else.
This method is simple and provides a results we can use quite easily to investigate deadlocks. We can also run the T-SQL equivalent code to generate the trace.
Note: This solution can impact performance as it will use additional resources to collect and provide deadlock information to user. As such, this isn’t the optional solution
Option 3: Extended Events and system_health session
In SQL Server 2008, Extended Events were introduced and a default Extended Events session called system_health was defined. This session starts automatically with the SQL Server Database Engine and collects system data to help DBAs in troubleshooting performance issues.
Actually, it collects information about any detected deadlock into XEL files. We can extract information from these files either:
- using Dynamic Management views and functions;
-
using the function provided by Microsoft to read data from an Extended Events Session file:
123sys.fn_xe_file_target_read_file
This collection is totally integrated and does not harm performances.
You will find below an example query to get deadlock XML from system_health session.
|
1 2 3 4 5 6 7 8 9 10 11 12 13 14 15 16 17 18 19 20 21 22 23 24 25 26 27 28 29 30 31 32 33 34 35 36 37 38 39 40 41 42 43 44 45 46 47 48 49 50 51 52 53 54 55 |
-- Tested on SQL Server 2008 R2 and 2012 DECLARE @versionNb int; DECLARE @EventSessionName VARCHAR(256); DECLARE @DeadlockXMLLookup VARCHAR(4000); DECLARE @tsql NVARCHAR(MAX); DECLARE @LineFeed CHAR(2); SELECT @LineFeed = CHAR(13) + CHAR(10), @versionNb = (@@microsoftversion / 0x1000000) & 0xff, @EventSessionName = ISNULL(@EventSessionName,'system_health') ; IF (@versionNb = 10) BEGIN SET @DeadlockXMLLookup = 'XEventData.XEvent.value(''(data/value)[1]'',''VARCHAR(MAX)'')'; END; ELSE IF(@versionNb < 10) BEGIN RAISERROR('Extended events do not exist in this version',12,1) WITH NOWAIT; RETURN; END; ELSE BEGIN SET @DeadlockXMLLookup = 'XEventData.XEvent.query(''(data/value/deadlock)[1]'')'; END; SET @tsql = 'WITH DeadlockData' + @LineFeed + 'AS (' + @LineFeed + ' SELECT ' + @LineFeed + ' CAST(target_data as xml) AS TargetData' + @LineFeed + ' FROM ' + @LineFeed + ' sys.dm_xe_session_targets st' + @LineFeed + ' JOIN ' + @LineFeed + ' sys.dm_xe_sessions s ' + @LineFeed + ' ON s.address = st.event_session_address' + @LineFeed + ' WHERE name = ''' + 'system_health' + '''' + @LineFeed + ' AND st.target_name = ''ring_buffer'' ' + @LineFeed + ')' + @LineFeed + 'SELECT ' + @LineFeed + ' XEventData.XEvent.value(''@name'', ''varchar(100)'') as eventName,' + @LineFeed + ' XEventData.XEvent.value(''@timestamp'', ''datetime'') as eventDate,' + @LineFeed + ' CAST(' + @DeadlockXMLLookup + ' AS XML) AS DeadLockGraph ' + @LineFeed + 'FROM ' + @LineFeed + ' DeadlockData' + @LineFeed + 'CROSS APPLY ' + @LineFeed + ' TargetData.nodes(''//RingBufferTarget/event'') AS XEventData (XEvent)' + @LineFeed + 'WHERE ' + @LineFeed + ' XEventData.XEvent.value(''@name'',''varchar(4000)'') = ''xml_deadlock_report''' + @LineFeed + ';' ; EXEC sp_executesql @tsql; |
This script can also run against another extended events session as the one in next subsection.
Option 4: Custom Extended Events Session
Extended Events are a great feature in which we define the events and associated information we want to collect.
Starting SQL Server 2012, SQL Server Management Studio (SSMS) provides a graphical user interface to work with extended events. We will go through the steps to create a custom extended event that will keep track of the deadlock graph with extended information. For T-SQL friendly guys, generated code will also be provided.
Unfortunately, this solution won’t work on versions prior to SQL Server 2012 without adaptations to the generated script.
In SSMS, rendezvous at “management” item in the tree view of a SQL Server connection. Expand it to have the following view then right-click on “Sessions” to open up a menu.
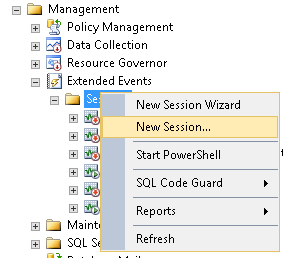
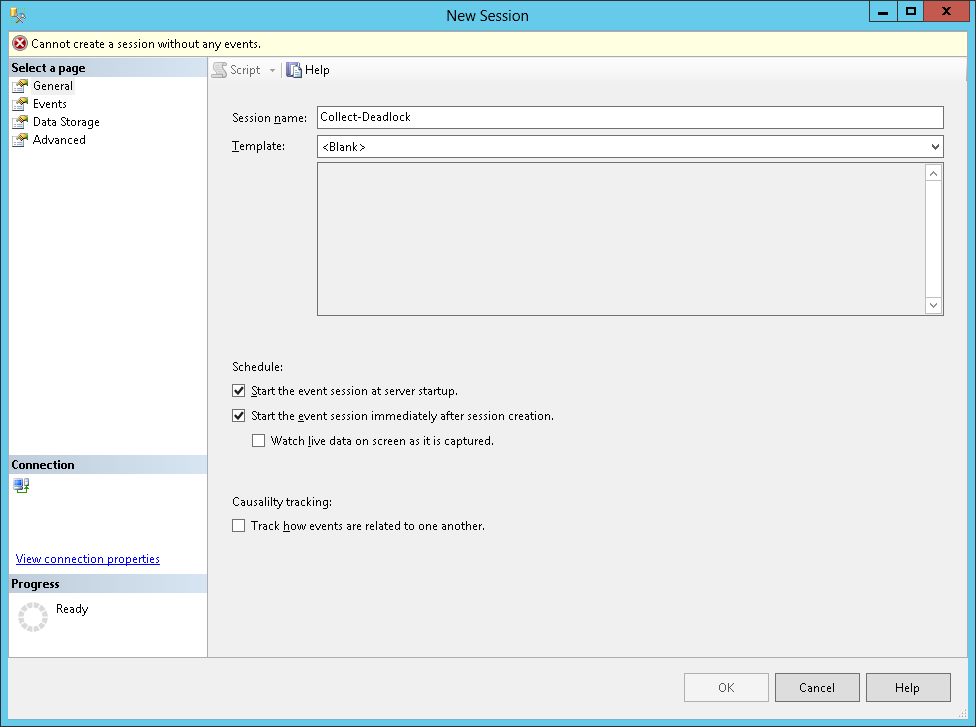
Click on “New Session…”.
The following windows will show up. Fill the information as you want. Notice that I checked two checkboxes under “Schedule:”.
Now we set General parameters, let’s select events. There is a filter on the events view that will help us to only get the list of deadlock related events.
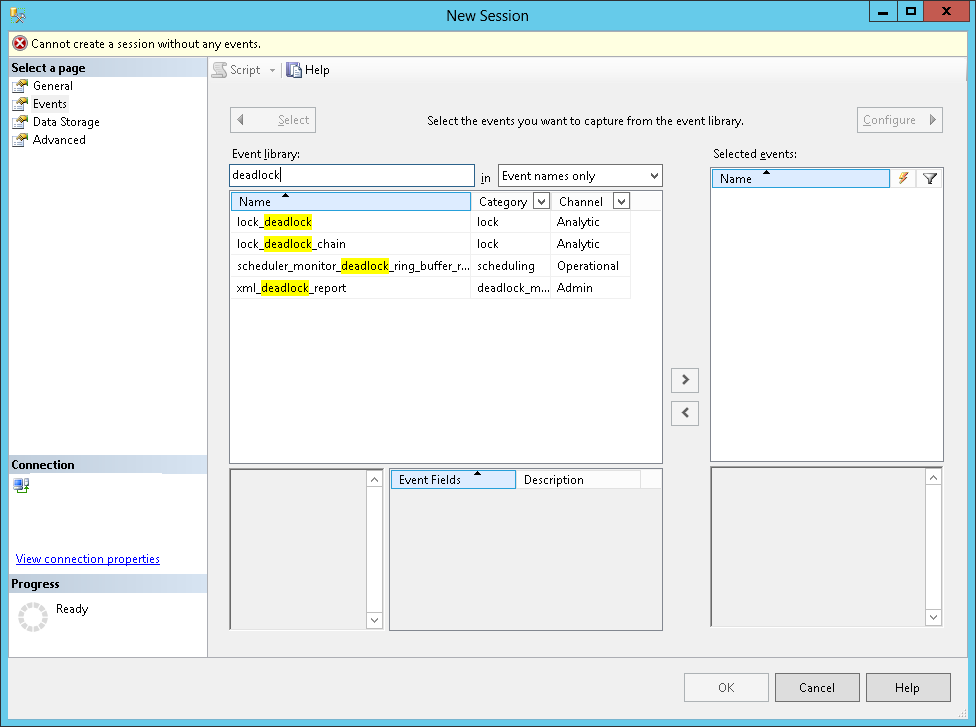
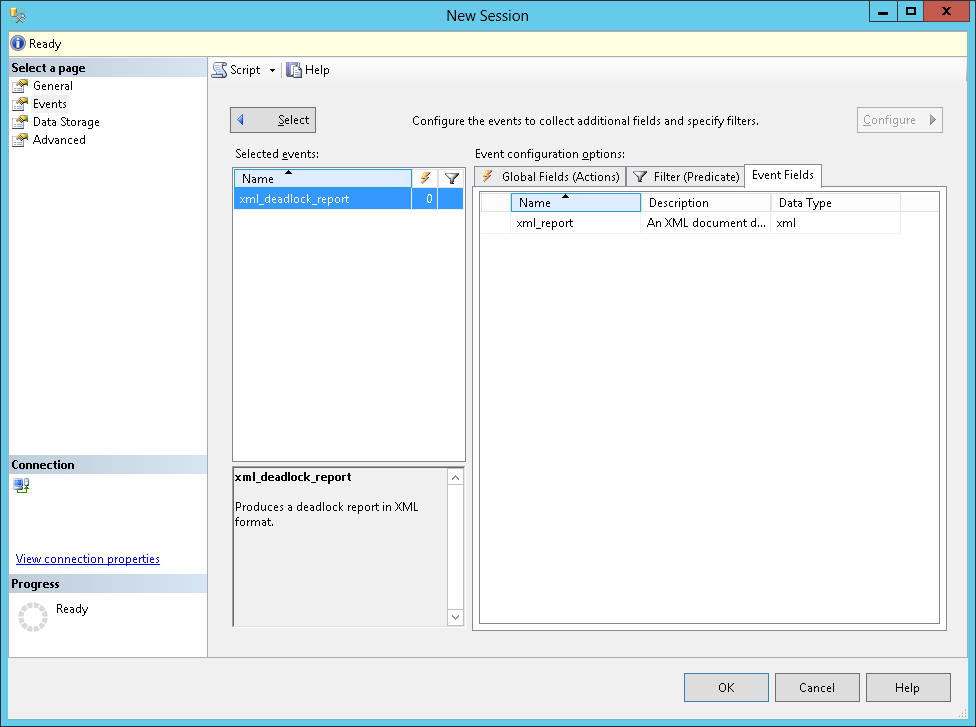
We should only need xml_deadlock_report event and we can either double-click on it or click on the “>“ sign. Once done, this event will appear in the “Selected events” list. Actually, an item of this list can be customized by double-clicking on it. So, if we double-click on xml_deadlock_report or if we select an item and click on the “Configure” button on top-right corner, the interface will change to an event editing panel as follows:
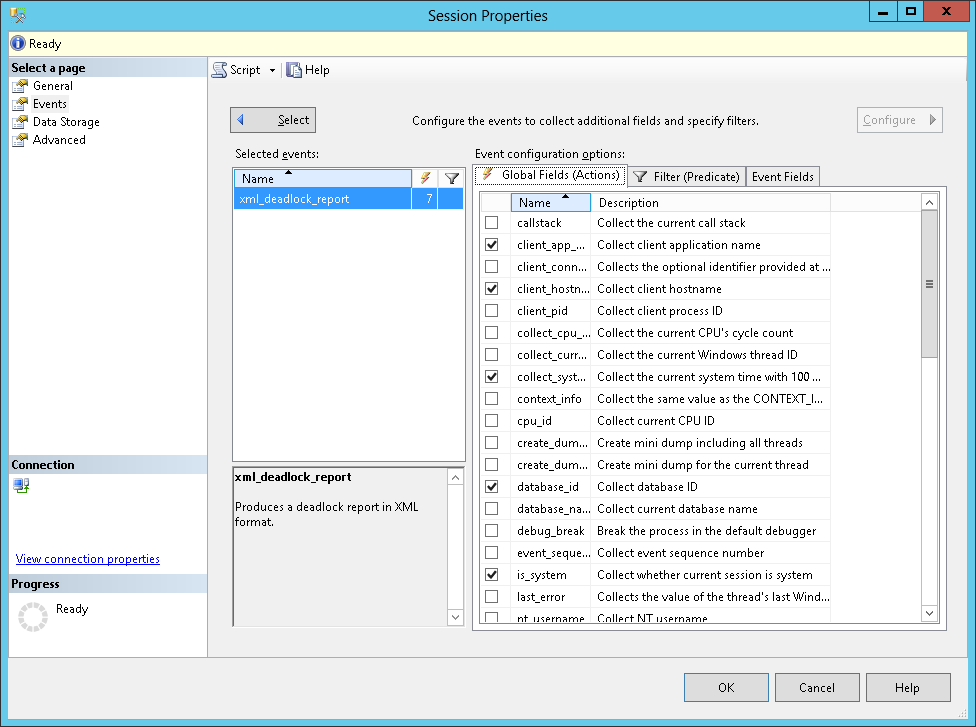
If we go on the “Global fields” tab, we can actually add actions and so information to our events collection.
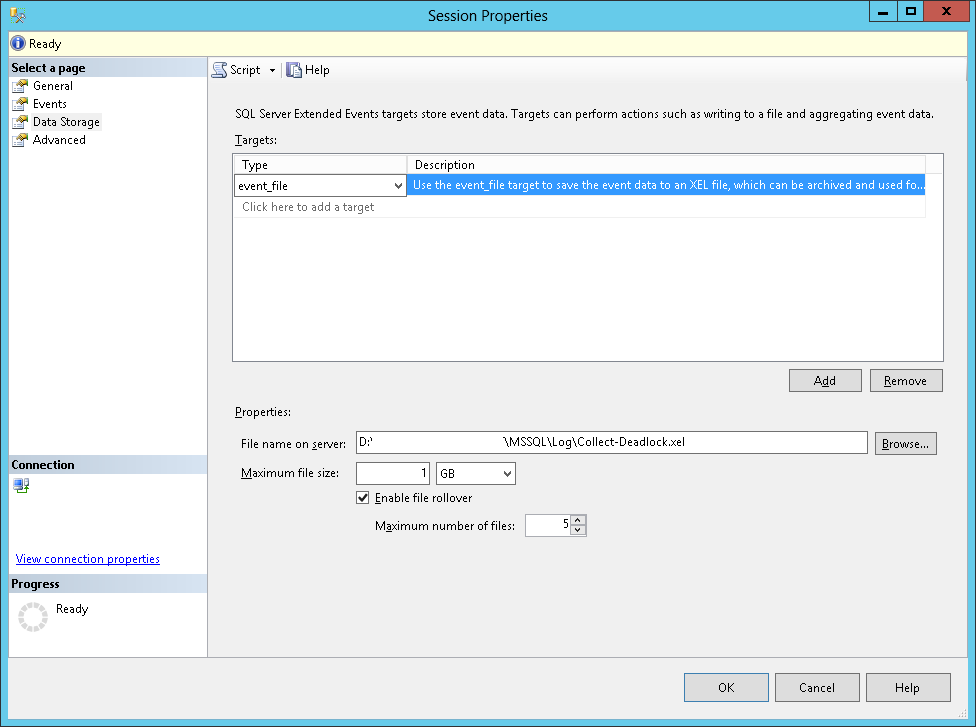
Once we are done with this part, we can go to the Data Storage page and tell SQL Server where to store results. Generally, we will take a file as output.
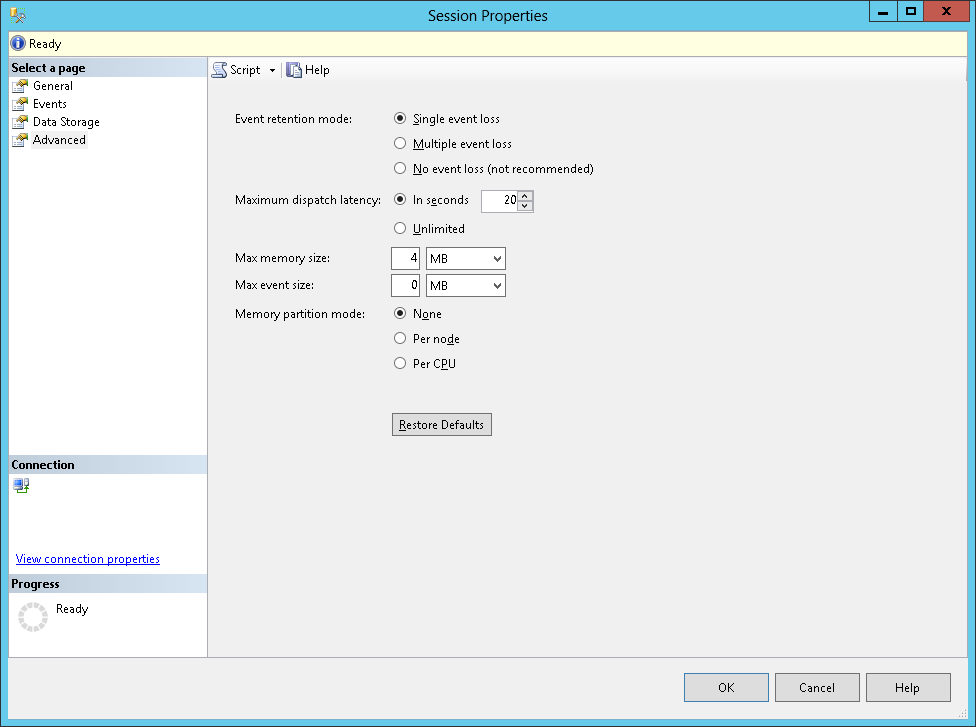
Finally, we can review advanced settings for this Extended Events Session.
Then, click OK.
Here is the equivalent T-SQL script for creating Collect-Deadlock event:
|
1 2 3 4 5 6 7 8 9 10 11 12 13 14 15 16 17 18 19 20 21 22 23 24 25 26 |
CREATE EVENT SESSION [Collect-Deadlock] ON SERVER ADD EVENT sqlserver.xml_deadlock_report( ACTION( package0.collect_system_time, sqlos.task_time, sqlserver.client_app_name, sqlserver.client_hostname, sqlserver.database_id, sqlserver.is_system, sqlserver.username ) ) ADD TARGET package0.event_file( SET filename=N'D:\MSSQL11.JELSQL2K12T\MSSQL\Log\Collect-Deadlock.xel' ) WITH ( MAX_MEMORY=4096 KB, EVENT_RETENTION_MODE=ALLOW_SINGLE_EVENT_LOSS, MAX_DISPATCH_LATENCY=20 SECONDS, MAX_EVENT_SIZE=0 KB, MEMORY_PARTITION_MODE=NONE, TRACK_CAUSALITY=OFF, STARTUP_STATE=ON ) ; |
For this solution to be working on SQL Server versions prior to SQL Server 2012, we need to change
|
1 2 3 |
ADD TARGET package0.event_file( |
By
|
1 2 3 |
ADD TARGET package0.asynchronous_file_target( |
In some versions of SQL Server, the sys.fn_xe_file_target_read_file function needs its caller to provide the non-null value for second parameter. This parameter refers to the path to a description file with an XEM extension. We can actually modify target definition so that it looks like this:
|
1 2 3 4 5 6 |
ADD TARGET package0.event_file( SET filename=N'D:\MSSQL11.JELSQL2K12T\MSSQL\Log\Collect-Deadlock.xel', METADATAFILE = N'D:\MSSQL11.JELSQL2K12T\MSSQL\Log\Collect-Deadlock.xem' ) |
Which gives for SQL Server 2008 and 2008 R2:
|
1 2 3 4 5 6 7 8 9 10 11 12 13 14 15 16 17 18 19 20 21 22 23 24 25 26 27 |
CREATE EVENT SESSION [Collect-Deadlock] ON SERVER ADD EVENT sqlserver.xml_deadlock_report( ACTION( package0.collect_system_time, sqlos.task_time, sqlserver.client_app_name, sqlserver.client_hostname, sqlserver.database_id, sqlserver.is_system, sqlserver.username ) ) ADD TARGET package0.asynchronous_file_target( SET filename=N'D:\MSSQL11.JELSQL2K12T\MSSQL\Log\Collect-Deadlock.xel', METADATAFILE = N'D:\MSSQL11.JELSQL2K12T\MSSQL\Log\Collect-Deadlock.xem' ) WITH ( MAX_MEMORY=4096 KB, EVENT_RETENTION_MODE=ALLOW_SINGLE_EVENT_LOSS, MAX_DISPATCH_LATENCY=20 SECONDS, MAX_EVENT_SIZE=0 KB, MEMORY_PARTITION_MODE=NONE, TRACK_CAUSALITY=OFF, STARTUP_STATE=ON ) ; |
Now, let’s review some operations on this event.
To prevent an Extended event from running, run following queries:
|
1 2 3 4 5 6 |
ALTER EVENT SESSION [Collect-Deadlock] ON SERVER WITH (STARTUP_STATE = OFF); ALTER EVENT SESSION [Collect-Deadlock] ON SERVER STATE = STOP; |
To set it back to a running state, run following query:
|
1 2 3 |
ALTER EVENT SESSION [Collect-Deadlock] ON SERVER STATE = START; |
And to completely drop the event session:
|
1 2 3 |
DROP EVENT SESSION [Collect-Deadlock] ON SERVER ; |
I would recommend using this option over option #3 because it takes a lot less time to get simple information using the previous query. As an example, on my test server, in order to get one row from system_health, it took more than 15 seconds while it took less than one seconds with this solution.
Plus, a really cool thing about this option is that when I created this session, it took back deadlocks that occurred prior to its creation.
Additional words on Extended Events collections
Pay attention to time formats
From my experiments, we must be careful when we want to collect data from Extended Events based on ring_buffer and we want to filter out (or simply display) timing information.
Actually, this information is stored in UTC format and we need to convert it to local time before using it.
I tried to transform this format using following piece of code:
|
1 2 3 4 5 6 |
CONVERT(datetime, SWITCHOFFSET(CONVERT(datetimeoffset, <My_DateStamp>), DATENAME(TzOffset, SYSDATETIMEOFFSET())) ) |
OR
|
1 2 3 |
SELECT DATEADD(hh,DATEDIFF(hh,GETUTCDATE(),GETDATE()),<MyDateStamp>) AS currentLocalTime; |
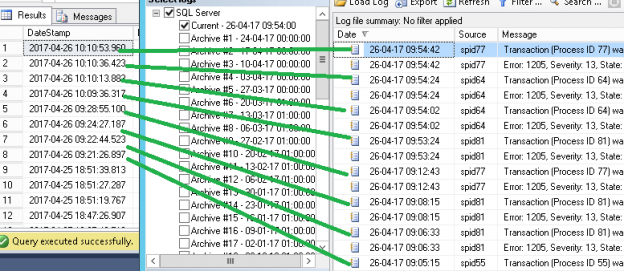
But I don’t get the actual time as you will see in following screen capture. On left side, there is the ordered DateStamp results from query presented above to get back deadlock information. On the right side, the results of the option 1 (Trace flags).

Note: There is an open bug on Microsoft Connect regarding datetime differences.
A simple information collection method is available on SQLShack
No matter if you take deadlock information from system_health or from an homemade event session, you can refer to Musab Umair’s article entitled “Monitoring SQL Server Deadlocks – the easy way“. He defines a simple method to extract some deadlock information from extended event files.
Summary
Until now, we’ve seen what is a deadlock and how to collect information about them using multiple approaches. The following table summarizes what we could expect from each of these ways.
| Option# | Option Name | Works Prior to 2008 | Works prior to 2012 | Automated | Needs activation | Performance Impact |
Facilitated output analysis |
| 1 | Trace flags | X | X | – | X | X | |
| 2 | SQL Server Profiler and SQL Trace | X | X | – | X | X | X |
| 3 | Default Extended Events Session (system_health) | – | X | X | – | X | |
| 4 | Custom Extended Events Session | – | – | X | X |
In next article, we will have a closer look at what kind of reports we can perform in order to launch a chase against deadlock occurrences. We will also take a close look at the stored procedure used to get those reports.
Next articles in this series:
- How to report on SQL Server deadlock occurrences
- How to use SQL Server Extended Events to parse Deadlock XML and generate statistical reports
- How to automate SQL Server deadlock collection process using Extended Events and SQL Server Agent

I'm one of the rare guys out there who started to work as a DBA immediately after his graduation. So, I work at the university hospital of Liege since 2011. Initially involved in Oracle Database administration (which are still under my charge), I had the opportunity to learn and manage SQL Server instances in 2013. Since 2013, I've learned a lot about SQL Server in administration and development.
I like the job of DBA because you need to have a general knowledge in every field of IT. That's the reason why I won't stop learning (and share) the products of my learnings.
View all posts by Jefferson Elias
- How to perform a performance test against a SQL Server instance - September 14, 2018
- Concurrency problems – theory and experimentation in SQL Server - July 24, 2018
- How to link two SQL Server instances with Kerberos - July 5, 2018