

Performance monitoring is a must to do the task for a DBA. You should ensure that the database performance is optimal all the time without any impact on the databases. Performance issues act like an open stage, and you need to look at every aspect such as CPU, RAM, server performance, database performance, indexes, blocking, waits, and SQL Server deadlocks. You might face frequent deadlocks issues, and they have a direct impact on the application performance.
You can also go through these articles: SQL Server deadlock definition and Overview and What are SQL Server deadlocks and how to monitor them, to understand deadlock in SQL Server.
Let’s have a quick overview of “Deadlocks in SQL Server”. Later, we will cover how we can monitor deadlocks using the system_health extended event.
Introduction to SQL Server Deadlocks
SQL Server obtains locks on required resources to perform specific tasks such as Select, Insert, Update, Delete. It is normal behavior and helps to ensure the ACID properties (Atomicity- Consistency – Isolation – Durability).
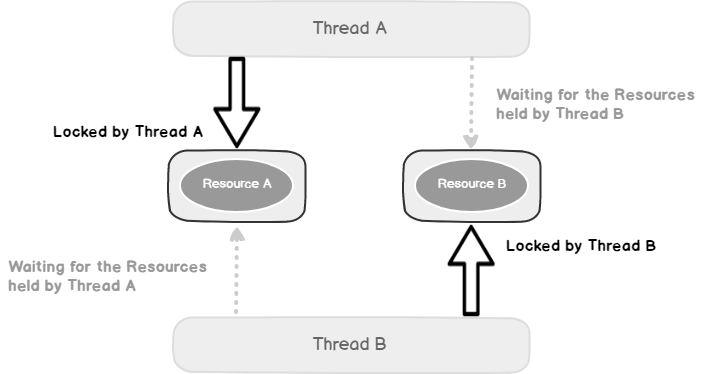
If two processes in SQL Server wants to have exclusive access to a resource held by the other process, it is called a deadlock situation.
In the following image, we can see that thread A is waiting for the resources held by thread B, and similarly, thread B is waiting for the resources held by thread A. Both the threads cannot process due to insufficient resources.
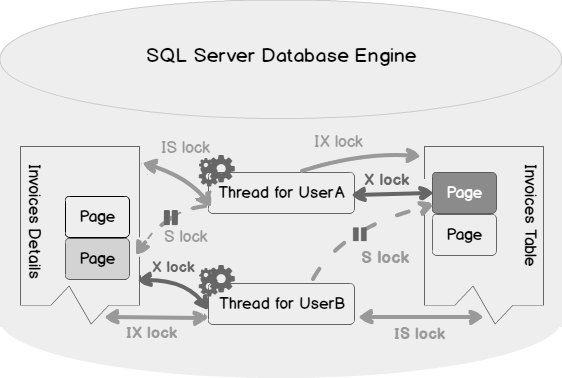
We can further understand the SQL Server deadlock scenario using the following image.
- User A: Intent Exclusive (IX) lock on the Invoice table and page it requires to modify
- User A also requires an Exclusive lock (X) on the row of the Invoice table
- User B wants to read the same data user A wants to update. It tries to place an Intent Shared lock on the Invoice table and shared lock on the page to read the data. It has to wait until the User A releases the Exclusive lock on the page
- User A also requires to read data from the Invoice Details page to complete the transaction, but that page has an Exclusive lock by the user B. This thread also needs to wait for the other transactions to complete
SQL Server automatically monitors the deadlocks every 5 seconds and kills a session so that another transaction can complete the work. The killed process is known as the Deadlock victim. It is essential to monitor this deadlock situation.
Usually, DBA enables the trace flag 1204 and 1222 to capture the deadlock information in the SQL Server error logs. Out of these two trace flags, the useful and recommended trace flag is 1222 as it returns the resources, their lock and deadlock information in an XML format.
Let’s enable these trace flags and simulate a SQL Server deadlock situation.
|
1 2 3 4 5 6 7 8 9 10 11 12 13 |
CREATE TABLE TestTable_1 (ID INT IDENTITY(1,1), Name VARCHAR(20)) GO CREATE TABLE TestTable_2 (ID INT IDENTITY(1,1), Name VARCHAR(20)) GO INSERT INTO TestTable_1(Name) VALUES ('Rajendra') Go 100 INSERT INTO TestTable_2(Name) VALUES ('Raj') Go 100 |
Let’s open two new query windows in the SSMS and execute the queries in the following order.
Session 1(Process ID 81) | Session 2 (Process ID 84) | ||
| |||
|
|||
| |||
|
|||
SQL Server chooses process Id 84 as the deadlock victim, and you get the following SQL Server deadlock message in the query window.

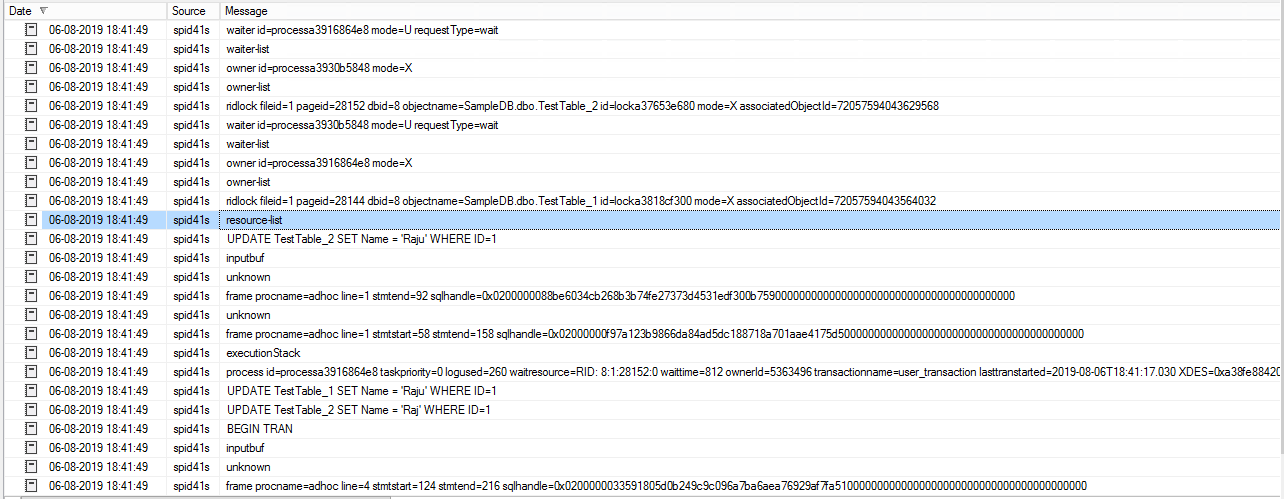
Open SQL Server Error Logs in SSMS, and you can see the details of both sessions and the deadlock victim.
We can add the trace flag in the startup parameters as well, but it will require restarting SQL Services. We might not want to do this, especially in a very high OLTP environment.
Execute the following query to turn off the trace flag 1222.
|
1 |
DBCC traceoff(1222,-1) |
Let’s look at another way of monitoring the deadlock in SQL Server without enabling the trace flags as well.
SQL Server Deadlock monitoring using the system_health extended event
In the article, Max Worker Threads for SQL Server Always on Availability Group databases, we explored the use of system_health extended event session for the SQL Server Always On Availability Group databases.
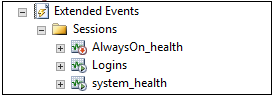
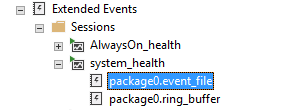
You can find the system_health extended event session in SQL Server. It is like a black box recorder that captures useful information and helps to troubleshoot the issues in SQL Server.
This extended event session has two targets. We will use the ring buffer as well to view the deadlock information. It holds data in memory. Double click on package0_event_file to open the extended event file.
In the event file viewer, right-click and set the filter to display the xml_deadlock_report. You can create additional filters such as date range. We are interested in this particular filter only for this demo.
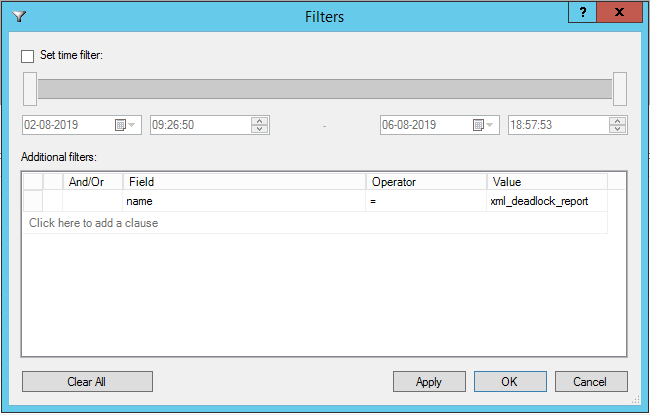
It shows the deadlocks occurred for the SQL instance.
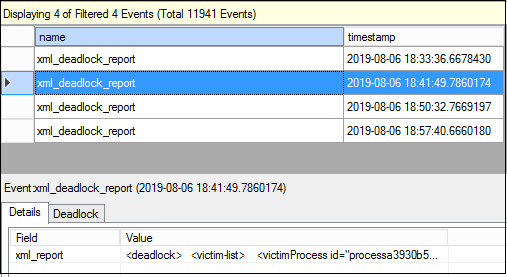
You get both the XML deadlock report and the SQL Server deadlock graph using this extended event.
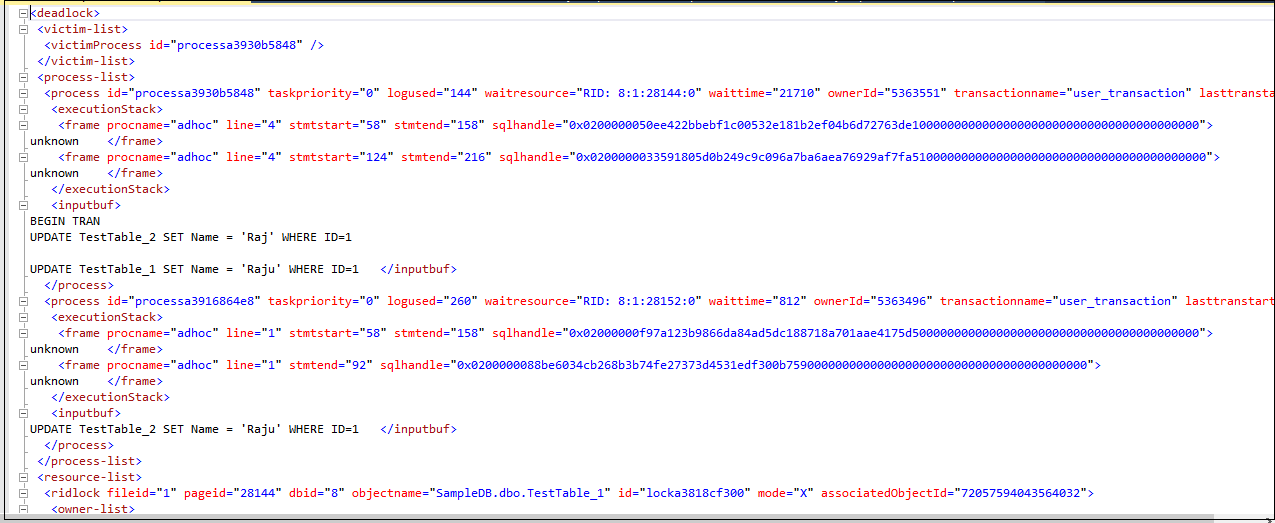
XML Deadlock Report: You can double click on the XML report value, and it opens the complete XML report in the new query window. It gives you complete information about the transactions, locks, deadlock victim and statements

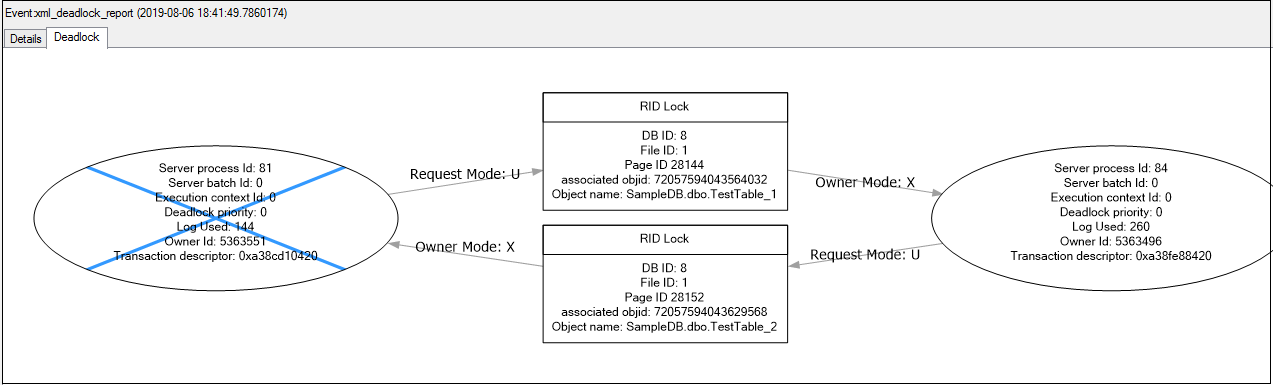
Deadlock Graph: Many times, we want to view the deadlock graph to get the details quickly in a graphical mode. Click on the Deadlock tab, and it shows the following deadlock graph for my demo
Deadlock graph is an excellent way to interpret the deadlock related information quickly and effectively.
These graphs come in handy when it is difficult for DBAs to understand the XML deadlock information.
We learned to get the deadlock information using the system_health extended events in a GUI mode. We can query an extended event file as well to get the deadlock information. We should be familiar with the script as well so that we can quickly retrieve information for the deadlock from the system_health event session.
Extract SQL Server Deadlock information using T-SQL from the ring buffer target
We can use the following query to extract information from the ring buffer target. In this query, you can see that we are querying the system_health extended event and the ring buffer target. In the XML output, we filter the ring buffer data using the event xm_deadlock _report.
|
1 2 3 4 5 6 7 8 9 10 11 12 13 |
SELECT XEvent.query('(event/data/value/deadlock)[1]') AS DeadlockGraph FROM ( SELECT XEvent.query('.') AS XEvent FROM ( SELECT CAST(target_data AS XML) AS TargetData FROM sys.dm_xe_session_targets st INNER JOIN sys.dm_xe_sessions s ON s.address = st.event_session_address WHERE s.NAME = 'system_health' AND st.target_name = 'ring_buffer' ) AS Data CROSS APPLY TargetData.nodes('RingBufferTarget/event[@name="xml_deadlock_report"]') AS XEventData(XEvent) ) AS source; |
Let’s execute this in my demo environment and it gives the following deadlock XML. You can click on the hyperlink to see the deadlock XML.

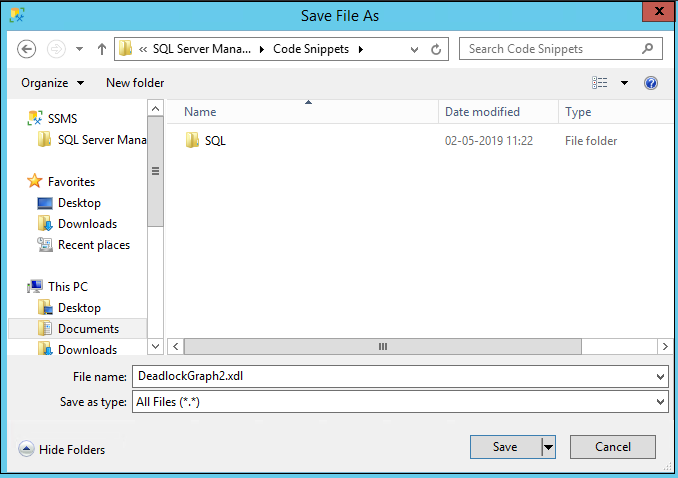
You can click on the SQL Server deadlock XML file and save it as .xdl extension. It converts the XML deadlock into a graphical format.
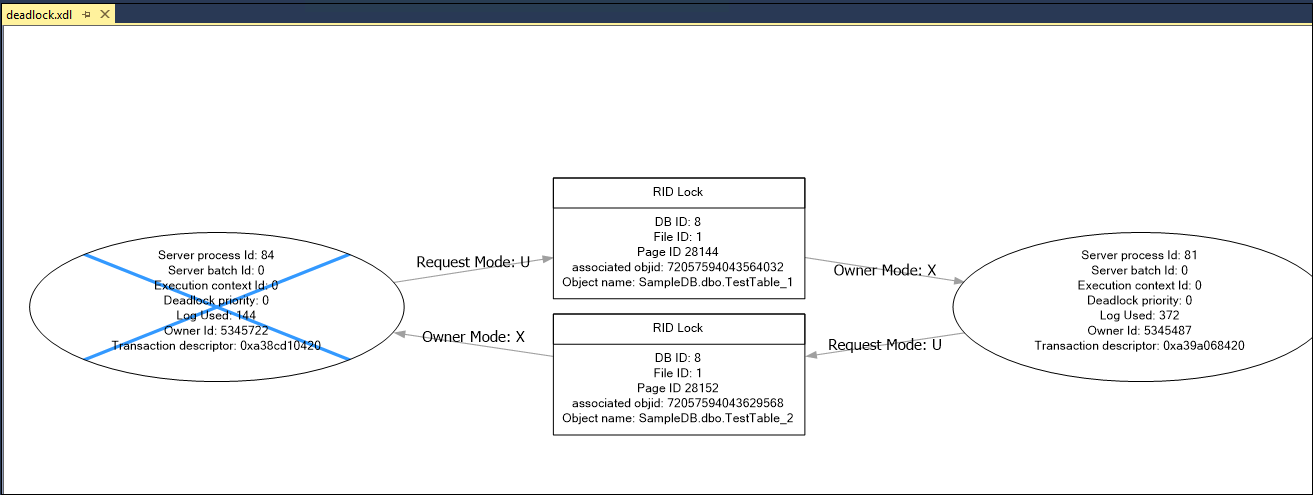
Once saved, you can open the .XDL file into the SSMS and view the deadlock graph.
Extract SQL Server Deadlock information using T-SQL from the ring buffer target
You can use the query as well to extract information from the extended event file. The benefit of using the extended event file for extracting information is that you get all deadlock information stored in the files. We can also change the size and number of extended event files to capture the more data while the ring buffer has limited data storage and works with the recent data.
System_health extended event files are stored in the log folder of the instance. We can easily capture the location of the log folder from the SQL Server error log.
In the following query, we first use a temporary table to fetch and store the log file information and stored it into a @PATH variable.
Later, we use sys.fn_xe_file_target_read_file to read the extended event file. We need to provide the path of the extended event session file. We will pass the variable in this command to retrieve the relevant information.
sys.fn_xe_file_target_read_file ( path, mdpath, initial_file_name, initial_offset )
- Note: I do not recommend to use the GUI method to read the information if the size of the file is large. You might face issues like hung SSMS or time out while retrieving the information
|
1 2 3 4 5 6 7 8 9 10 11 12 13 14 15 16 17 18 |
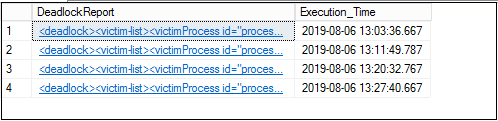
CREATE TABLE #errorlog ( LogDate DATETIME , ProcessInfo VARCHAR(100) , [Text] VARCHAR(MAX) ); DECLARE @tag VARCHAR (MAX) , @path VARCHAR(MAX); INSERT INTO #errorlog EXEC sp_readerrorlog; SELECT @tag = text FROM #errorlog WHERE [Text] LIKE 'Logging%MSSQL\Log%'; DROP TABLE #errorlog; SET @path = SUBSTRING(@tag, 38, CHARINDEX('MSSQL\Log', @tag) - 29); SELECT CONVERT(xml, event_data).query('/event/data/value/child::*') AS DeadlockReport, CONVERT(xml, event_data).value('(event[@name="xml_deadlock_report"]/@timestamp)[1]', 'datetime') AS Execution_Time FROM sys.fn_xe_file_target_read_file(@path + '\system_health*.xel', NULL, NULL, NULL) WHERE OBJECT_NAME like 'xml_deadlock_report'; |
Execute this query, and you get the following deadlock information. You can click on each deadlock report and view the XML information. Save the required XML deadlock report in XSD format, and it gives the graphical execution plan after performing steps similar to mentioned above.
Conclusion
This article explained the process to retrieve the SQL Server deadlock information using the default system_health extended event session. You may consider it as a black box recorder to track the SQL instance activities. We do not need to enable trace flags 1204 and 1222 to capture the deadlocks using this extended event session.

I am the author of the book "DP-300 Administering Relational Database on Microsoft Azure". I published more than 650 technical articles on MSSQLTips, SQLShack, Quest, CodingSight, and SeveralNines.
I am the creator of one of the biggest free online collections of articles on a single topic, with his 50-part series on SQL Server Always On Availability Groups.
Based on my contribution to the SQL Server community, I have been recognized as the prestigious Best Author of the Year continuously in 2019, 2020, and 2021 (2nd Rank) at SQLShack and the MSSQLTIPS champions award in 2020.
Personal Blog: https://www.dbblogger.com
I am always interested in new challenges so if you need consulting help, reach me at rajendra.gupta16@gmail.com
View all posts by Rajendra Gupta
- Understanding PostgreSQL SUBSTRING function - September 21, 2024
- How to install PostgreSQL on Ubuntu - July 13, 2023
- How to use the CROSSTAB function in PostgreSQL - February 17, 2023