

The goal of this article is to get familiar with SQL Server monitoring tools and identify what some of the most common SQL Server performance problems are.
Dealing with performance problems is not an easy task but it all comes down to I/O, CPU, memory, or concurrency related stuff. SQL Server monitoring tools can help us paint the big picture. It’s all about identifying which one of these is causing the problem. A lot of times it can be a combination of two or more, or it could look like one but it’s actually other.
Let’s start by mentioning some of the common performance issues:
- High I/O during peak or maintenance times
- Memory pressure slowing down queries
- CPU pressure slowing down database server
- Concurrency issue from locking/blocking
High input/output represents disk subsystems doing too much work. Particularly during peak or maintenance times. Input/output bottlenecks can be the hardest to troubleshoot because they are usually manifested from memory or CPU issues. Furthermore, they can be also manifested from poorly written queries and not having a good indexing strategy.
How that we’ve mentioned indexing strategy, this is a big piece of the puzzle that cannot be achieved easily. But here’s an article that you will hopefully find informative and useful: SQL index maintenance
Bear in mind that proper indexing and query tuning can have a significant impact on all areas of SQL Server performance.
All these factors are a good reason why it’s a good idea to look at I/O last, even though it first in the list, just to rule out any other things that can cause I/O problems.
Memory pressure can simply become an issue when the system doesn’t have enough RAM of SQL Server cannot allocate enough memory or more commonly poor database and query design. Lack of memory can also be caused by high I/O. Yeah right, it goes both ways. This is, again, why it can get tricky when troubleshooting SQL Server performance.
The general rule of thumb between these two is that memory pressure happens randomly for example when a raw query is pulling out all the data in a table and sucks up all the SQL Server memory. High I/O is happening at specific times. You can usually tell for example if every day at 3 PM the SQL Server comes to its knees, then you most likely have an I/O issue rather than a memory issue.
CPU pressure can come from a variety of things but generally, it’s come from expensive queries or external factors. First, you should deal with external stuff. This can be an application running on the database server that is sucking up all resources. But, as before, CPU pressures can also cause high I/O.
Last but not least, concurrency can cause performance issues but this is a tough nut to crack. Because even if the I/O, memory, and CPU levels are normal, you can still have people complaining about waiting and slowdowns in an application, then it’s probably coming from locking and blocking issue.
Bottom line is to get the big picture, we need to take all the above factors into account when troubleshooting performance issues. To achieve this, we got a lot of SQL Server monitoring tools.
Some of the common tools for performance monitoring are:
- Dynamic Management Views
- Performance monitor
- Extended events
- Execution plans
- Data collector
- Resource governor
We got a lot of DMVs as part of SQL Server monitoring tools for troubleshooting all common performance issues and we will be looking into some of them later in this article. We will also look at Performance monitor and the most popular counters used for identifying common I/O performance issues. Extended events profile is used for logging all the information within SQL Server. Execution plans are also very imported along with the database engine tuning advisor to help us out with query optimization and fine-tuning. The data collector can be used to monitor performance and SQL Server has its own data collector as well that compiles performance statistics. Lastly, we got a Resource governor which is good for controlling resources at the SQL Server level.
For more information about Query optimization, see the SQL Query Optimization — How to Determine When and If It’s Needed article
A lot of the times when troubleshooting performance problems, we can’t just use one of the SQL Server monitoring tools. Those tools represent an ecosystem and we’re going to need many tools combined to paint the big picture. Understanding how each of the tools work will go a long way when it comes to solving performance issues.
Let’s head over to SSMS and see how we can identify common I/O performance problems by using some of the stuff mentioned above.
To kick off, we are going to see how we can simulate writes/reads and use the most common DVMs to pull out some useful information from SQL Server. But before we continue, one other very important thing when troubleshooting almost anything is to have baselines. This will provide you with a minimum or starting point used for comparisons. In other words, having a baseline will give us an insight into what’s normal. To obtain this, we’d have to break out multiple SQL Server monitoring tools like performance monitor, extended events, etc. Gather data, for example, on a slow day and that’s how you’ll know what normal is. Ultimately, this will make it a lot easier to find out what abnormal is.
Moving on, some of the symptoms of the problem with I/O are:
- High amount of I/O wait types
- Performance decrease during specific times
- Excessive disk latency
- I/O warning is SQL Server error logs
Useful DMVs in cases above that can help us identify bottlenecks with I/O are:
There are many wait stats in SQL Server and there is some great documentation online, but a list of most commonly encountered types and steps that should be taken for more serious troubleshooting can be found here: SQL Server wait types
Every time a thread executes and waits on e.g. disk, CPU, query, etc. it all gets stored inside these statistics. Furthermore, we have the waiting tasks that return information about the wait queue of tasks in real-time of anything currently waiting. Finally, we got virtual file stats that returns I/O statistics for data and log files. So, let’s fire up SSMS and see view overall stats by executing the query from below:
|
1 2 3 |
SELECT * FROM sys.dm_os_wait_stats dows ORDER BY dows.wait_time_ms DESC; |
The result of this query will be a running total of any time a thread waited on something:
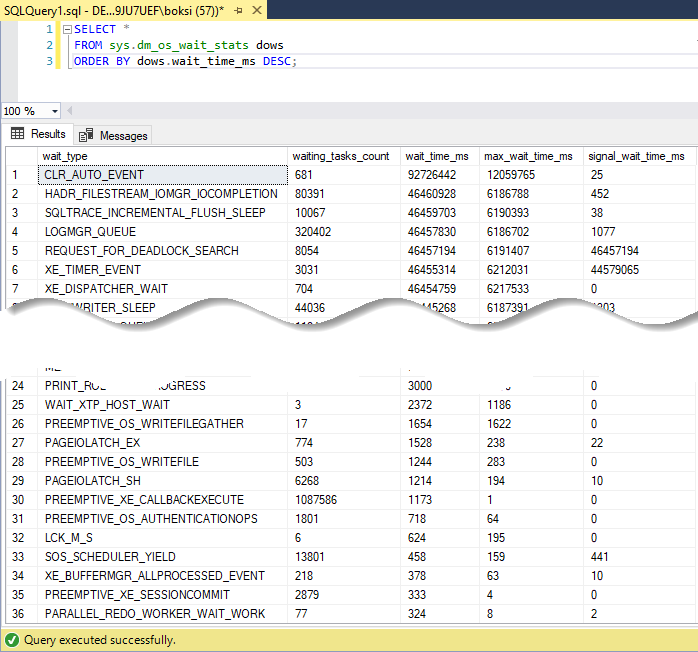
Note in the status bar, that 875 rows are returned. This means that there are so many different categories AKA wait types in SQL Server. The total number may vary depending on the SQL Server version:

Essentially, what you should look for among these wait types when troubleshooting I/O is anything that starts with PAGEIOLATCH. Anything with this in front simply means that there is a delay when writing to the physical database files.
Next, we can execute another query to see the current task waits:
|
1 2 3 |
SELECT * FROM sys.dm_os_waiting_tasks dowt WHERE dowt.wait_type LIKE 'PAGEIOLATCH%'; |
This query returns the current task that currently have a specific wait type. The example above will return something when a task is waiting on a latch for a buffer that is in an I/O request. Mine returned nothing.
To view I/O latency stats by database/files execute the following query:
|
1 2 3 |
SELECT * FROM sys.dm_io_virtual_file_stats(DB_ID('AdventureWorks2014'), NULL) divfs ORDER BY divfs.io_stall DESC; |
To return latency statistics for all databases, feel free to pass null instead of the database name. But ultimately, the query returns I/O statistics for data and log files:
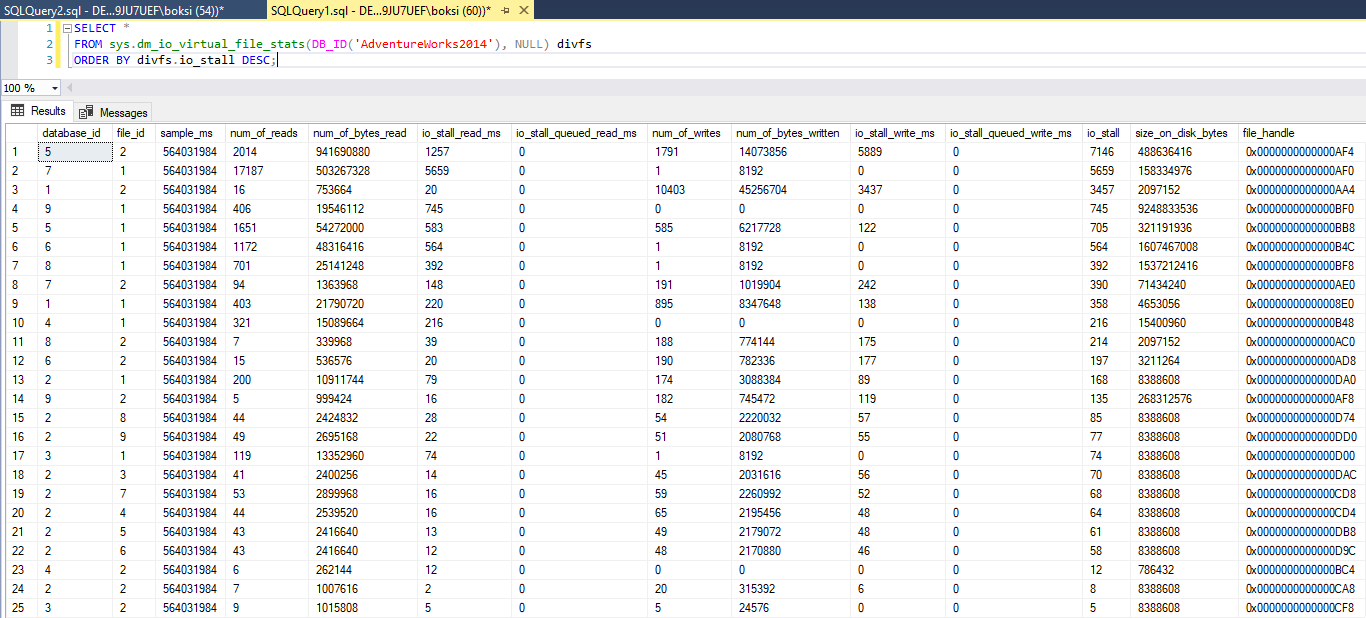
Those latencies statistics will be broken down by file and you’ll notice that the result is ordered by a column called “io_stall”. This is a great column because it tells us how long a user waited for the data to be written to that file in milliseconds. So, this could be a good indication if we previously set our baselines here and we notice that some stalls are higher than usual, then this could be an indication that a disk has too much activity on it or maybe it needs to be upgraded.
Moving on, let’s look at some of the performance counters that we can use to troubleshoot I/O. When you use any SQL Server monitoring tool like for example Performance Monitor, you’ll probably see stuff like Logical/Physical Disk Avg. Disk sec/read/write/transfer counters. Logical and physical are separate categories and both need to be tracked. Physical refers to an actual physical HDD or SSD (or array in a hardware RAID setup), whereas logical refers to a volume that has been created on that disk. Read, write, and transfer counters measure the time needed in milliseconds for an I/O request to be serviced by either logical or physical request. Preferably, this value should be less than 10ms, between 10 and 15 is acceptable and more than 15 should be troubleshoot. Furthermore, if the idle time is constantly less than 50% meaning that our disks are always busy then we may have to look at that as well.
We have two useful SQL Server monitoring tools or metrics that are simple counters we can use in this category and those are full scans and index searches. Those will give us insight into how much extra I/O is occurring because of the lack of indexes or poor indexing strategy. In practice, if full scans per second are high then we should troubleshoot using the Database Engine Tuning Advisor to get some index suggestions. On the other side, if index searches are low then we should troubleshoot again because it’s an indication that the indexing strategy is not working out.
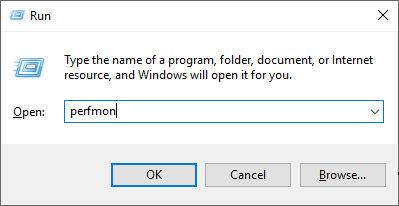
If your SQL Server is suddenly slower than you remember, one of the best SQL Server monitoring tools is actually the Performance Monitor on Windows that can be used to get to the bottom of the issue. Let’s fire up this bad boy and see how we can work with some of the counters mentioned before. Use the Windows key + R keyboard shortcut to open the Run command, type “perfmon”, and click OK to open:
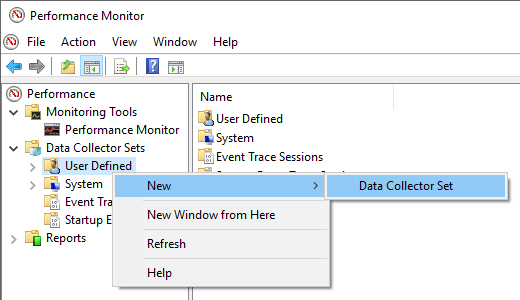
When you first open this SQL Server monitoring tool, it’ll open in the main page with a classic overview where we can watch counters. What I like to do is to create a custom Data Collector Set which is how we can create custom sets holding performance counters and alerts based on specific criteria. Let’s quickly create a custom Data Collector Set just to walk you through all the steps in the wizard and to see how to collect specific performance information.
Expand Data Collector Sets, right-click User Defined, select New, and then click Data Collector Set:
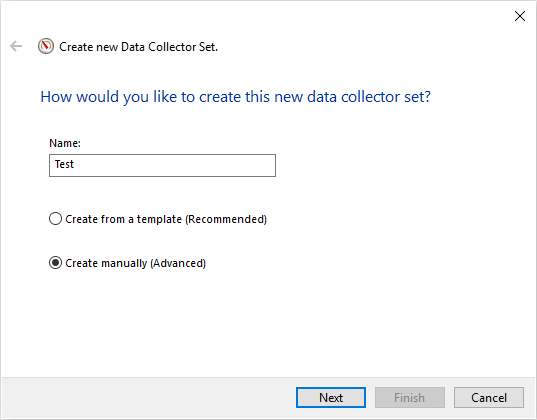
Give this new data collector a name, we don’t want to create it from a template, so change to option to Create manually (Advanced) and click Next:
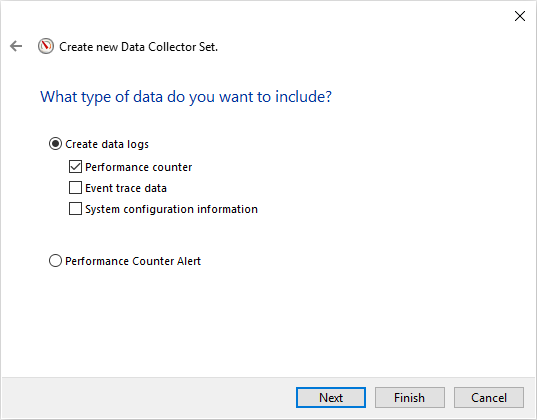
As for the data type, we want to track performance counters so check the Performance counter option and click Next:
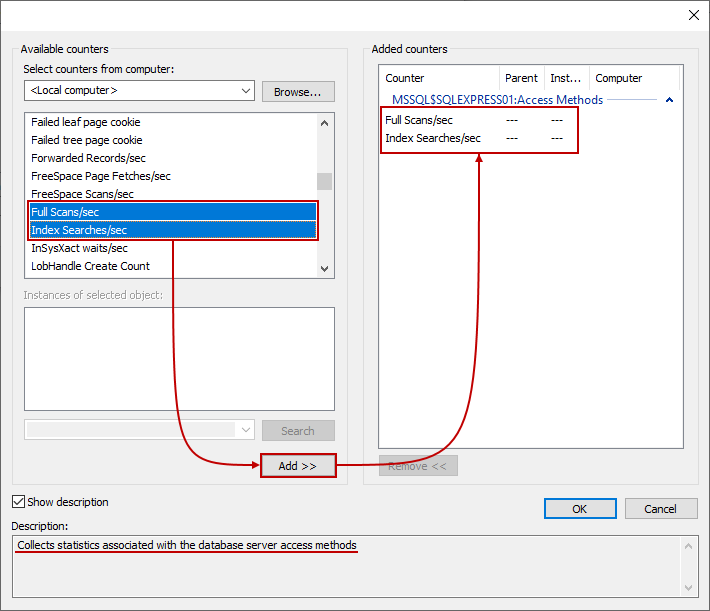
Next, the wizard will ask you which performance counters you would like to log. Counters can be added by simply clicking the Add… option and locating them in the list. For example, we can locate SQLServer:Access Methods, expand it to find Full Scans/sec and Index Searches/sec counters. You can select multiple counters by holding the Shift key and then just click the Add >> button to add them. Also, if you need additional info about any specific counter, just check the Show description option and it will give you additional description which is useful. Once everything is done, click the OK to close the dialog:
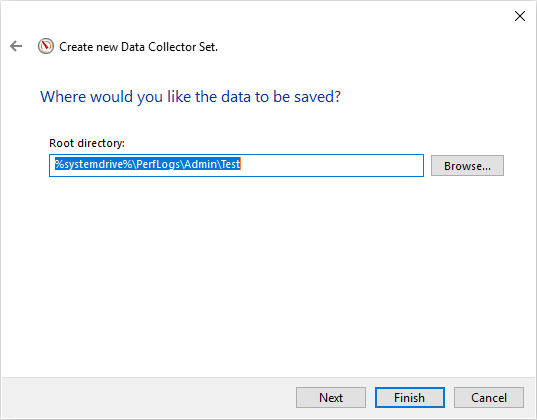
Hit Next two times, then Finish and the wizard will create the custom data collector set:
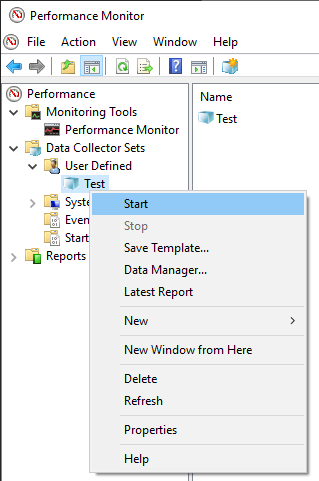
Once you completed all these steps, you can right-click newly created data collector set under User Defined category, and click Start to run it or Stop to shut it down:
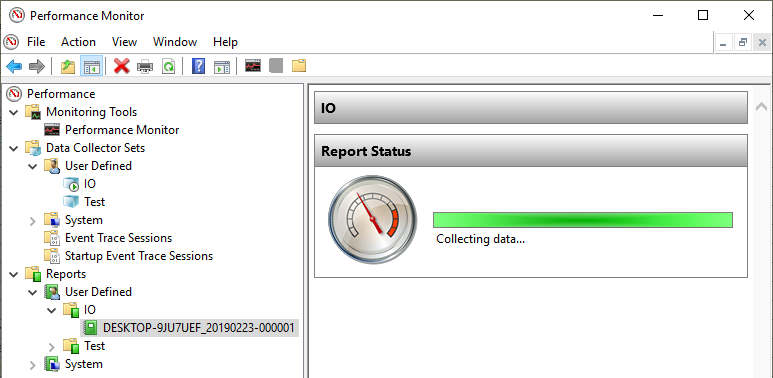
I’ve already preconfigured one for monitoring disks I/O activity in real-time. I’ve also started it and let it collect data for a while to collect data. This can be seen under Reports folder, User Defined category:
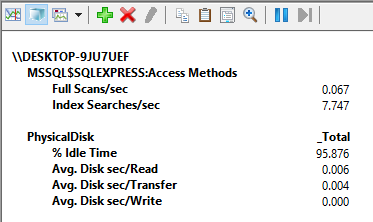
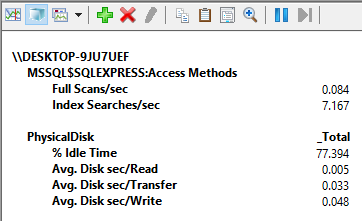
Once the data has been captured for the desired period, stop the data collector set. This will create an instant report and here’s what it looks like:
This local system that I’m using daily is configured pretty good. This is not because I’m an expert or anything, it’s simply because even though I have several SQL Server versions installed, there’s not much happening on them except for me testing them occasionally.
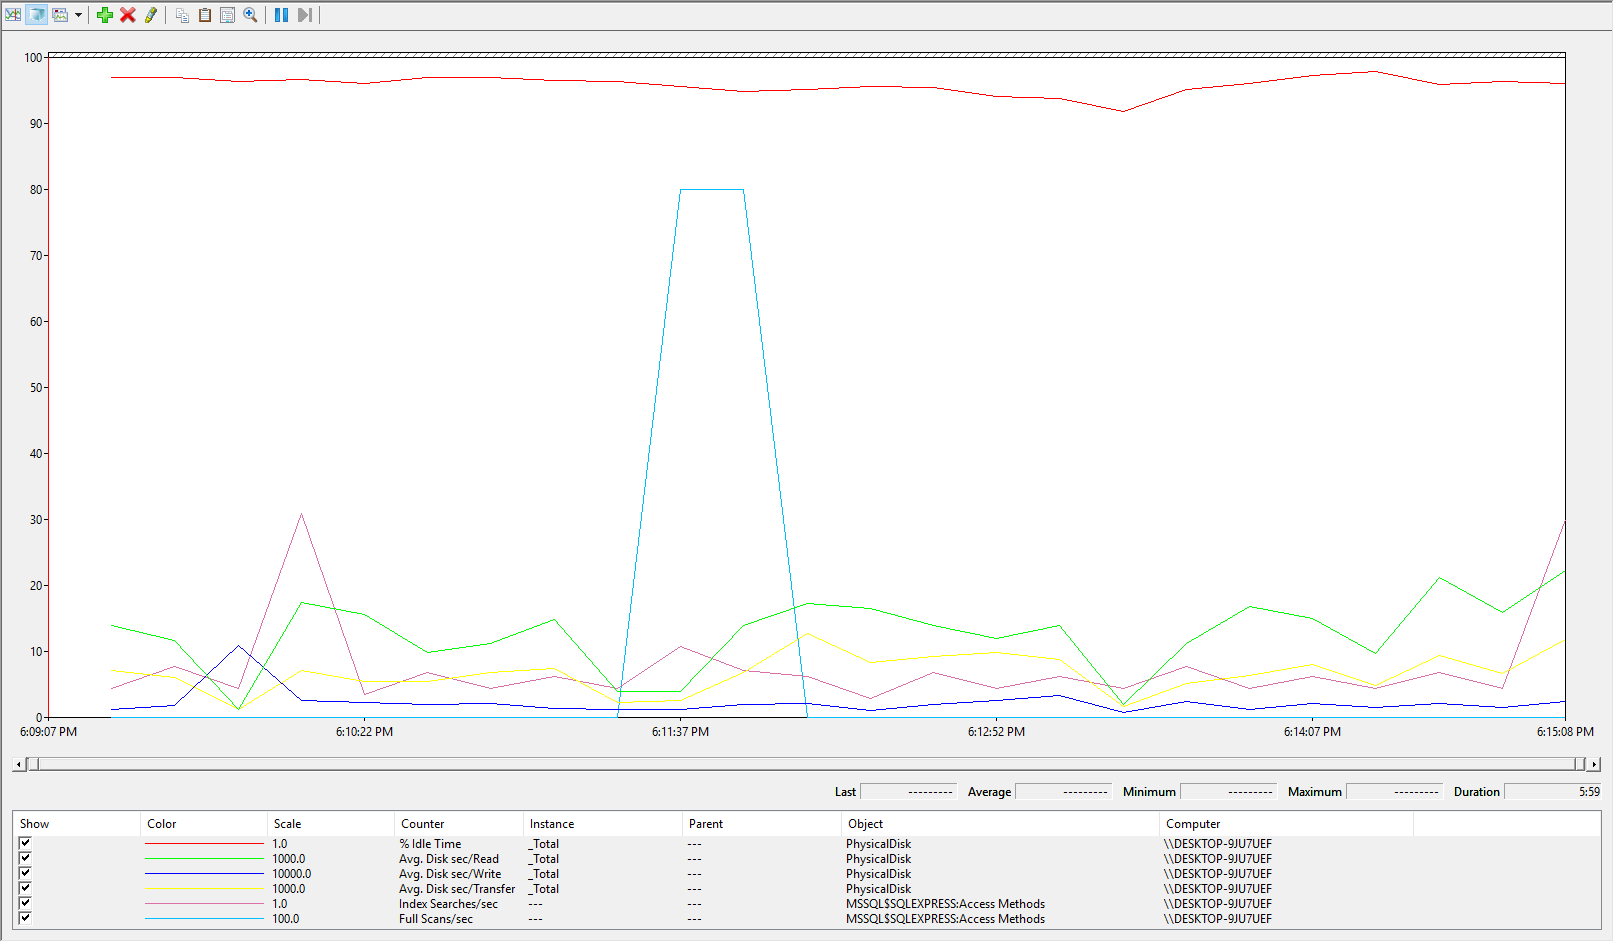
To toggle through different graph types, use the change graph type option to the left of the plus sign (+) or press Ctrl+G on your keyboard. It’s easy to consume this and if we look at the report everything is in the ranges where it needs to be:
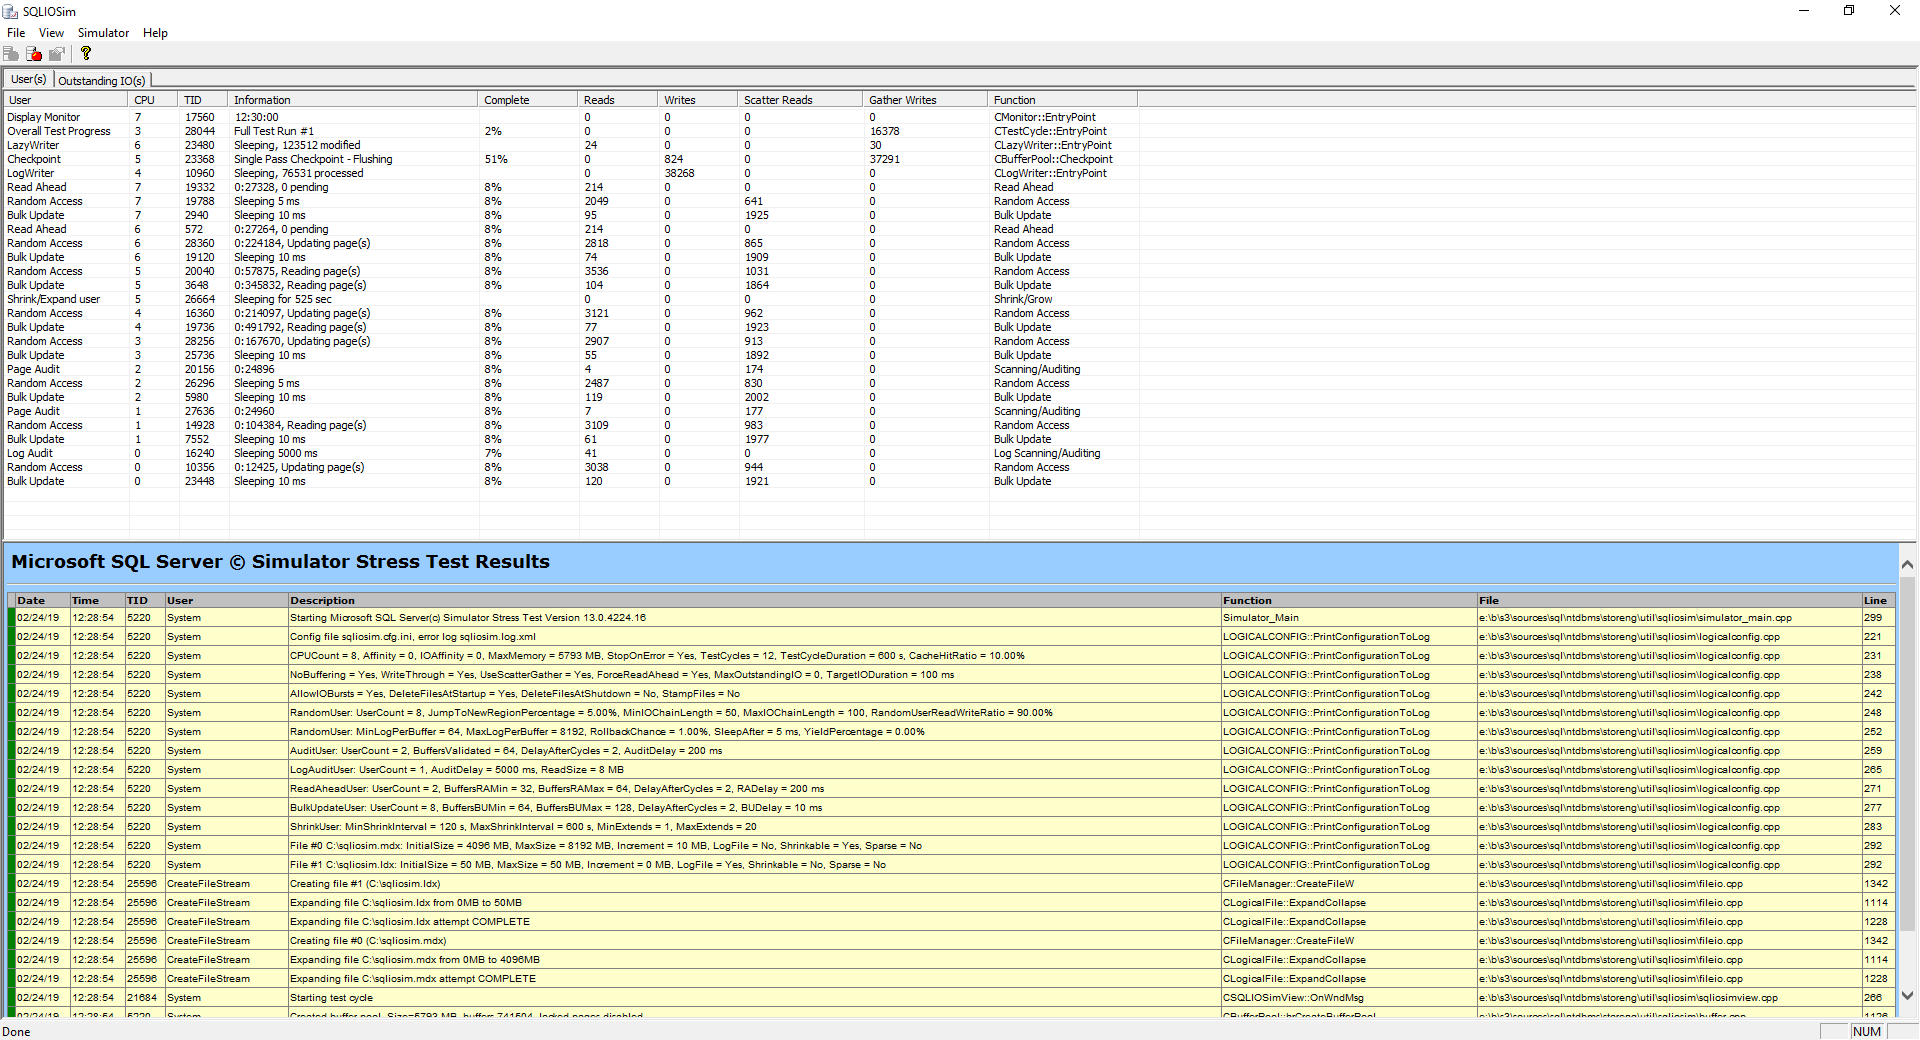
As we stated before, the idle time is good and if you remember value below 50% is bad anything above is good, over 85% is the expected value. All overall rate of reading/transferring/writing operations on the disk are below 0.010 (10ms) which is also good. This picture is as good as it gets as far as performance goes on a system, but this example is artificial on a local machine where almost nothing is happening. So, I’m going to fire up a simulation utility that can be used to perform reliability and integrity tests on the disk subsystem. This is another great SQL Server monitoring tool that is shipped within SQL Server. It’s called SQLIOSim and it basically simulates read, write, checkpoint, backup, sort, and read-ahead activities for SQL Server.
Before I do that, let’s start the I/O data collector set again. As mentioned above, the SQL Server monitoring tool is available right out-of-the-box. So, we just need to locate the SQLIOSIM.EXE program inside the Binn instance folder on SQL Server file system, in my case with SQL Server 2016 it’s:
C:\Program Files\Microsoft SQL Server\MSSQL13.SQLEXPRESS\MSSQL\Binn
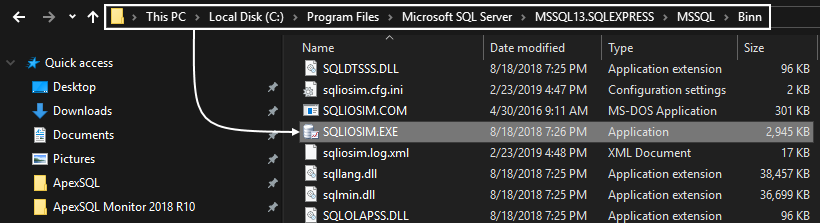
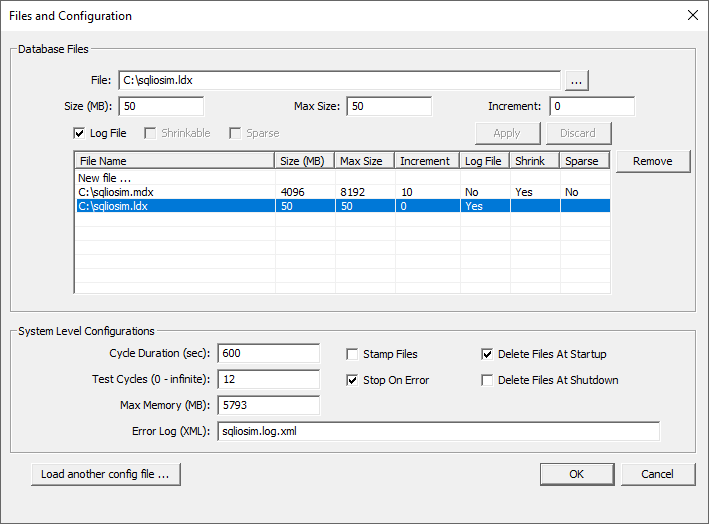
Run this tool as administrator just so you don’t encounter any errors due to missing privileges. Once the tool is run, it will pop-up the files and configuration dialog. I’ve already preconfigured this. Basically, there’re two files on which SQL Server will read and write to. The sqliosim.ldx is our log file:
And the sqliosim.mdx file is going to pretend to be our primary database data file:
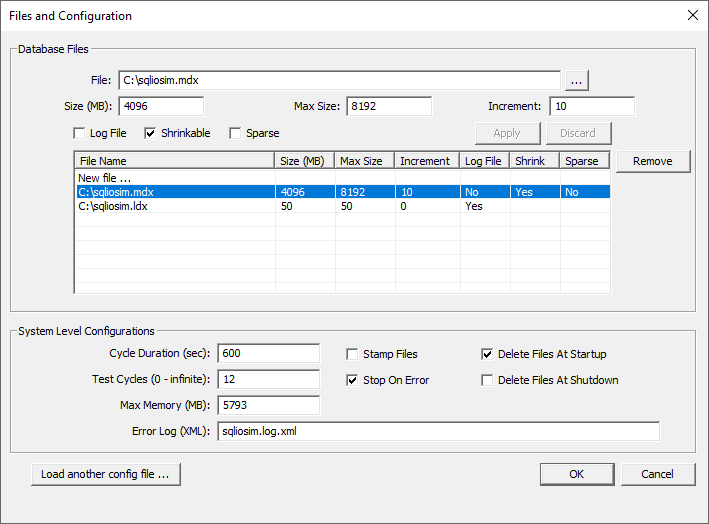
Once again, this is a great SQL Server monitoring tool for discovering what your I/O subsystem can handle. Once the configuration is done, just hit the OK to close the dialog and in the top left you’ll see a small green icon that is a start button:
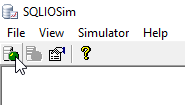
So, while this SQL Server monitoring tool simulates SQL Server activity on a disk subsystem the I/O data collector set will monitor activity in the background:
It goes without saying, don’t just run this on your production server because you might get in trouble. However, if things get crazy, you can always stop the stress test by hitting the stop icon:

I’ve stopped this after about 5 minutes and here’s how the new report looks like:
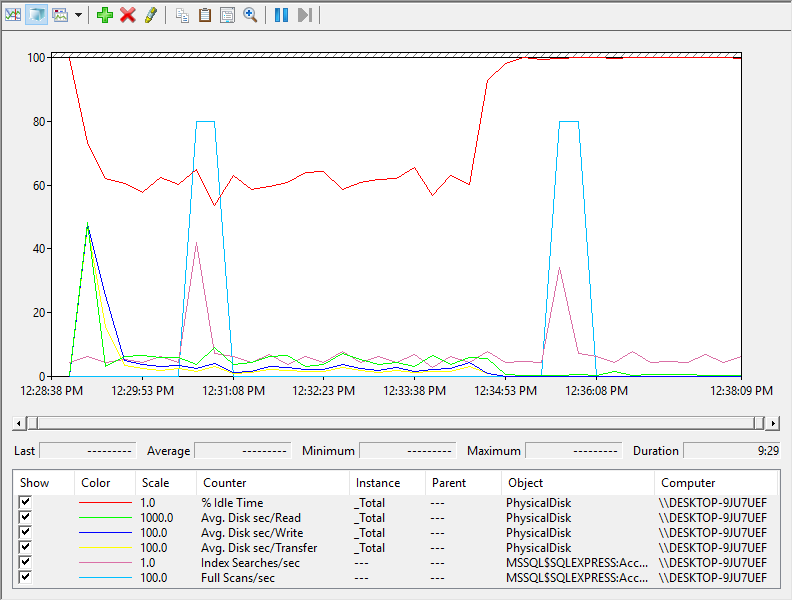
It’s obvious that the results are much different and if we switch over to report graph type here’s what we get:
The idle time is still above 50% which is acceptable. Reads are also okay, but transfers and writes are not. Now obviously the SQLIOSim utility is meant to generate a heavy load but if we are about to run this data collector set on a production environment over a day or two and we get results like this, then this would definitely be a cause for concern.
The bottom line here is that those counters are great for an indication of how your I/O disk subsystems perform.
I highly suggest taking a look at another article written about the most important disk performance metrics as it describes the counters we have been using through this article in details: SQL Server disk performance metrics – Part 1 – the most important disk performance metrics
I haven’t even touched common performance issues other than I/O, and this turned out to be a long article. Therefore, I’m going to draw a line here, and we will continue the SQL Server monitoring tools story in another article in which we will go through the rest of the list and talk about memory pressures.
Table of contents
| SQL Server monitoring tools for disk I/O performance |
| SQL Server monitoring tools for memory performance |
| SQL Server monitoring tool for CPU performance |

He has written extensively on both the SQL Shack and the ApexSQL Solution Center, on topics ranging from client technologies like 4K resolution and theming, error handling to index strategies, and performance monitoring.
Bojan works at ApexSQL in Nis, Serbia as an integral part of the team focusing on designing, developing, and testing the next generation of database tools including MySQL and SQL Server, and both stand-alone tools and integrations into Visual Studio, SSMS, and VSCode.
See more about Bojan at LinkedIn
View all posts by Bojan Petrovic
- Visual Studio Code for MySQL and MariaDB development - August 13, 2020
- SQL UPDATE syntax explained - July 10, 2020
- CREATE VIEW SQL: Working with indexed views in SQL Server - March 24, 2020