
Memory pressure slowing down queries
This article is the sequel in a series about SQL Server monitoring tools and common performance issues. The first article SQL Server monitoring tools for disk I/O performance is about how to detect and solve high input/output on hard disk subsystems when doing too much work during peak or maintenance times.
This article can be read independently but to get the full picture it’s recommended that part one is read first. Also, because issues described with the disk I/O performance can be manifested from memory issues. Therefore, feel free to check out initial write-up at the following link: SQL Server monitoring tools for disk I/O performance
One of the obvious problems with memory that doesn’t really require any SQL Server monitoring tool to be detected is when the system simply doesn’t have enough random-access memory AKA RAM. In such cases, memory pressure can occur because SQL Server simply cannot allocate enough memory.
Hopefully, this will be a short article rather than a long one like I did with disk I/O performance but this stuff is essential to get the complete picture and take all things into account when troubleshooting performace issues. If you’ve troubleshooted memory issue before, then you probably encountered some of the symptoms like system wide performance decrease and I/O increase.
Tools for performance monitoring
Dynamic management views
So, let’s get started with the Dynamic Management Views AKA DMVs. Most of you knows what DMVs are, but for those who doesn’t, DMVs are views and functions that return server state information which can be used to monitor the health of a server instance, diagnose problems, etc.
The three commonly used DMVs in SQL Server for memory performance are:
Let’s fire up SSMS and execute some queries, see what those DMVs will return. Use the code from bellow and execute it:
|
1 2 3 4 5 |
SELECT dosi.physical_memory_kb, dosi.virtual_memory_kb, dosi.committed_kb, dosi.committed_target_kb FROM sys.dm_os_sys_info dosi; |
This will return set of useful information about the machine:
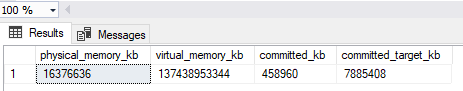
- physical_memory_kb – total amount of physical memory on the machine
- virtual_memory_kb – total amount of virtual address space available to the process in user mode
- committed_kb – committed memory in kilobytes (KB) in the memory manager
- committed_target_kb – amount of memory, in kilobytes (KB), that can be consumed by SQL Server memory manager
To view current system memory information, use the query below:
|
1 2 3 4 |
SELECT dosm.total_physical_memory_kb, dosm.available_physical_memory_kb, dosm.system_memory_state_desc FROM sys.dm_os_sys_memory dosm; |
This time, we actually got a friendly user message that available physical memory is high which is nice:
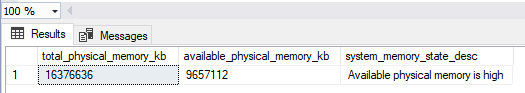
- total_physical_memory_kb – total amount of physical memory available to the operating system
- available_physical_memory_kb – total amount of physical memory available
- system_memory_state_desc – explanation of the memory state (Available physical memory high or low/Physical memory usage is steady/Physical memory state is transitioning)
The last one shows current SQL Server process memory:
|
1 2 3 4 |
SELECT dopm.physical_memory_in_use_kb, dopm.process_physical_memory_low, dopm.process_virtual_memory_low FROM sys.dm_os_process_memory dopm; |
This will return flags to let us know if physical and virtual process memory for SQL Server is low:
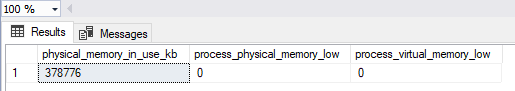
- physical_memory_in_use_kb – indicates the process working set in KB
- process_physical_memory_low – indicates that the process is responding to low physical memory notification
- process_virtual_memory_low – indicates that low virtual memory condition has been detected
If both flags are zero, you’re in good shape.
Data collector
Moving on, let’s take a look at some counters for performance monitoring and SQL Server monitoring tools that can be used to track them:
Memory available megabytes – this is just a great all around counter especially if we track it for a long time because we can find out what thresholds are for memory. The default memory threshold value is 100 MB.
SQLServer:Buffer Manager/Buffer cache hit ratio – this represents a percentage of how often SQL Server can find data pages in memory as opposed to fetching them from the disk. This number should be == > 98%. I’d say that if that ratio is less than 95% than the server is under memory pressure. We always want this to be extremely high.
SQLServer:Buffer Manager/Page life expectancy – this is probably the most popular performance counter when it comes to memory in SQL Server. It represents the number of seconds a page will stay in the buffer pool without the references. If I’d have to choose one counter, this metric is the one that all SQL Server monitoring tools should be able to track. So, essentially, we want the page to stay in the buffer for as long as possible because it will lead to high performance. This is simply because if a request comes in for that page, it can be read from the cache rather than searching on the disk and ultimately reduce I/O. As for the expected value, this is a tricky one. You’ll probably read online that it should be more than 300. This is an old rule, when SQL Server memory could maximum be 4 GB. These days, we can have much more RAM than that and this metric is basically memory dependent. Therefore, one of the most known memory formulas that can be found to calculate your PLE value online is the amount of allocated memory to SQL Server divide by 4 and multiply that number with 300. For example, if 16 GB is allocated to SQL Server it should look like this 300 * (16/4) = 1.200. So, this number is your base and if our PLE value is below this number that would be a good indication that SQL Server does not have enough memory to keep pages in the buffer long enough. By the way, this will directly affect buffer cache hit ratio. Therefore, those two are the most important SQL Server monitoring tools and commonly used counters to discover memory pressures.
For more information about monitoring two types of counters above, see the SQL Server memory performance metrics – Part 4 – Buffer Cache Hit Ratio and Page Life Expectancy article.
SQLServer:Buffer Manager/Lazy writes/sec – this number represents how many pages are flushed from memory outside of the checkpoint process when there’s memory pressure. This value should always be < 20, if it’s greater then you should probably consider allocating more memory to SQL Server.
For more information about monitoring this type of counter, see the SQL Server memory performance metrics – Part 5 – understanding Lazy Writes, Free List Stalls/sec, and Memory Grants Pending article.
Performance Monitor
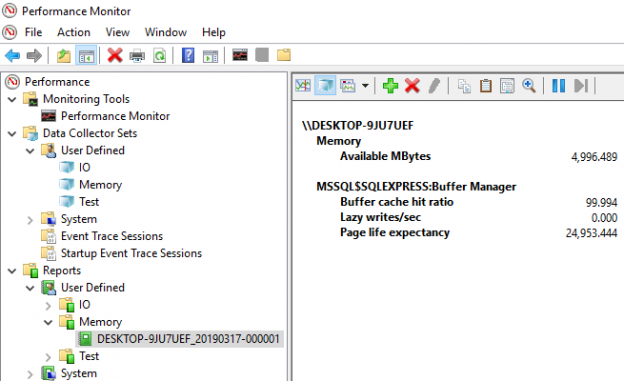
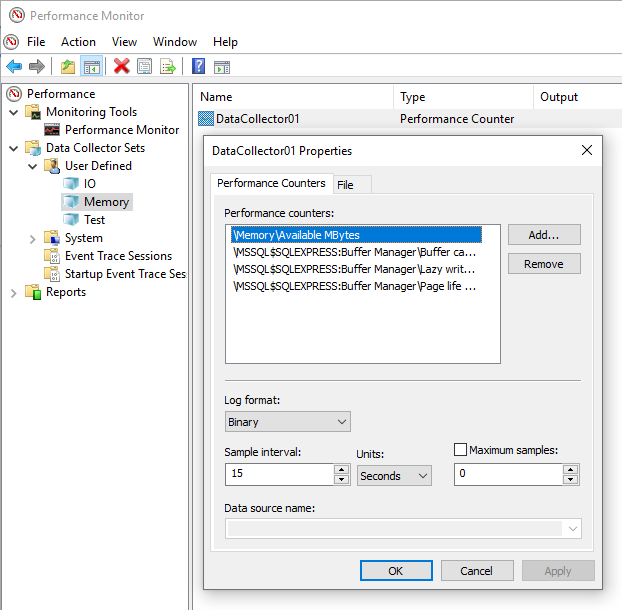
Next, let’s see how we can monitor some of the counters using the native system SQL Server monitoring tool Performance Monitor. If you’re not familiar with this tool, check out the first part of the series for detailed information on how to run it and more importantly how to create a custom data set for monitoring specific counters. I’ve already created one called “Memory” and from the list of available counters, I’ve added the following:
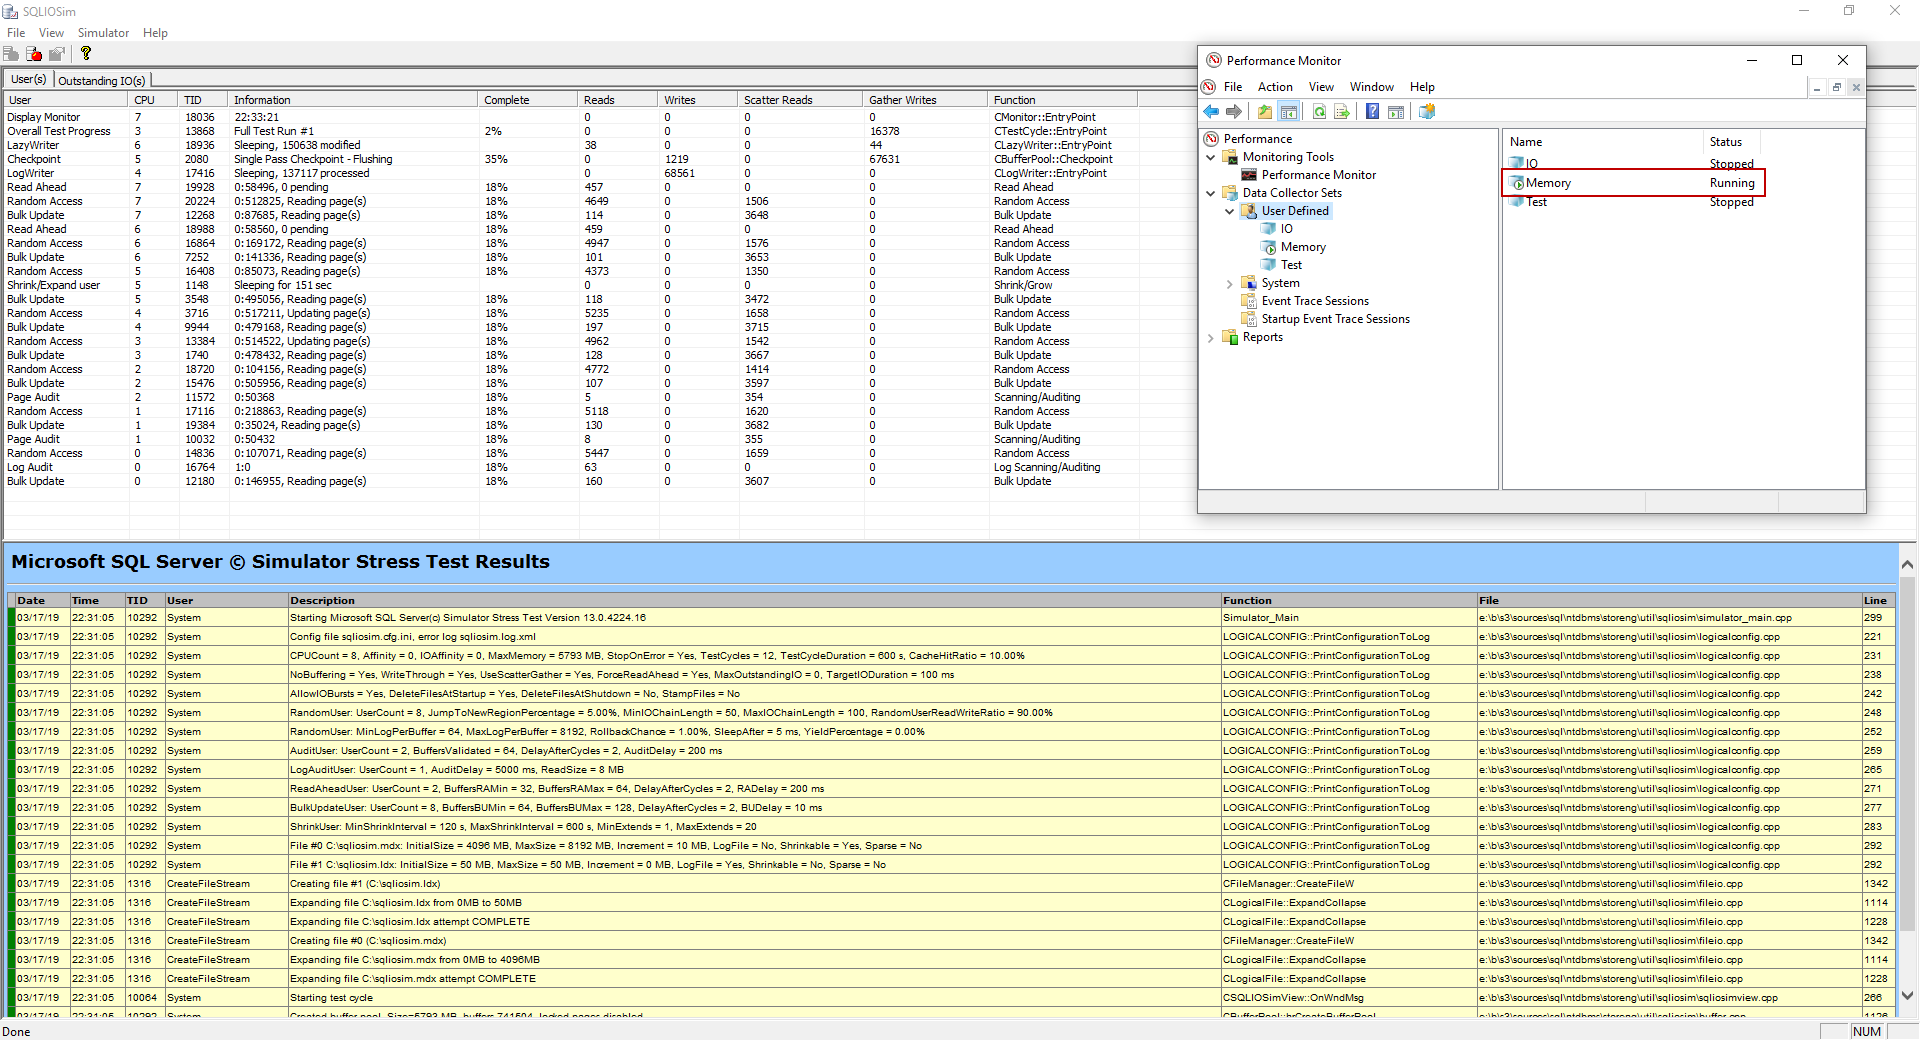
Now, if I would just start this data collection set, nothing unusual would have happened on my local machine. On idle, the result would have been perfect. So, let’s create some heat by running the SQL Server monitoring tool shipped within SQL Server called SQLIOSim. Again, I’m going to use the same stress test in which I’ve already pre-configured everything. If needed, jump to part one for details on how to do it.
Basically, I’ve just ran the stress test, then also started data collector set in Performance Monitor and let both run for about 10 minutes. Feel free to let the stress test finish its job, but this can be time consuming depending on the machine configuration:
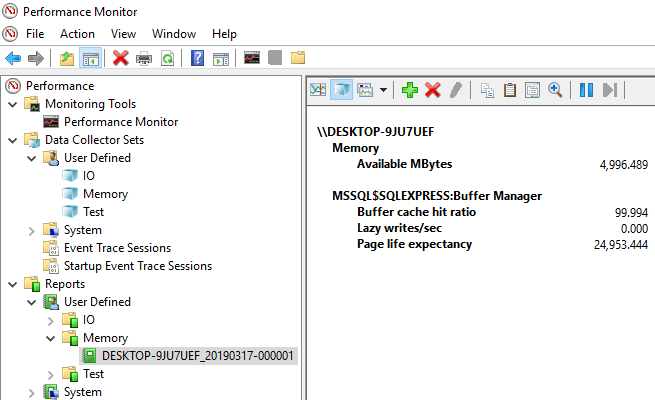
Once it’s done, click the memory report under user defined reports folder and switch over to report graph type:
On my local machine, I’ve got 16 GB od RAM. We can run the query below to see how much is dedicated to SQL Server:
|
1 2 3 4 |
SELECT c.name, c.value_in_use FROM sys.configurations c WHERE c.name LIKE '%server memory%'; |
Results from my machine:
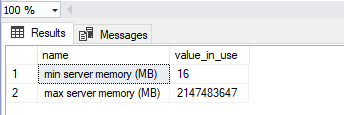
If the number of maximum amounts of memory that SQL Server will use is 2147483647 that indicates SQL Server will use as much memory as it can get, assuming it needs it. This is also the default value for max server memory (MB). So, back to the report, we’ve got almost 5 gigs od available RAM. More importantly, under the buffer manager counters, we have Buffer cache hit ratio at almost 100 percent. Now, this is as good as it gets, remember that we want a high value here. Lazy writer a second at zero are even better. Last but not least, Page life expectancy value is way above the base for this system which is really good. This means that pages are not getting flushed out of the memory because memory is not getting turned over.
These counters are absolutely what you need in a SQL Server monitoring tool and what you want to look at when troubleshooting memory issues because they give us a lot of insight into how SQL Server is using memory.
Table of contents
| SQL Server monitoring tools for disk I/O performance |
| SQL Server monitoring tools for memory performance |
| SQL Server monitoring tool for CPU performance |

He has written extensively on both the SQL Shack and the ApexSQL Solution Center, on topics ranging from client technologies like 4K resolution and theming, error handling to index strategies, and performance monitoring.
Bojan works at ApexSQL in Nis, Serbia as an integral part of the team focusing on designing, developing, and testing the next generation of database tools including MySQL and SQL Server, and both stand-alone tools and integrations into Visual Studio, SSMS, and VSCode.
See more about Bojan at LinkedIn
View all posts by Bojan Petrovic
- Visual Studio Code for MySQL and MariaDB development - August 13, 2020
- SQL UPDATE syntax explained - July 10, 2020
- CREATE VIEW SQL: Working with indexed views in SQL Server - March 24, 2020