

CPU pressure slowing down the server
This article is the sequel in a series about SQL Server monitoring tools and common performance issues. Before reading this piece, it advisable to read the previous two articles about monitoring tools for disk I/O and memory performance:
- SQL Server monitoring tools for disk I/O performance
- SQL Server monitoring tools for memory performance
However, if you are just interested in CPU pressure that’s okay. This piece can be also read independently. I only advise reading the whole sequel because everything is somehow connected. To kick-off, I always like to mention some symptoms as indicating a condition of CPU issues:
- Repetitively high CPU utilization – high CPU utilization can be seen in Windows Task Manager. This is an obvious one when you see that the CPU is pegged that’s a good sign that something is going on
- I/O increase – CPU issues can be manifested from I/O and memory problems. So, I/O should also be checked when troubleshooting CPU issues
- High recompiles – many recompiles can add some cycles to the CPU
- Expensive queries – even more so than the previous one
Tools for performance monitoring
Dynamic management views
First of all, we have a great DMV called sys.dm_exec_query_stats that returns aggregate performance statistics for cached query plans in SQL Server. This DMV can be used in various ways. For example, it can be used for both finding a high number of recompiles and expensive queries.
So, let’s look at different ways this query stats is used as SQL Server monitoring tool. Paste the code from below and execute it:
|
1 2 3 4 5 6 7 8 9 10 11 12 |
--High recompiles SELECT plan_generation_num, execution_count, SUBSTRING(st.text, qs.statement_start_offset / 2 + 1, (CASE statement_end_offset WHEN-1 THEN DATALENGTH(st.text) ELSE qs.statement_end_offset END - qs.statement_start_offset) / 2 + 1) AS statement_text FROM sys.dm_exec_query_stats AS qs CROSS APPLY sys.dm_exec_sql_text(qs.sql_handle) AS st WHERE plan_generation_num > 1 ORDER BY plan_generation_num DESC; |
Here you can see a selection from query stats where plan generation is greater than one. That’s just an indicator that a query has done more than one recompile. If it’s done more than one, there’s a good chance that it will continue to do so. Here’s my result:
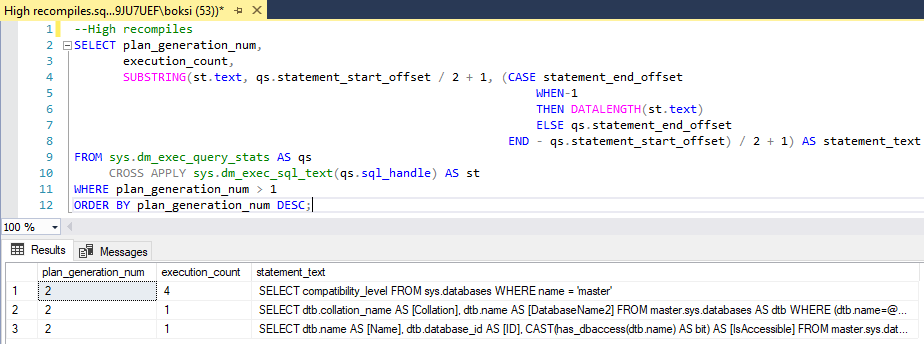
In a production environment, you’ll most likely get a larger set of data.
Another way to use query stats is shown in the code below. This time, we’re finding the TOP 10 expensive queries. Paste the code in query editor and execute it:
|
1 2 3 4 5 6 7 8 9 10 11 12 13 |
--Expensive queries SELECT TOP 10 creation_time, last_execution_time, total_worker_time, total_elapsed_time, SUBSTRING(st.text, qs.statement_start_offset / 2 + 1, (CASE statement_end_offset WHEN-1 THEN DATALENGTH(st.text) ELSE qs.statement_end_offset END - qs.statement_start_offset) / 2 + 1) AS statement_text FROM sys.dm_exec_query_stats AS qs CROSS APPLY sys.dm_exec_sql_text(qs.sql_handle) AS st ORDER BY total_worker_time DESC; |
Feel free to edit the TOP part and enter any desired number of queries that you want to be returned:
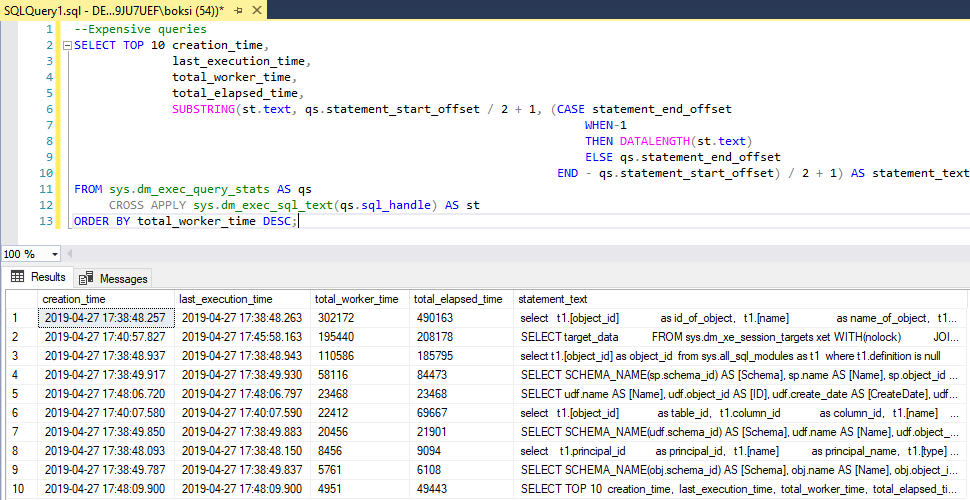
You’ll notice that both queries are identical except for what we’re selecting and in the second one we’re ordering by total worker time which essentially will return information about the TOP N queries ranked by processor time.
Performance Monitor
The Performance Monitor side, we have a few SQL Server monitoring tools AKA counters that can be used when troubleshooting CPU performance. The following counters are simple and easy to use:
- Processor % Processor Time == < 80%
- Processor % User Time == < 80%
- Processor % Privileged time) == < 30%
Understanding processor time is not so difficult. Overall, this value should be less than 80 percent. The same rule applies for user time, and lastly, privileged time should be less than 30 percent. If any of these are above, it’s a good sign that we’re stressing out the CPU. Bear in mind that when troubleshooting CPU issues using any SQL Server monitoring tool, you should always take into consideration external factors as well not only the CPU that are causing extra cycles.
If we head over to Performance Monitor, we can quickly create another data collector set and add the above performance counters. I kept it running for about 10 minutes just to create data logs of counters we previously included. This time, I did not run the stress tool in the background because it would clearly create heat on my local machine and that’s not the point. The goal here is to identify if the CPU is under the pressure under normal circumstances. Here’re my results:
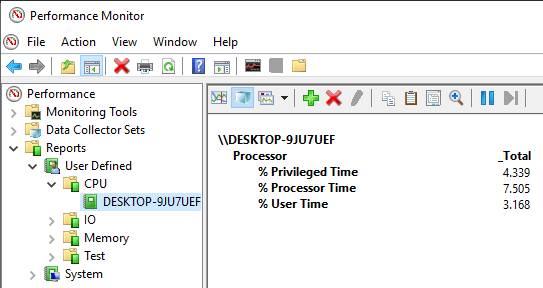
By looking at this report, we can see that privileged time is pretty good, the same goes for both processor and user time. All of them are in good shape. But then again, this in my local machine. The results on e.g. production server can be radically different. Look out for these counters not to exceed the numbers specified above.
Rather than writing another article in series about SQL Server monitoring tools, I want to briefly cover concurrency that I mentioned in the 1st article under the list of common performance issues. Concurrency is pretty much the easy one to troubleshoot. This is contractionary to what I wrote in the initial article when I said that it’s a tough nut to crack. Both statements are somewhat true. It all depends on how the concurrency manifests itself.
Some good symptoms of concurrency will be:
- Slow throughput
- Blocking events
- CPU/Memory/IO utilization is normal but…
The last one is tricky because CPU, memory, and I/O can be in order, but people could still complain about performance issues which is a good indicator that we most likely have an issue with concurrency. Furthermore, this issue is probably coming from locking or blocking.
We got two DVMs to discover locks:
Performance Monitor side, we also got two counters:
- SQLServer:Locks\Lock Waits/sec == 0
- SQLServer:Locks\Lock Wait Time (ms) == 0
These two combined will give a good sign if there’s some locking going on and how severe it is. I’m pretty sure that I don’t have any locking on my local machine, so I won’t even go to Performance Monitor, but the point is that those counters can be used as SQL Server monitoring tool when troubleshooting locking issues.
Troubleshooting strategy
One last thing I want to mention is a troubleshooting strategy. It always helps when troubleshooting an issue on any level, especially performance problems to have strategy in place. That way, when a critical moment occurs, you’ll be able to approach the problem correctly. Here’s a list of what you should do and in which order:
- Define the problem – this can be hard because it can get as general as “everything is slow” or “the system is unresponsive”. The best case is when the problem is specific, and we can say something like “we have a locking problem on this table”. Anyhow, this should be a starting point. I wouldn’t do anything without describing the problem as detailed as possible
- Analyze if internal or external – this is an important step because it can get us halfway through fixing the problem. Especially if there’s other stuff running on SQL Server then that can open a whole new can of worms. So, if internal you’re halfway there. If not, well then, it’s another story but either way, I’d always go through this step
- Determine if current or ongoing – if we know that it’s internal (SQL Server is the issue), then we must find out if it’s current or ongoing. Current means it just happened, we are certain that this is the first time a problem occurred. If it’s ongoing it means that maybe it has been a week without even knowing that it’s there. In this case, logs can help. Furthermore, let’s say that it’s the first time you’ve seen it, but you simply don’t know if it has been ongoing or not. Well then you can set up an extended event or/and Performance Monitor or any other SQL Server monitoring tool that you prefer to run for a day or two to find out if something is repeated issue or just a one-time thing
- Identify and resolve – this is an obvious one that needs no explanation. With a bit of luck and following the previous three steps, you’ll get here rapidly
I want to wrap things up with this 3rd chapter on SQL Server monitoring tools.
Hopefully, this series has been informative for you and I thank you for reading it.
Table of contents
| SQL Server monitoring tools for disk I/O performance |
| SQL Server monitoring tools for memory performance |
| SQL Server monitoring tool for CPU performance |

He has written extensively on both the SQL Shack and the ApexSQL Solution Center, on topics ranging from client technologies like 4K resolution and theming, error handling to index strategies, and performance monitoring.
Bojan works at ApexSQL in Nis, Serbia as an integral part of the team focusing on designing, developing, and testing the next generation of database tools including MySQL and SQL Server, and both stand-alone tools and integrations into Visual Studio, SSMS, and VSCode.
See more about Bojan at LinkedIn
View all posts by Bojan Petrovic
- Visual Studio Code for MySQL and MariaDB development - August 13, 2020
- SQL UPDATE syntax explained - July 10, 2020
- CREATE VIEW SQL: Working with indexed views in SQL Server - March 24, 2020