
This article explores SQL Sort, Spill, Memory and Adaptive Memory Grant Feedback mechanism in SQL Server.
Sorting is one of the key operations in query processing. SQL Server can achieve sorting by either reading data in an ordered fashion, for example, performing ordered Rowstore index scan or performing an explicit sort. If we want to get sorted data from a Columnstore index, the only option is to perform a sort explicitly with a Sort operator in a query plan, because a Columnstore index has no particular order, at least at the moment of writing this post.
Columnstore indexes were first introduced in SQL Server 2012, and starting from this version, we got a new query execution mode, called Batch Mode. Batch Mode was originally designed for column store indexes as an execution technique optimized to deal with a large number of rows. Operators, running in a traditional Row Mode, process one row at a time, operators in a Batch Mode process one batch of rows at a time, where a batch is a portion of approximately 900 rows.
In 2012 and 2014 a SQL Sort operator used to run in a Row Mode only, however, starting from SQL Server 2016 the SQL Sort for a Batch Mode was also implemented. In this post, we are going to look at some Batch Mode Sort peculiarities.
Memory Grant
Sort is a memory consuming operator, it allocates memory for the internal structures that are used to store intermediate sorted results before it starts producing a sorted output. For that purpose, there should be some amount of memory, allocated for the query.
This memory is often called a workspace memory, the amount of the workspace memory for a query is called a memory grant. A memory grant is calculated during the query compilation and then, when the execution should start, this amount is requested and, depending on the available memory, granted to a query. There are a gateway and a resource semaphore mechanism that regulates the memory allocation process, but we will not delve into it here because it is not the topic of this post.
The important thing here is that a reserved memory grant could not change during the query execution (with a few exceptions, like Sort during index builds). This grant reservation and its immutability make a query execution more reliable, because if the memory is reserved, the query has less chances to run out of memory under high load. This also prevents the situation when one query consumes the entire server memory, because it needs to.
We may see memory grant information in a query plan if we look at the properties of the root plan element. Let’s run a query against a clustered Columnstore index with an ORDER BY clause and took in the memory grant information. I will use SQL Server 2017 CTP 1.3 (though all the examples work also in SQL Server 2017 CTP 2.0 with slightly different numbers) and a sample AdventureworksDW2016CTP3 database under compatibility level 130 (compatibility level of SQL Server 2016). Let’s turn on Include Actual Execution Plan in SSMS and run the query.
|
1 2 3 4 5 6 7 8 9 10 11 12 13 |
use AdventureworksDW2016CTP3; go alter database AdventureworksDW2016CTP3 set compatibility_level = 130; go select CarrierTrackingNumber from dbo.FactResellerSalesXL_CCI c where c.DueDate between '20140101' and '20150101' order by c.CarrierTrackingNumber, c.CustomerPONumber; go |
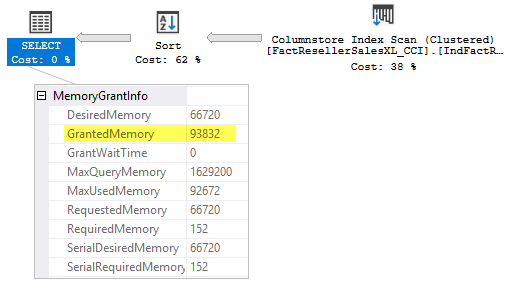
We see a simple plan with a Columnstore index scan and a Sort, if we look at the SELECT element’s properties we’ll also see the memory grant information:
Let’s quickly recall, what do they mean:
- SerialRequiredMemory – the minimum amount of memory for the query to start execution. This memory is needed to create internal data structures to handle memory consuming operators, without this memory the query will not start. Calculated at the compile time.
- SerialDesiredMemory – the required memory, plus the ideal memory that a query should have for all the data to be processed in memory, this depends on the cardinality and size estimate. Calculated at the compile time.
- RequiredMemory – if a query plan goes parallel and runs under a certain degree of parallelism (DOP), it should create as many operators as the DOP, and hence as many internal structures for memory consuming operators as the DOP. So, this value is SerialDesiredMemory*DOP + Exchange operators’ memory. In our case the DOP is one so it equals SerialRequiredMemory.
- DesiredMemory – this is an additional memory with RequiredMemory, in our case the plan is serial and this property value equals SerialDesiredMemory property value.
- MaxQueryMemory – Maximum amount of memory available for individual query grant. This was added in 2014 SP2 and 2016. This value may change depending on the overall memory consumption by SQL Server components.
- RequestedMemory – The server checks if the desired memory exceeds maximum memory available for the query, if it exceeds, that it is reduced until it fits the limit. This amount of memory is asked from the resource semaphore and called a requested memory.
- GrantedMemory – This is the amount of memory that was actually granted to the query.
- MaxUsedMemory – This shows how much memory the query actually used during the execution.
Now when we recalled the meaning of the main properties, let’s talk about the situation when the granted memory is not enough.
SQL Sort Spill in a Row Mode
As it was mentioned earlier a memory grant is fixed and could not change even if it is found that a query needs more during the execution. You may ask, why not to request all the memory it needs during the compilation? Well, a server actually does it, but, first there might be not enough memory at the moment (we’ll not discuss this situation now) and second – there might be a mistake in a memory calculation because it calculates memory before the actual execution starts.
The memory amount calculation is based on the estimated number of rows (cardinality) and estimated row size, if one of those parameters differs from the actual values (for a number of reasons, like outdated statistics, for example), the calculation is wrong and the desired memory is not enough. To be able to proceed a query execution, the Query Processor should either – request some more memory (which is forbidden in most cases) or free some used memory temporary spilling the data somewhere, in case of SQL Server, spilling to tempdb.
Let’s look at the spill example, that happens because of the cardinality estimation mistake. While in a real-world cardinality estimation mistakes might be introduced by different factors like, inaccurate or outdated statistics, skewed derived statistics in plan operators, guesses and so on, for a simple demo (I want to keep the plan shape as simple as possible), let’s introduce a cardinality estimation mistake by tricking the optimizer. There are about 10 000 000 rows in the table in reality, but we will pretend there are twice less – 5 000 000 rows.
I will use the same query as above, but I also will use an undocumented trace flag 9453 to disable a Batch Mode execution, and a MAXDOP hint to keep a simple serial plan shape.
|
1 2 3 4 5 6 7 8 9 10 11 |
update statistics dbo.FactResellerSalesXL_CCI with rowcount = 5000000 --11669600 go select CarrierTrackingNumber from dbo.FactResellerSalesXL_CCI c where c.DueDate between '20140101' and '20150101' order by c.CarrierTrackingNumber, c.CustomerPONumber option(querytraceon 9453, maxdop 1); |
The query plan looks like this:
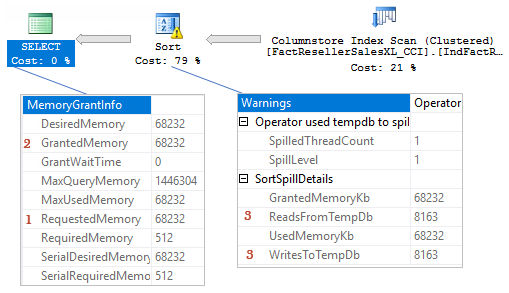
You may notice a yellow triangle sign on the Sort operator and the warning telling us, that there is a SQL sort spill. Sort starts an iterative process of spilling some data portions to tempdb, sorting, loading spilled data, sorting again, merging sorted data and so on. Spill, because of the tempdb interaction, can make a query very slow, especially if the spill level is high.
Note, that in the query plan requested memory (1) equals granted memory (2) and equals 68 232 KB, which is not enough and 8163 extra pages were written and read to and from tempdb (3).
SQL Sort Spill in a Batch Mode
Let’s now remove the undocumented trace flag and MAXDOP and run our query in a Batch Mode.
|
1 2 3 4 5 6 7 8 |
select CarrierTrackingNumber from dbo.FactResellerSalesXL_CCI c where c.DueDate between '20140101' and '20150101' order by c.CarrierTrackingNumber, c.CustomerPONumber; |
We may see the following plan:
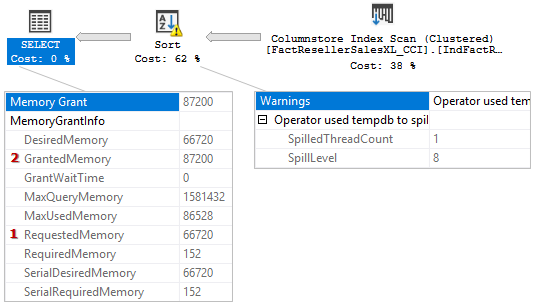
Unfortunately, for some reason, if short runs in a batch mode, there are no spill details in a query plan, so we can’t see, how much data was spilled. But if you look at the memory grant information you may notice something interesting.
The granted memory (2) is more than the requested memory (1)! That contradicts with the statement that a query cannot request more memory during the execution. And indeed, in case of a batch mode SQL sort it can request more memory to maintain a spill. Let’s look at this process in more details with the help of extended events.
We enable the following extended events.
- additional_memory_grant – occurs when a query tries to get more memory grant during execution. Failure to get this additional memory grant may cause the query slowdown.
- requested_memory_kb – The size of requested memory grant in KB
- granted_memory_kb – The actual granted memory in KB. This can be zero if this additional grant request fails.
- resource_pool_id – ID of resource pool where this grant request belongs to
- batchmode_sort_spill_file – Record the spill file read/write information for batch mode sort.
- file_io_mode – Read or write a spill file 0 means read, 1 means write
- query_dop – DOP of current query
- spill_stage – Stage of SQL sort, when spill happens, 1 means retrieve data from lower iterator, 4 means parallel external merge, 8 means return final sorted data
- node_id – Numa Node ID
- thread_id – Thread ID
- query_id – Unique ID for the current sort query
- row_file_id – Global row file id
- deepdata_file_id – Global deepdata file id
- start_row_id – Row file first row ID
- row_counts – Number of rows in row file
- deepdata_size_in_pages – Number of pages to store deep data
- batchmode_sort_status – Record batch mode sort status
- query_dop – DOP of current query
- thread_id – Thread ID
- query_id – Unique ID for the current sort query
- time_stamp – Time this status change is recorded
- status – In what status, current batch mode sort is
- description – Description of current status
Let’s run the trace session filtered by the SPID, click Watch Live Data, run the previous query, stop the session and look into the Live Data grid (I have added two extra columns granted_memory_kb and description, the rest of the data are available in the Details section below the grid).
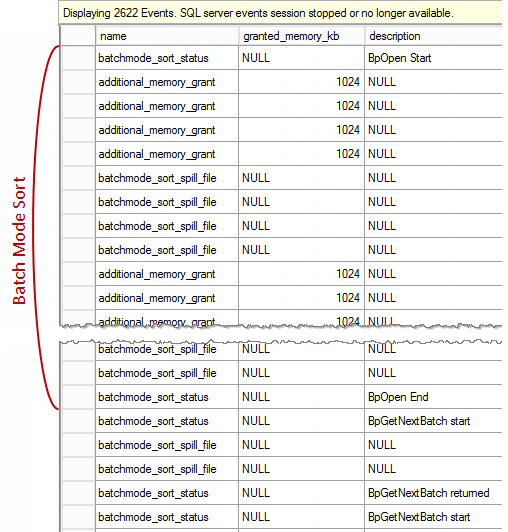
Like a Row Mode Sort, Batch Mode SQL Sort is also a stop-and-go iterator, when the parent iterator asks for the data, a Sort calls the method Open and execution is stopped until the method is finished. This method creates internal structures, uses them to sort data and as soon as the data is sorted the execution goes further, sort produces the sorted output from the internal structures previously sorted on the open phase.
We see 2622 events, most of them fired when a batch mode sort produces batches, you may see BpGetNextBatch start and BpGetNextBatch returned in the description column. These events are not so interesting for us here, more interesting is a sort open phase, where the additional memory grant happens, you see BpOpen start and BpOpen end description. To save space I have aggregated the results.
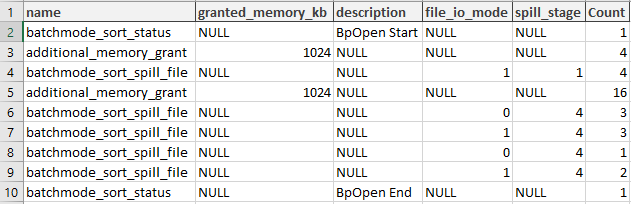
Then I used the event’s description above to decode file_io_mode and spill_stage column values.
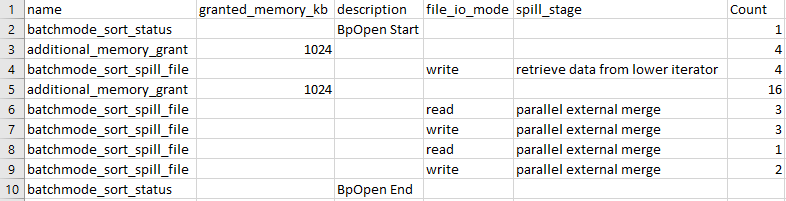
Then I merged all that to one description and made a sum calculation of the memory grant.
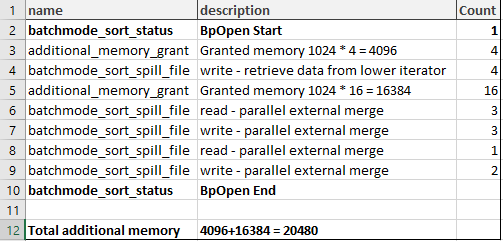
If you recall that the requested memory was 66 720 KBs, and then calculate 66 720 + 20 480 = 87 200. Which equals granted memory – 87 200 KBs. So, we have found all the additional memory grants.
From the extended event sequence, you may notice that all the memory grants are done before the actual parallel external sort merge operations are done. First memory chunk (4096 KB) before writing down the data from lower iterator, second, bigger chunk (16 384 KB) before performing sort runs.
The reason for the additional memory grant is that a server needs additional memory for the spill structures. The difference between a row mode SQL Sort and a batch mode SQL Sort is, that the last one was designed with an ability of dynamic memory grant and uses an optimistic strategy for memory grabbing. This means, that a server creates spill structures during the runtime and only when it detects a low memory condition, while a row mode Sort is more conservative and creates all the necessary structures beforehand. I would like to thank Pedro Lopes (b|t) from MSSQL Tiger Team for clarifying this behavior.
Avoiding SQL Sort Spill
We just have looked at some spill and memory grant details in different execution modes. In this section, we’ll talk about how to avoid spilling, because it slows down the execution when interacts with tempdb.
Avoid SQL Sort
The best way to avoid a SQL sort spill is to avoid sort at all. We may achieve this by adding a proper Rowstore index that may be used to perform an ordered scan to get the data sorted directly from an index. Unfortunately, it is not always possible because of the query plan shape and the intermediate plan operators that don’t preserve order.
If we are talking about a Columnstore index, which has no keys and no particular order in the current version, we can’t get sorted data at all. However, starting from SQL Server 2016 you may have additional Rowstore indexes on a table and probably use them to get sorted data in some scenarios.
Fix Estimates
In this example, we deliberately skewed the estimates to get a cardinality mistake while keeping the plan shape simple. In a real life, there might be a lot of real problems with estimates and a lot of ways how to deal with them. Deeper discussion of this topic deserves a separate post, so I’ll quickly enlist the most popular reasons for the incorrect estimates and brief descriptions of the solutions.
Statistics
- Missing – create manually or turn on auto creation if it is turned off, switch to a temporary table instead of a table variable if a query contains a table variable, read only DB – move to SQL Server 2012 or create statistics and then go back to read only, remote server – provide necessary permission or update to SQL Server 2012 SP1.
- Outdated – update statistics and plan to do it on a regular basis, also trace flag may help 2371 if the SQL Server version is less than 2016.
- Inaccurate – update with higher sample rates or with a FULLSCAN option.
- Skewed (atypical distribution or too much data to fit in 200 histogram steps) – create filtered stats.
- Skewed by a number of plan operators further in a query plan – break complex query into several simpler queries, materializing intermediate results into temporary tables.
- Can’t be used by the optimizer – avoid type conversions in predicates, create computed column, use inline UDF instead of scalar UDF, use option RECOMPILE/OPTIMIZE FOR/Dynamic SQL or break code into multiple branches in case of the unknown local variable.
Estimation model
-
Model version – starting from SQL Server 2014 the new estimation model was provided, but you may switch between legacy and modern versions with the following options:
- change database compatibility level (this also changes the other optimizer related things);
- trace flags 9481 and 2312;
- query hints FORCE_LEGACY_CARDINALITY_ESTIMATION and FORCE_DEFAULT_CARDINALITY_ESTIMATION;
- database scoped configuration option LEGACY_CARDINALITY_ESTIMATION.
-
Correlated columns – to control the model behavior for complex predicates and correlated columns you may use the following:
- create multicolumn statistics (it helps in some cases);
- use trace flag 4137 for SQL Server 2008 – 2012;
- undocumented trace flags 9471 and 9472 for SQL Server 2014-2016;
- query hint ASSUME_MIN_SELECTIVITY_FOR_FILTER_ESTIMATES for SQL Server 2016.
- Ascending keys – trace flags 2389 and 2390 for SQL Server 2012 and below, hint ENABLE_HIST_AMENDMENT_FOR_ASC_KEYS for SQL Server 2016.
- Join Estimations – query hint ASSUME_JOIN_PREDICATE_DEPENDS_ON_FILTERS for SQL Server 2016, materialize intermediate results into a temp table – very helpful, but not always possible (there is also a number of TFs that I have described earlier in my blog, but those are not documented and not intended for production usage).
- Row Goals – trace flag 4138 or query hint DISABLE_OPTIMIZER_ROWGOAL for SQL Server 2016.
- Optimizer fixes – you may use a trace flag 4199 or query hint ENABLE_QUERY_OPTIMIZER_HOTFIXES for SQL Server 2016.
There are some other, more exotic reasons and solutions, but the enlisted above work for the most cases.
Row Mode SQL Sort – TF 7470
There might be a situation when a row mode sort spills to tempdb even if cardinality estimates are correct. In that case, you may use a trace flag 7470, that was introduced in the fix “FIX: Sort operator spills to tempdb in SQL Server 2012 or SQL Server 2014 when estimated number of rows and row size are correct”.
Batch Mode SQL Sort – TF 9389
For a batch mode sort, in case you cannot fix the estimates there is a trace flag 9389, which turns on dynamic memory grants for batch mode operators (not only a Sort) in SQL Server 2016 and upwards.
|
1 2 3 4 5 6 7 8 9 10 11 12 13 14 |
dbcc traceon (9389); go select CarrierTrackingNumber from dbo.FactResellerSalesXL_CCI c where c.DueDate between '20140101' and '20150101' order by c.CarrierTrackingNumber, c.CustomerPONumber ; go dbcc traceoff (9389); go |
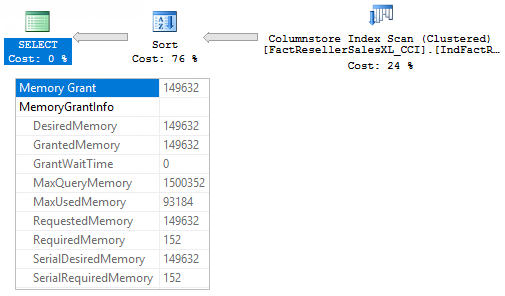
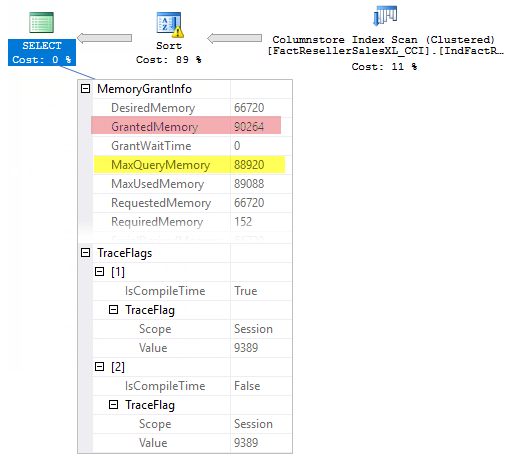
If we enable this TF on a session level and run our query we will see the following query plan.
When this TF is enabled, you see that a memory grant in now about 93 MBs, which is enough to avoid a SQL sort spill.
This trace flag may not help if you have not enough memory, for example, when I set an option ‘max server memory (MB)’ to 480 MBs, I saw the following plan.
You may notice that I even ran the query with a TF 9389, the Max Query Memory was too low to reach 93 MBs and as soon as a memory grant exceeded this threshold no more memory was granted.
Fix Memory Grant
Starting from SQL Server 2016 there are two query hints MIN_GRANT_PERCENT and MAX_GRANT_PERCENT to control the memory grant. These hints set minimum and maximum memory grant in the percent of a query default memory limit. We may use the first one, which guarantees that a query will get the maximum of required memory or min grant.
|
1 2 3 4 5 6 7 8 9 |
select CarrierTrackingNumber from dbo.FactResellerSalesXL_CCI c where c.DueDate between '20140101' and '20150101' order by c.CarrierTrackingNumber, c.CustomerPONumber option(min_grant_percent = 10.0); |
We may see that there is no more spill in the query plan.

You may also see that Granted Memory is 157 400 KB which is 10% of Max Query Memory 1 574 024 KB as we have specified with the hint, which is more than necessary to avoid spill. So, be careful with the hint not to waste memory.
2017: Adaptive Memory Grant Feedback
SQL Server 2017 may address a memory problem in the other way. A feature that is called Adaptive Memory Grant Feedback, which is one of the features from the Adaptive Query Processing family of features will help us to address the spill.
This feature was first introduced in the CTP 1 for SQL Server 2017 and demands database compatibility level 140. The idea of this feature is to use repeating queries and adjust memory from one execution to another. In case of inaccurate memory grant, SQL Server updates a cached plan with an actual value from the previous execution, so the next execution will have the accurate memory grant. I recommend to read a blog post by Joe Sack – Introducing Batch Mode Adaptive Memory Grant Feedback.
Before we switch to a new compatibility level and run our query, I’d like to make an important notice.
Note: Adaptive memory grant feedback works with cached plans. Many people report about a strange issue with plan cache flushing in a developer’s environment due to a memory pressure while there are no signs of memory pressure. To repro the example below, make sure that a plan cache is not flushed.
Now, let’s switch to the CL 140, clear cache and run the query three times.
|
1 2 3 4 5 6 7 8 9 10 11 12 13 14 |
alter database AdventureworksDW2016CTP3 set compatibility_level = 140; go alter database scoped configuration clear procedure_cache; go select CarrierTrackingNumber from dbo.FactResellerSalesXL_CCI c where c.DueDate between '20140101' and '20150101' order by c.CarrierTrackingNumber, c.CustomerPONumber ; go 3 |
We may observe the following plans.
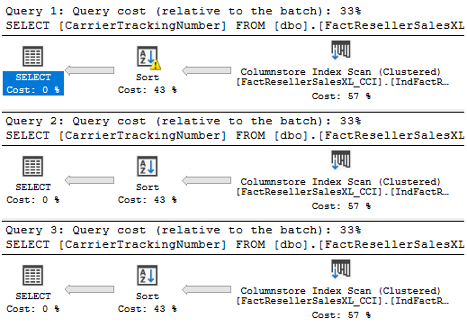
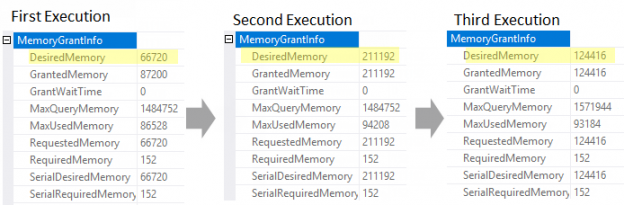
You may notice that during the first execution there was a spill (yellow triangle on a Sort operator), during the second and the third one, memory was adjusted by adaptive memory grant feedback.
You may observe the memory grant details in the query plans:
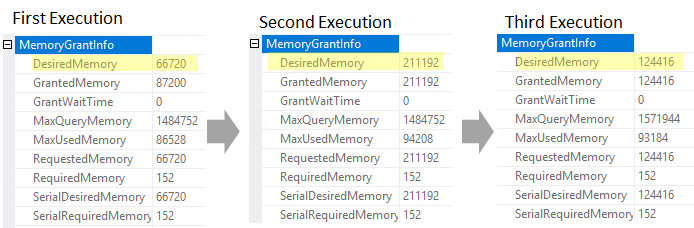
The Desired Memory changes from one execution to another. During the first execution, the Desired Memory property was set to 66 720 KBs, however, that was not enough and spill to tempdb has occurred. During the second execution, SQL Server uses Adaptive Memory Grant Feedback feature and adjusts memory to fit the sort data size, it sets the Desired Memory to 211 192 KBs and spill doesn’t happen. However, Max Used Memory property tells us that only 94 208 KBs was really used by the query so the memory grant of 211 192 KBs is excessive. Because of that during the third execution Adaptive Memory Grant Feedback feature adjusts the memory grant once again, this time, it lowers memory grant to 124 416 KBs, which is closer to the Max Used Memory, so there is almost no memory waste.
If we enable an extended events session with two extended events: spilling_report_to_memory_grant_feedback and memory_grant_updated_by_feedback – we will see adaptive memory grant feedback in more details.
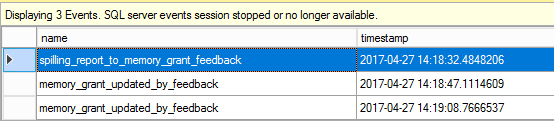
There are three events, let’s look at their properties.
The first one is fired because of the spill and tells how much data was spilled.
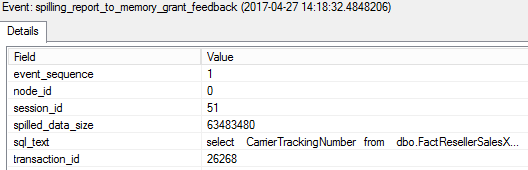
The memory problem is detected and the server decides to use adaptive memory grant feedback.
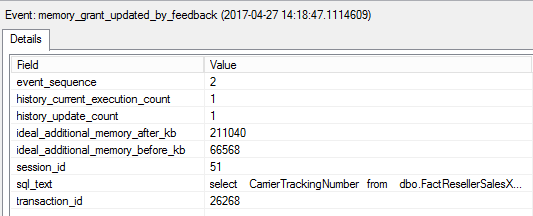
Notice the property ideal_additional_memory_before_kb which is 66 568 KBs, this value we have seen in the first execution plan before (66 720 KBs in the plan is 152 KBs of Required Memory with 66 568 KBs of additional memory). Then memory grant is adjusted and after the adjustment we see the property ideal_additional_memory_after_kb which is 211 040 KBs, this value together with 152 KBs of Required Memory gives us 211 192 KBs which we have seen in the second execution plan.
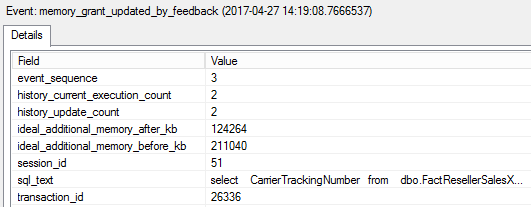
During the next execution the memory is lowered, we see 211 040 KBs that was used during the second execution, and after adjustment we see 124 264 KBs, together with 152 KBs of Required memory we get 124 416 KBs total, which we have seen in the third query plan.
The adaptive memory grant feedback feature is one of the Adaptive Query Processing features available in SQL Server 2017 under Compatibility Level 140, remember that a plan should be cached to make this feature work.
2017: SQL Sort Compression
At the end of this post, I’d like to share with you one more feature that is related to a batch sort – SQL sort compression. This is an undocumented feature, at least in CTP 1.3 – 2.0, and I have no idea, will it stay in SQL Server 2017 RTM or it will be removed, but still it is in the current build and we will try it.
To enable it, we should use an undocumented trace flag 10810.
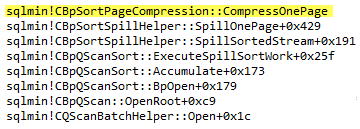
In the script below we make a snapshot of the DMV dm_io_virtual_file_stats and its columns num_of_bytes_read, num_of_bytes_written before the execution and after the execution, then will calculate the difference “before” and “after”, to see how much data was written to the tempdb during the SQL Sort spill. Then we enable a trace flag and do exactly the same thing. After that we will compare data size with and without compression. I’ll also use WinDbg with public symbols and set a break point on the method CBpSortPageCompression::CompressOnePage, to prove that it is actually executed when the trace flag is enabled.
Let’s run the script:
|
1 2 3 4 5 6 7 8 9 10 11 12 13 14 15 16 17 18 19 20 21 22 23 24 25 26 27 28 29 30 31 32 33 34 35 36 37 38 39 40 41 42 |
use AdventureworksDW2016CTP3; go alter database scoped configuration clear procedure_cache; go drop table if exists #b; drop table if exists #a; select num_of_bytes_read, num_of_bytes_written into #b from sys.dm_io_virtual_file_stats(db_id('tempdb'),1); go -- No Sort Compression select CarrierTrackingNumber from dbo.FactResellerSalesXL_CCI c where c.DueDate between '20140101' and '20150101' order by c.CarrierTrackingNumber, c.CustomerPONumber go select num_of_bytes_read, num_of_bytes_written into #a from sys.dm_io_virtual_file_stats(db_id('tempdb'),1); select num_of_KBs_read = (a.num_of_bytes_read - b.num_of_bytes_read)/1024., num_of_KBs_written = (a.num_of_bytes_written - b.num_of_bytes_written)/1024. from #b b cross join #a a; go alter database scoped configuration clear procedure_cache; go drop table if exists #b; drop table if exists #a; select num_of_bytes_read, num_of_bytes_written into #b from sys.dm_io_virtual_file_stats(db_id('tempdb'),1); go dbcc traceon(10810); go -- With Sort Compression select CarrierTrackingNumber from dbo.FactResellerSalesXL_CCI c where c.DueDate between '20140101' and '20150101' order by c.CarrierTrackingNumber, c.CustomerPONumber go dbcc traceoff(10810); go select num_of_bytes_read, num_of_bytes_written into #a from sys.dm_io_virtual_file_stats(db_id('tempdb'),1); select num_of_KBs_read = (a.num_of_bytes_read - b.num_of_bytes_read)/1024., num_of_KBs_written = (a.num_of_bytes_written - b.num_of_bytes_written)/1024. from #b b cross join #a a; go |
Both of the test queries has spilled to tempdb. During the execution of the first part the breakpoint was not hit. However, when the trace flag is enabled we see the following picture in the debugger call stack window.
And if we look at the amount of data we will see that during the first execution, there was about 49 MBs written and read from tempdb, while during the second execution there was about 46 MBs.
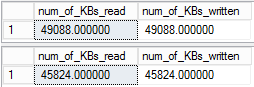
About 7% less data size because it was compressed, not too much, but the compression rate highly depends on the data and in the other case we may observe higher compression. I ran this script in SQL Server 2017 CTP 1.3 and in SQL Server 2017 CTP 2.0 and it works for both but with slightly different numbers.
Conclusion
In this post, we observed SQL sort and memory grant details and some new features of the SQL Server 2017, like adaptive memory grant feedback and sort compression. In the next post, we will look at the next feature of the Adaptive Query Processing called Adaptive Join.
Stay tuned and thank you for reading!
Table of contents

Currently he works as a database developer lead, responsible for the development of production databases in a media research company. He is also an occasional speaker at various community events and tech conferences. His favorite topic to present is about the Query Processor and anything related to it. Dmitry is a Microsoft MVP for Data Platform since 2014.
View all posts by Dmitry Piliugin
- SQL Server 2017: Adaptive Join Internals - April 30, 2018
- SQL Server 2017: How to Get a Parallel Plan - April 28, 2018
- SQL Server 2017: Statistics to Compile a Query Plan - April 28, 2018