

Yesterday I came across a question on one of SQL forums, that I may rephrase like:
“Does a query plan compilation depend on how busy SQL Server is”.
Before we go further, I should explicitly mention that we talk about a Compiled plan, not an Executable plan. Plan execution will of course depend on how busy server is, for example, the query may wait for the memory grant to start execution, or execution may be slow because there are no cached pages in the Buffer Pool etc.
However, the question was about a Compiled plan: does the shape of a plan depend on the server load.
From the first glance it should not. But…
The optimizer of SQL Server is not designed to find the best possible plan, but to find a good enough plan fast. The reason for this design is that if we enumerate and evaluate every possible plan it will take a lot of time, close to infinite for the very complex queries. To prevent this situation SQL Server has several optimization techniques and several stop factors.
We will recall stop factors briefly.
Regular optimization – no early termination
While optimizing a query SQL Server uses an object called Memo. Basically, this is a data structure to store plan alternatives and track the cheapest plan so far. The Memo is divided into groups; each group contains different operator alternatives logically equivalent to each other. The root operator is in the root memo group. Each group has a cost boundary. This boundary is set depending on the cheapest alternative the memo group has so far (what I observed, was cost goal = best cost so far + 10% of the best cost so far). If the new generated alternative crosses this boundary – that alternative is pruned away.
The optimization process continues and may pass several optimization stages, but this is not the subject of this article, so we will just stop here and say, that optimization stops when it is considered, that the root plan operator satisfies cost memo boundary and there is no more valuable optimization steps to decrease the cost. That is a normal path when we see no indication in a query plan, that optimization aborted early.
Good Enough Plan Found
We may see “Good Enough Plan Found” in a query plan in the property “Reason For Early Termination” of the root language plan operator (usually, the green one, e.g. SELECT).
From my observations that is not a real reason to stop optimization early. I could not verify using WinDbg that optimization process is really aborted at some point with this reason. What I see is that this attribute is added to the query plan if the root memo group cost boundary is less than one.
Below is the picture of my old experiments with these things and several undocumented trace flags for internal diagnostics output from my Russian blog.
The plans are identical in their shape but slightly different in cost because the optimizer thinks that there is one more row in the right one:
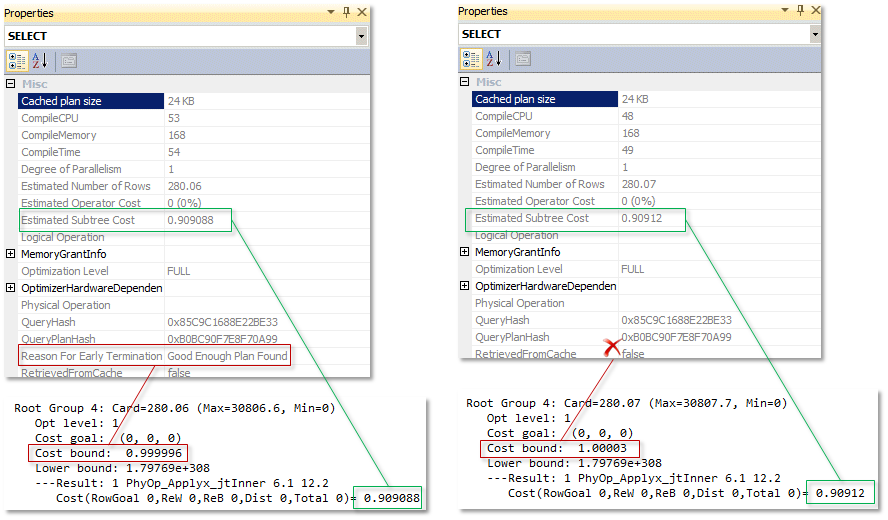
However, you may see, that the leftmost plan has the “Reason For Early Termination” attribute, but the rightmost has not. I suppose this is a historical legacy. You may read my original blog post to understand the reasons for this assumption: Good Enough Plan (unfortunately it is in Russian only).
Time Out
There are also a few articles in Russian about it in more details (Optimizer Unleashed part 1 and Optimizer Unleashed part 2), so I will describe the main concept of Time Out here.
The name “Time Out” implies that there is a time measure somehow involved. But there is not. Less confusing name should be “Estimated Transformation Steps Out”, however, than it should be explained – what is a transformation step – almost useless information for the majority, so I understand why it was named “Time Out”.
If we recall the first paragraph “No early termination” there were some steps to generate alternatives. These alternatives are generated using optimization rules. Each transformation applying a rule generates an alternative operator or several of them, and if it is cheap enough it is saved to Memo. This is an optimization step.
The number of these optimization steps is limited; however, it may change from one optimization stage to another during the process. Generally, it is based on the complexity of the query and cardinality estimations.
There is no way to disable this limitation, however there is a trace flag 8780 that relaxes this number to the fixed number of transformations count equals 3072000. I strongly don’t recommend to do this in any production system! But nevertheless, we will use this trace flag later to initiate extremely time and memory consuming plan compilation process for demo purposes.
The main point here is that Time Out is a calculated maximum number of steps for each optimization phase but not a time. There is no such thing that on a busy environment there where N seconds to optimize because a server was busy, but later, when there is less pressure – there will be more time and the plan will be more optimal. This is not how it works. Time Out in general depends on the query complexity and cardinality, but not on time.
So far it seems that a query plan should not depend on the server load, unless we recall the third early termination reason.
Memory Limit Exceeded
While optimizing a query SQL Server use a lot of algorithms encapsulated into the C++ classes and structures. The objects created from those classes consumes memory, that is allocated and deallocated when needed.
This memory consumption is displayed in the query plan in the property of the root language plan element “Compile Memory”. Usually for moderate queries it is not a big value, however, it may be significant for complex queries. The more complex query is, the more alternatives, the more memory to store and manage them.
Considering the fact that there might be several to many simultaneously compiling queries the amount of memory might be significant. I will explicitly mention that it is not a workspace memory used for the query execution (e.g. memory for the hash join or sort), this is a memory for the query compilation. There is a mechanism of gateways to control resources for compilation, but still there might be a memory contention and the process of optimization may exceed allowed memory boundary.
In this case you may see “Reason For Early Termination = Memory Limit Exceeded” (or even an error if available memory will be extremely low).
For that reason, SQL Server may stop process early if there will be not enough memory for continuing compilation and the plan would be less optimal than if it was compiled when there was enough memory.
Let’s move on to the example.
Example of compilation on a busy server with memory pressure
Of course, I cannot post a script or kind of it to simulate a real high load production system with thousands of complex plans and compilations and so on.
Rather than that I will model it here introducing two things:
1) limiting test server memory to a very small amount
2) issuing compilation of a quite complex query.
I also should mention that this example was produced on SQL Server 2014 (12.0.2548.0) – that is a very important note, because the algorithm of memory allocation changed from major version to major version, and the query compilation memory may change even from CU to CU due to the changes in the internal classes (and the object sizes accordingly) or optimization strategies.
Now we’ll proceed with number one in our list and limit SQL Server memory with the following script.
|
1 2 3 4 5 6 |
exec sp_configure 'show advanced options', 1; reconfigure; go exec sp_configure 'max server memory (MB)', 360; -- 2147483647 reconfigure; go |
Now we need a quite complex query that will take a lot of resources during the compilation. I’ll take well known database Adventure Works 2014 and the query below. Don’t look for the sense in this query it was created pure for the demo purposes and the number of joins, columns and predicates was empirically selected as well as the number of available server memory to satisfy conditions of the memory pressure during the compilation.
I also will use TF 8780 to disable early termination by timeout and produce huge compilation time and memory (now, you see why it is not recommended ever use it in production, but we need it now for the simple demonstration of SQL Server optimizer behavior).
|
1 2 3 4 5 6 7 8 9 10 11 12 13 14 15 16 17 18 19 20 21 22 23 24 25 26 27 28 |
set showplan_xml on; go select * from Sales.SalesOrderDetail sod join Sales.SalesOrderHeader soh on sod.SalesOrderID = soh.SalesOrderID join Sales.CreditCard cc on cc.CreditCardID = soh.CreditCardID join Sales.CurrencyRate cr on cr.CurrencyRateID = soh.CurrencyRateID left join Sales.Currency crn on crn.CurrencyCode = cr.FromCurrencyCode and crn.ModifiedDate = cr.ModifiedDate join Sales.SalesPerson sp on soh.SalesPersonID = sp.BusinessEntityID left join Sales.SalesTerritory st on soh.TerritoryID = st.TerritoryID join Sales.SalesTerritoryHistory sth on st.TerritoryID = sth.TerritoryID and sth.StartDate = dateadd(dd, st.SalesLastYear%10, getdate()) join Person.BusinessEntity be on sp.BusinessEntityID = be.BusinessEntityID join Person.Person p on p.BusinessEntityID = be.BusinessEntityID join Person.BusinessEntityAddress bea on bea.BusinessEntityID = be.BusinessEntityID join Person.Address a on bea.AddressID = a.AddressID left join Person.StateProvince spr on a.StateProvinceID = spr.StateProvinceID join ( select m = max(tha.TransactionDate), tha.ProductID from Production.TransactionHistoryArchive tha group by tha.ProductID ) tha on tha.ProductID = sod.ProductID where cc.CardType in ('SuperiorCard','Vista') and p.PersonType = 'IN' and (soh.SalesOrderNumber > 'SO' or spr.CountryRegionCode in ('FR', 'US')) option(querytraceon 8780); go set showplan_xml off; go |
Let’s run this script (notice that this query is inside of showplan_xml command and will not be cached until the real execution – that is what we need, we need compilation, not cache reusing, so don’t execute this query, just compile executing the whole script including showplan_xml instruction) and examine the properties of the root SELECT operator.
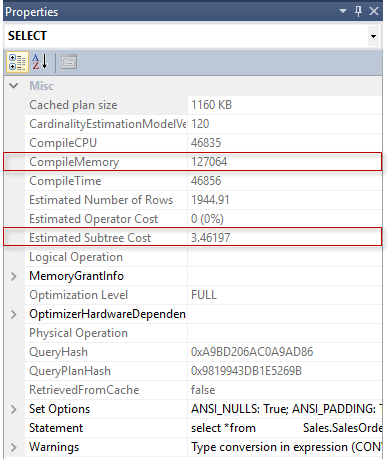
First of all, look at how high is Compile Memory, consumption during the compilation is almost 127 MB (thanks TF disabling timeout)!
That is tough if we remember, that overall server memory is only 360 MB.
Next we’ll remember the plan cost – 3.46197.
Now Let’s open another SSMS window and copy exact the same script there.
What we’ll do – we will run both scripts almost simultaneously, i.e. we will try to compile two 127 MB consuming queries with 360 MB total available to the whole server.
Let’s do it.

After execution, we will examine the SELECT plan item properties. You should find the one with the early termination reason present. There might be both plans with that or only one, depends on how fast you are at clicking execute on SSMS =).
Now, let’s compare the plan with the Early Termination Reason – Memory Limit Exceeded and the first one, that was compiled single with no other simultaneous compilations.
Here it is (the leftmost is compiled when two compilations were running, the rightmost was compiled single):
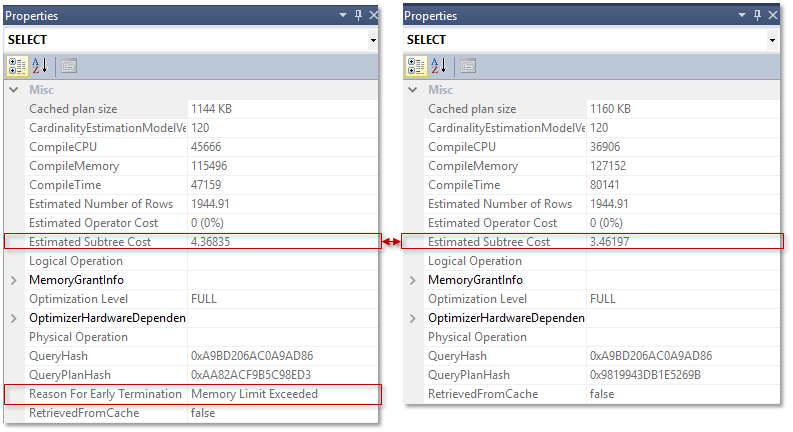
If you remember – this was the exact same script and query, just compiled in different conditions – without memory pressure and under memory pressure.
You may see, that the leftmost has an attribute “Reason For Early Termination” with the value “Memory Limit Exceeded”. The rightmost has not. Also the leftmost has Estimated Subtree Cost 4.36835 which is higher than 3.46197 of the rightmost, compiled without memory pressure.
If we involve some internal diagnostics using undocumented TF 8675 (together with TF 3604), we will see the following picture in the message output:

In case of memory pressure, the optimization aborted at stage “Search 2” on the task 1 539 829 (a task is an optimization task i.e. an optimization transformation discussed earlier in this post).
In case of enough memory there where explored 1 682 903 tasks, that is 143 074 tasks more, and the cheaper plan was found.
If we look at the plan shapes there are huge differences, I will provide only the part of the plan as a picture, because the picture of the whole plan is quite big.
Memory pressure:
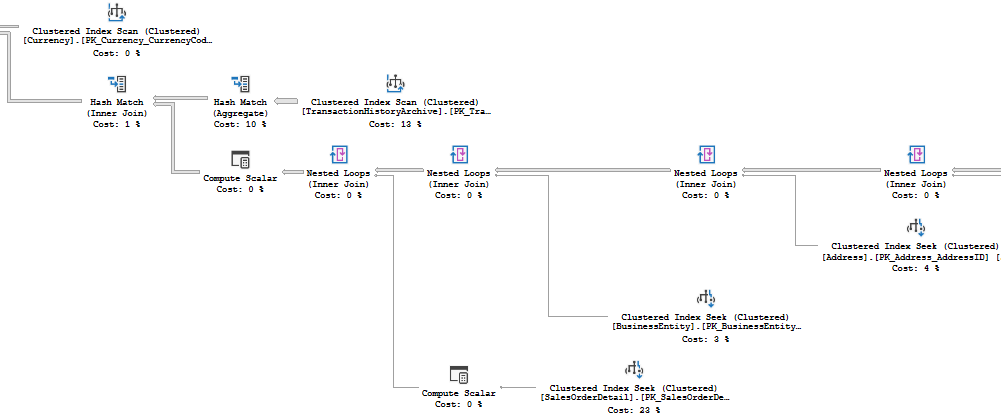
No memory pressure:
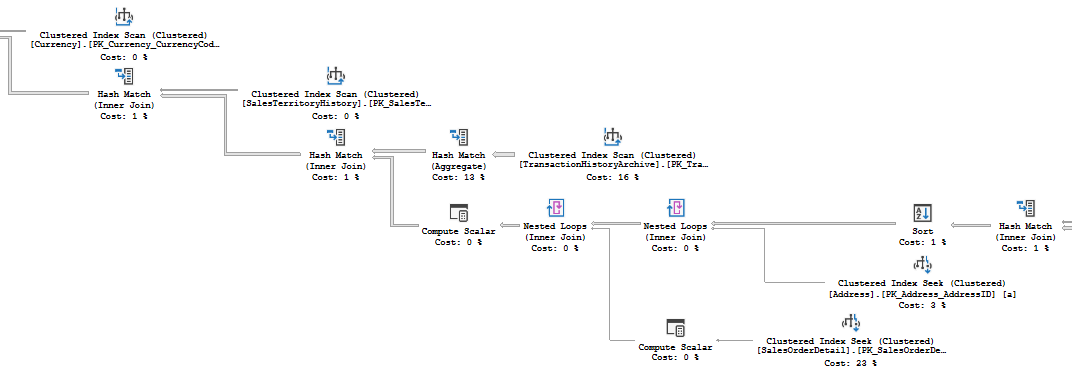
We may see that the plans are different in table order, joint types, shape etc.
Now let’s run the query a couple of times, enabling timing statistics. First of all, single query in a single window (we are also enabling recompilation to ensure that plan is not cached), and then we will run both queries together and compare timings. I will also run this experiment several times to validate results.
|
1 2 3 4 5 6 7 8 9 10 11 12 13 14 15 16 17 18 19 20 21 22 23 24 25 26 27 28 |
set statistics time, xml on; go select * from Sales.SalesOrderDetail sod join Sales.SalesOrderHeader soh on sod.SalesOrderID = soh.SalesOrderID join Sales.CreditCard cc on cc.CreditCardID = soh.CreditCardID join Sales.CurrencyRate cr on cr.CurrencyRateID = soh.CurrencyRateID left join Sales.Currency crn on crn.CurrencyCode = cr.FromCurrencyCode and crn.ModifiedDate = cr.ModifiedDate join Sales.SalesPerson sp on soh.SalesPersonID = sp.BusinessEntityID left join Sales.SalesTerritory st on soh.TerritoryID = st.TerritoryID join Sales.SalesTerritoryHistory sth on st.TerritoryID = sth.TerritoryID and sth.StartDate = dateadd(dd, st.SalesLastYear%10, getdate()) join Person.BusinessEntity be on sp.BusinessEntityID = be.BusinessEntityID join Person.Person p on p.BusinessEntityID = be.BusinessEntityID join Person.BusinessEntityAddress bea on bea.BusinessEntityID = be.BusinessEntityID join Person.Address a on bea.AddressID = a.AddressID left join Person.StateProvince spr on a.StateProvinceID = spr.StateProvinceID join ( select m = max(tha.TransactionDate), tha.ProductID from Production.TransactionHistoryArchive tha group by tha.ProductID ) tha on tha.ProductID = sod.ProductID where cc.CardType in ('SuperiorCard','Vista') and p.PersonType = 'IN' and (soh.SalesOrderNumber > 'SO' or spr.CountryRegionCode in ('FR', 'US')) option(querytraceon 8780, recompile); go set statistics time, xml off; go |
The results on my machine are:
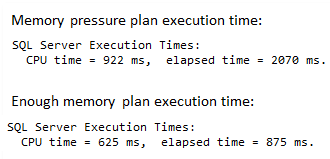
I ran the script several times and in average it is two times slower if the plan was compiled under the memory pressure.
Well, I think, that it is enough to consider the following scenario: the query runs normally using the cached plan until the plan is evicted due the memory pressure. The query comes again and asks for the plan, but it was flushed and it should be built once again. Building under memory pressure leads to early termination and to the less efficient plan. The query runs slow.
Conclusion
In normal conditions, the optimizer considers only static resources available to a server, those are shown in a query plan in the property Optimizer Hardware Dependent Properties. However, if there is memory pressure and a complex query compilation the optimization process may be stopped earlier due to the lack of memory and may lead to a less efficient plan.
Reproducing
Important repro notice. As I said earlier, SQL Server version and configuration is very important. For example, I reproduced this situation on three different versions and three different computers, and each time it was an empirical guess how to limit server memory to get the needed behavior. E.g. in the version 12.0.2495.0 it was 420 MBs instead of 360 in 12.0.2548.0. It may even differ if you restart server. For instance, before restart it was 380 MB limit, after restart it was 360. Memory management is quite complex, connections, available threads and so on – all consumes memory, keep it in mind if you want to reproduce the described behavior, and play with your own values – the main point is that this behavior is reproducible and may be a problem on a real production system.
Thank you for reading.

Currently he works as a database developer lead, responsible for the development of production databases in a media research company. He is also an occasional speaker at various community events and tech conferences. His favorite topic to present is about the Query Processor and anything related to it. Dmitry is a Microsoft MVP for Data Platform since 2014.
View all posts by Dmitry Piliugin
- SQL Server 2017: Adaptive Join Internals - April 30, 2018
- SQL Server 2017: How to Get a Parallel Plan - April 28, 2018
- SQL Server 2017: Statistics to Compile a Query Plan - April 28, 2018