
The SSRS report builder is a powerful tool for data visualization. In this article, we will take a first step into familiarizing ourselves with the SSRS report builder and we will also demonstrate a very basic SSRS report example. Additionally, we will review the self-service business intelligence approach just because this approach can be implemented through the SSRS report builder very easily.
Self-Service BI
IT departments get report development request from business departments thousands of times a day. Unfortunately, IT departments have limited developer source and capacity, and it is for this reason that they can’t respond to every BI development request. How can we address this issue?
- We can hire more developers
- We can hire freelancers
- Or we can implement the Self-Service BI approach
#C is the right and effective solution for this issue because non-technical persons can learn to develop their own reports and dashboards through prepared datasets. Key stakeholders can gain the ability to develop and create their own reports so that the IT department dependency and waiting time will decrease. To accomplish this, though, report and BI tools must be so easy and understandable by non-technical users.
The purpose of the Self-Service BI approach is to provide report or dashboard development capability to non-technical users thus, will give more freedom and responsibility. The main question is how we can implement this approach with SQL Server Reporting Services? Microsoft has obviously taken this into consideration because the SSRS report builder is a very simple report design tool and they can be easily learned and used by non-technical staff. At the same time, BI developers can provide key users with shared datasets, to abstract users from learning how to retrieve data from desired data warehouse or relational database. Additionally, SQL Server Reporting Services offers a significant feature which is the My Report Folder. This feature offers a private and personal storage to users so that users can deploy and use their SSRS report in this folder. As a result, Self-Service BI allows non-technical staff to generate report by themselves so that it can decrease the costs which related to business intelligence implementation.
Preparing to sample data
Before we start our SSRS report builder demonstration, we need a sample dataset. For this, we will download the sample sales csv file and load it to Azure SQL database. It is very basic operation so we can complete the following steps easily. Additionally, you can apply the following steps on premise installation of any SQL Server version.
- Connect to Azure SQL or any premise installation through SQL Server Management Studio
-
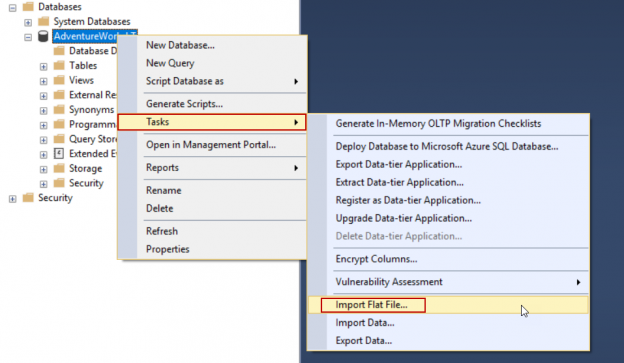
Right click in your test database and then navigate to Tasks > Import Flat File…

-
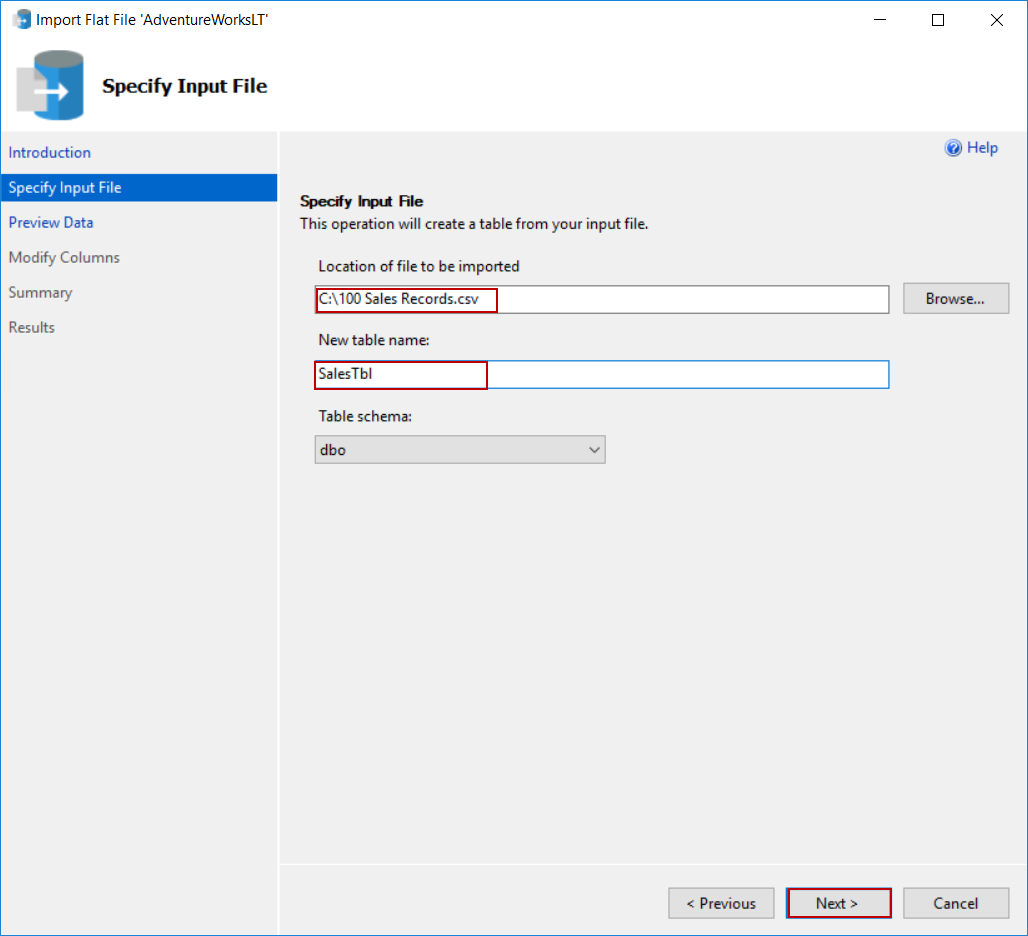
Chose the csv file and specify a new table name to which the data will be imported.
-
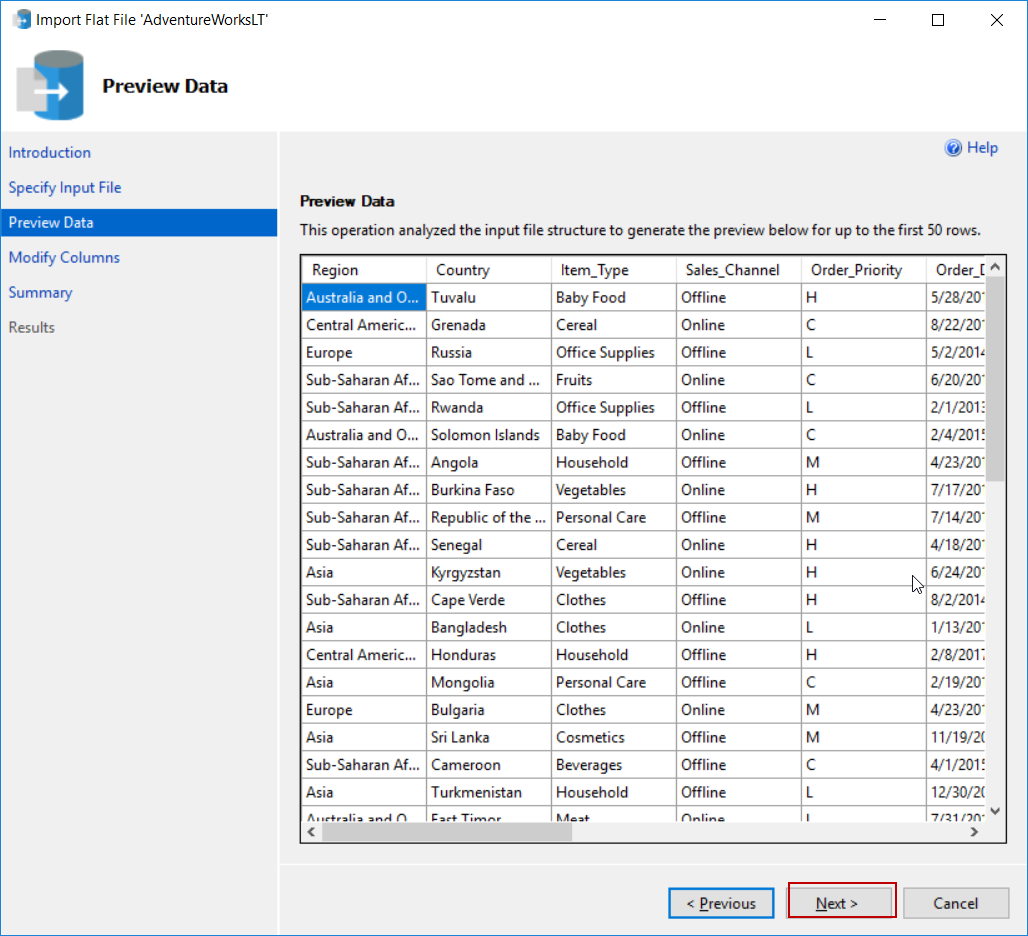
Click Next in the Preview Data step
-
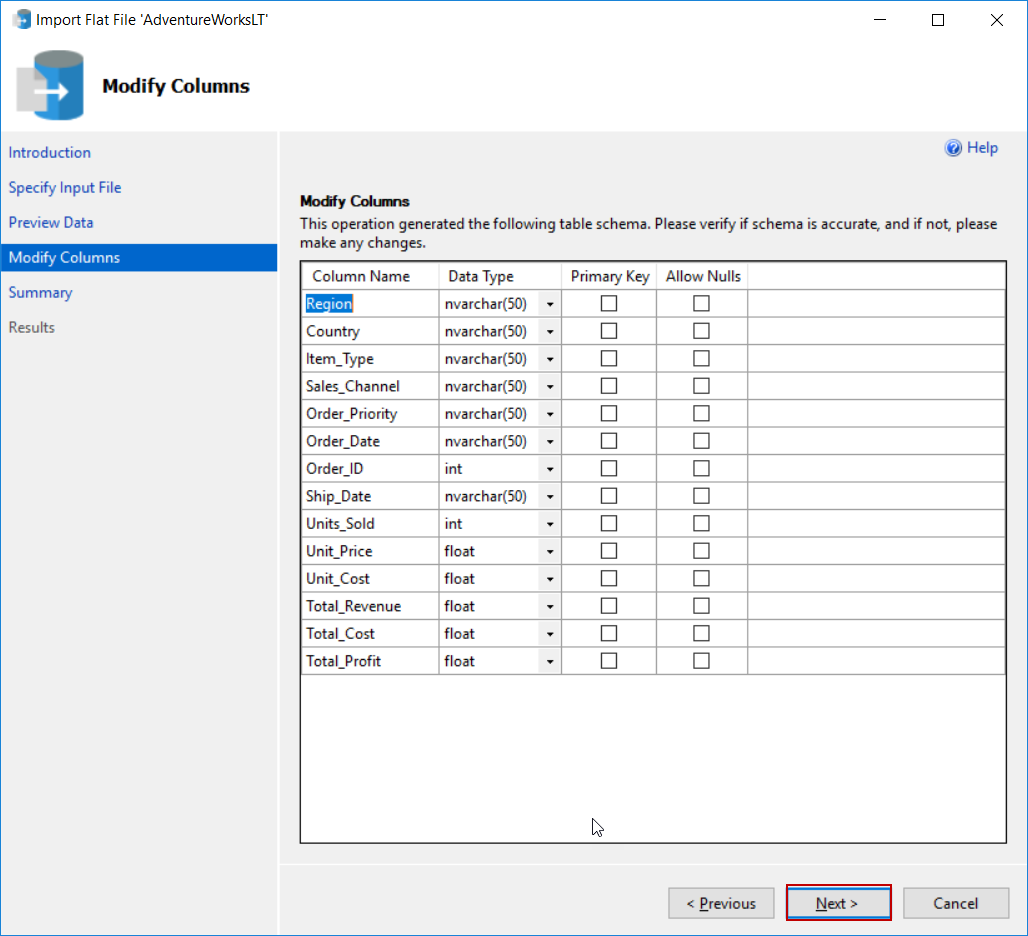
Click Next in the Modify Columns step
-
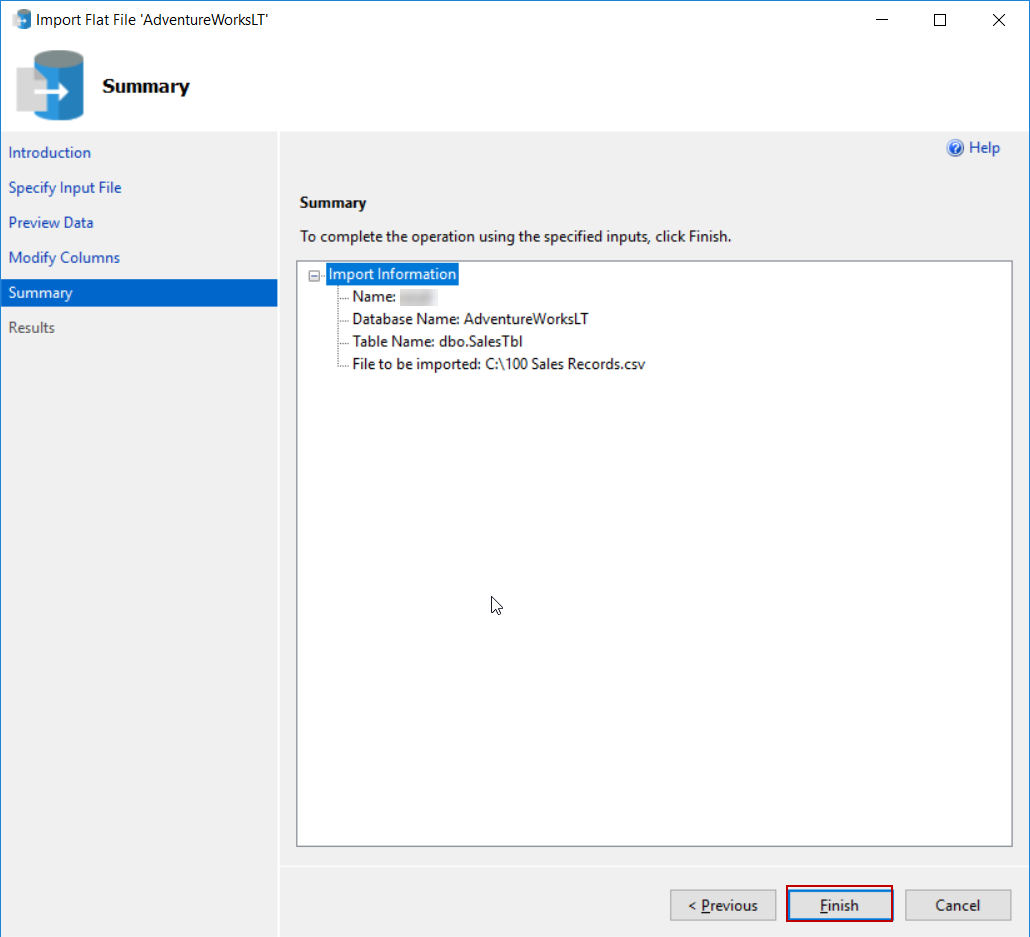
Click Finish in the Summary step
-
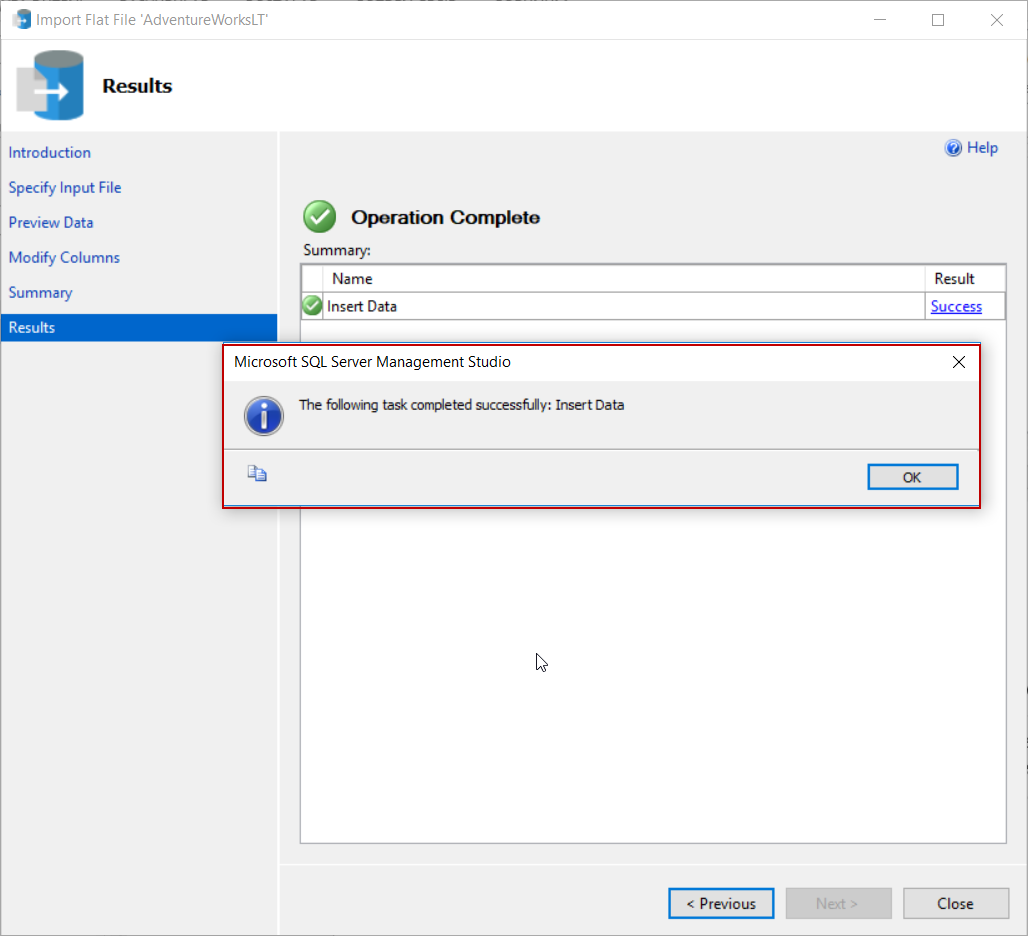
The operation will be completed successfully

Create our first report with SSRS Report Builder
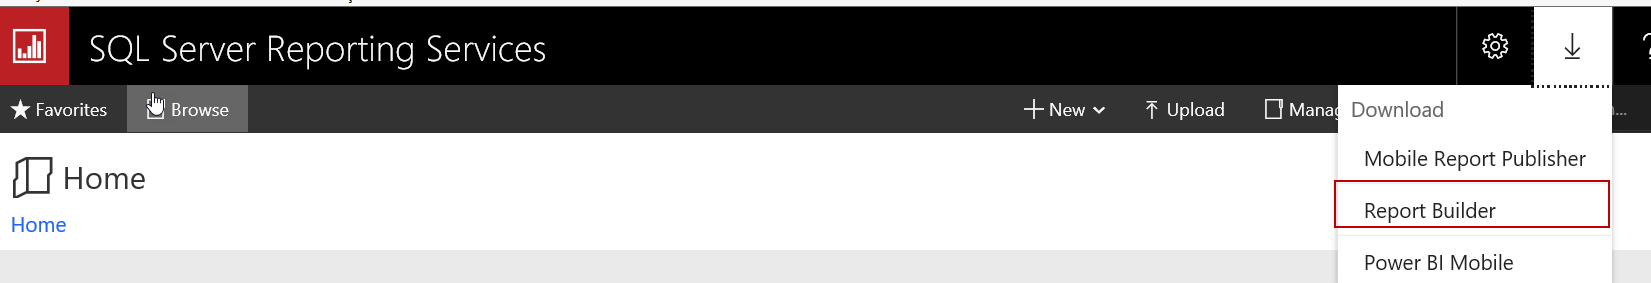
The SSRS Report Builder is a report creation tool which allows users to create, manage and publish reports to SQL Server Reporting Services. We can also create shared datasets with the help of the report builder. The Report builder has a standalone installation so we can easily setup and configure it. We can find out the installation link in the web portal of SQL Server Reporting Services. When we click this link it redirects to download page.
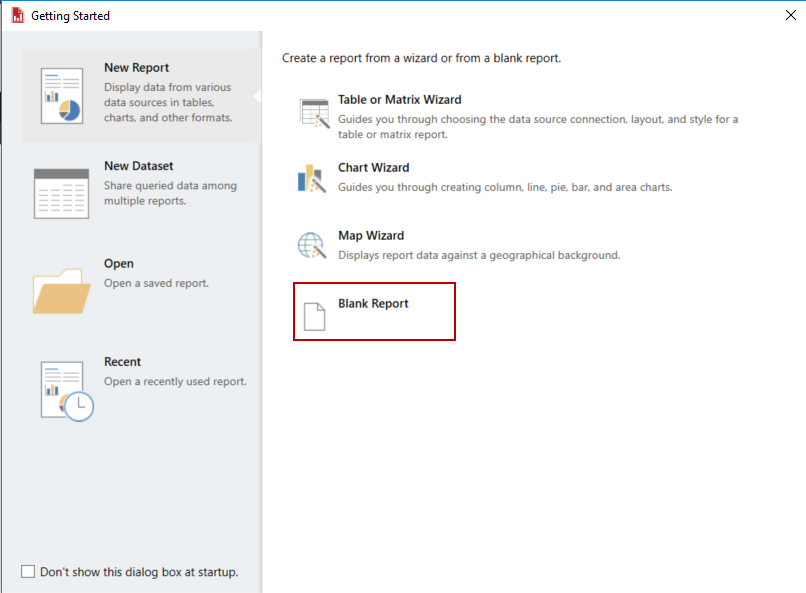
We will skip the SSRS report builder installation steps because it is pretty self-explainable. When we launch the report builder, “Getting Started” screen is displayed. In this screen, we have four options;
- New Report: In this tab, we can quickly create reports through the various wizard options or we can choose the blank report option. In the blank report option, we need to set some options manually
- New Dataset: This option enables creating shared-datasets
- Open: With help of this option, we can open reports which are stored in the folders or in the SQL Server Reporting Services
- Recent: In this tab, we can find out the reports created previously
We will select the Blank Report option and then report builder design page will appear.
The Report builder main screen is not very complicated and it allows us to create reports easily. Let’s demonstrate creating a report and learn much more about the SSRS report builder. In this demonstration, we will accomplish the following steps;
- Create a datasource connection
- Create a dataset
- Design report with report builder
- Deploy created report builder report to My Folder path
Create a datasource
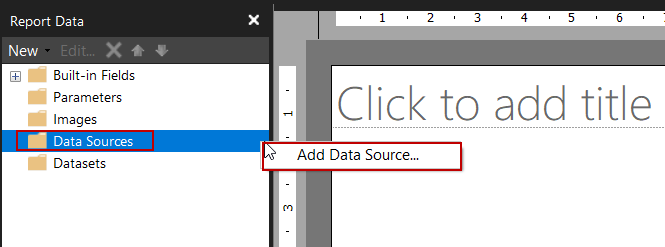
In the right side of the report builder we can see the Report Data panel which helps to manage Data Sources and Datasets and also in this panel we can manage report parameters and built-in fields. Now, we will create a connection between Azure SQL and report builder. Right click in the Data Sources folder and then select Add Data Source.
SQL Server Reporting Services allows us to use two types of connection methods;
- Use a shared connection or report model: In this method we can use a shared data source. This type of data sources helps us to avoid repeated data source because this type data source can be used number of times according to report user authorizations
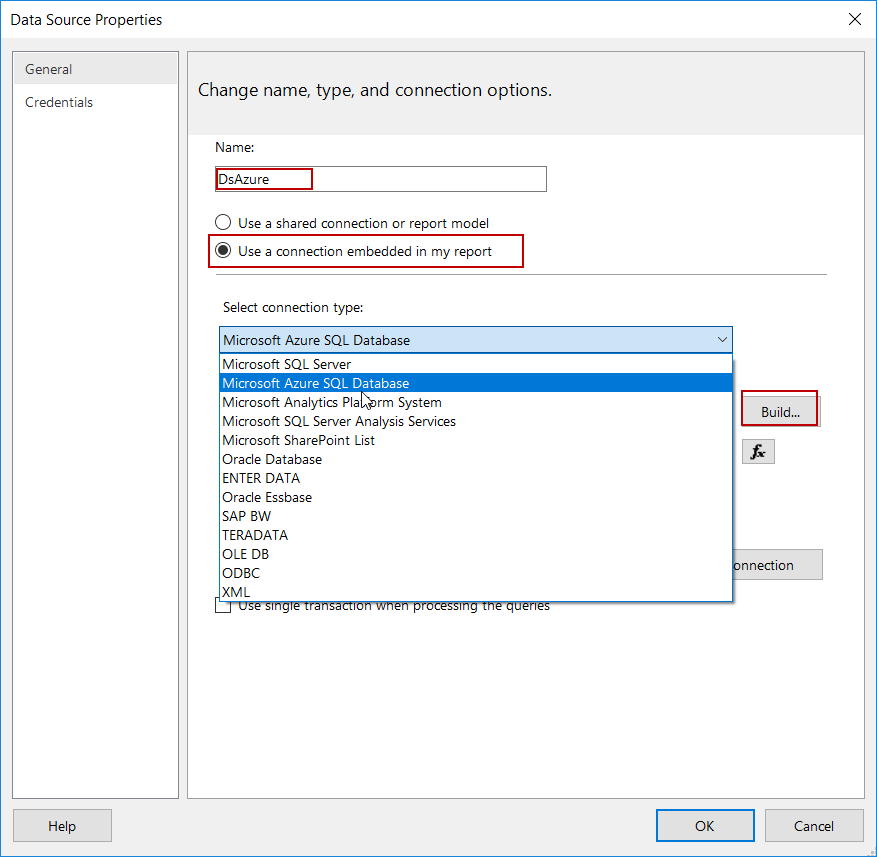
- Use a connection embedded in my reports: This method creates individual connection and also, we have to create connection in the report. Now, let’s return to our demonstration after this step, the Data Source Properties screen appears so we can add target data source which we want to connect. In this screen, we can find out various data sources, however we will select Microsoft Azure SQL Database and Use a connection embedded in my reports. We build click Build to set connection properties and credentials
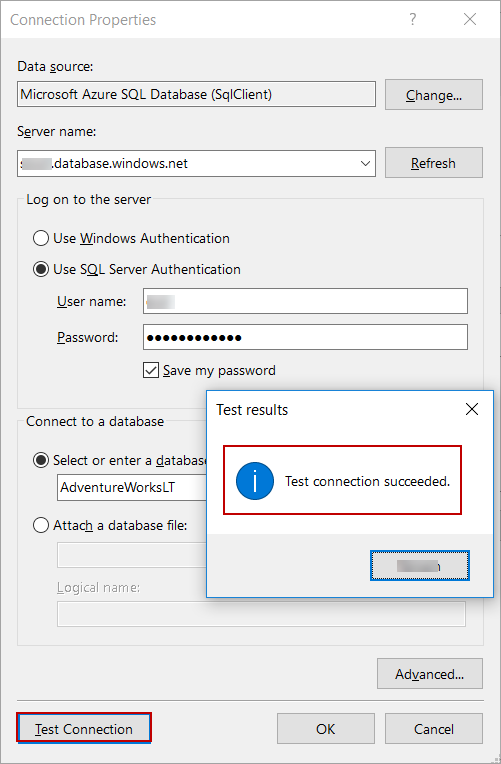
Fill the Server name and other required connection settings and then check the connection with Test Connection.
Create a dataset
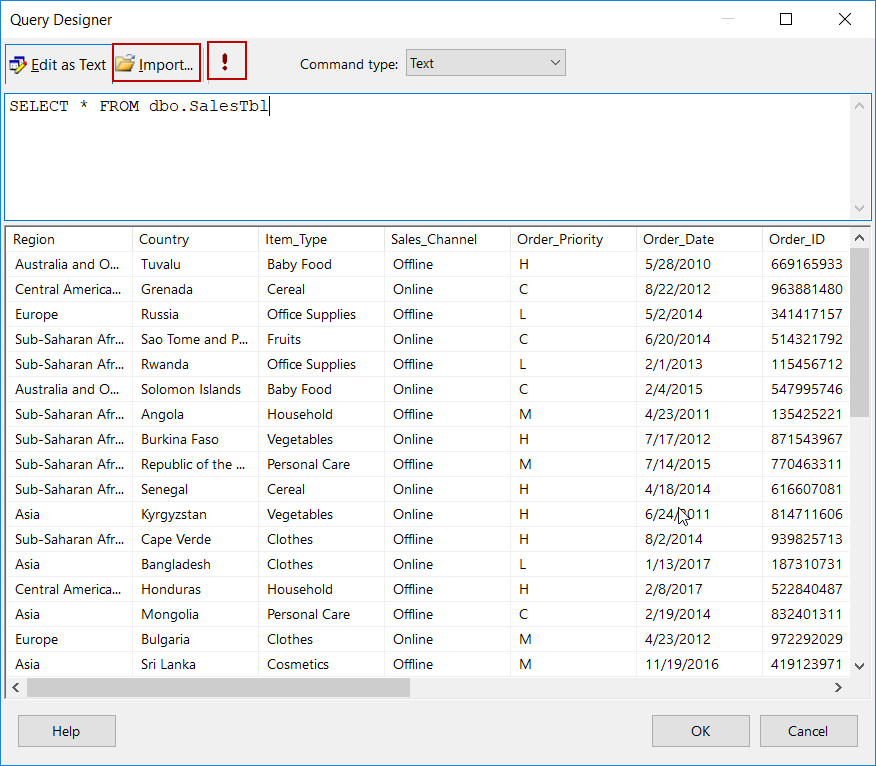
In this step we will create a dataset, we use datasets in order to retrieve data from target data source. Right click on Datasets folder and select Add Dataset… and then we will select a datasource which we created in the Create a datasource connection step and write a very basic query which returns all data of the SalesTbl
|
1 |
SELECT * FROM dbo.SalesTbl |
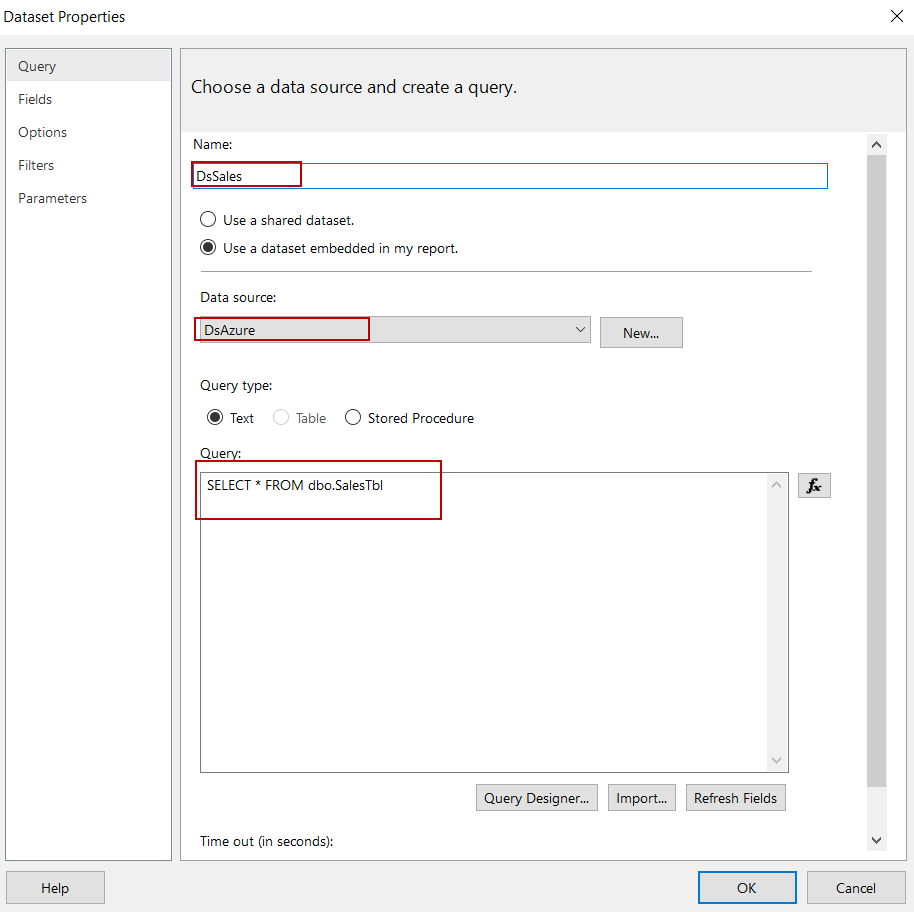
The Data properties screen includes various settings and configuration tab according to dataset. In the Query tab we can select data source and also we can manage the query types and text. If we click Query Designer, we can execute queries. The Exclamation mark (!) button executes the queries and we can also import prepared queries t-sql through import option.
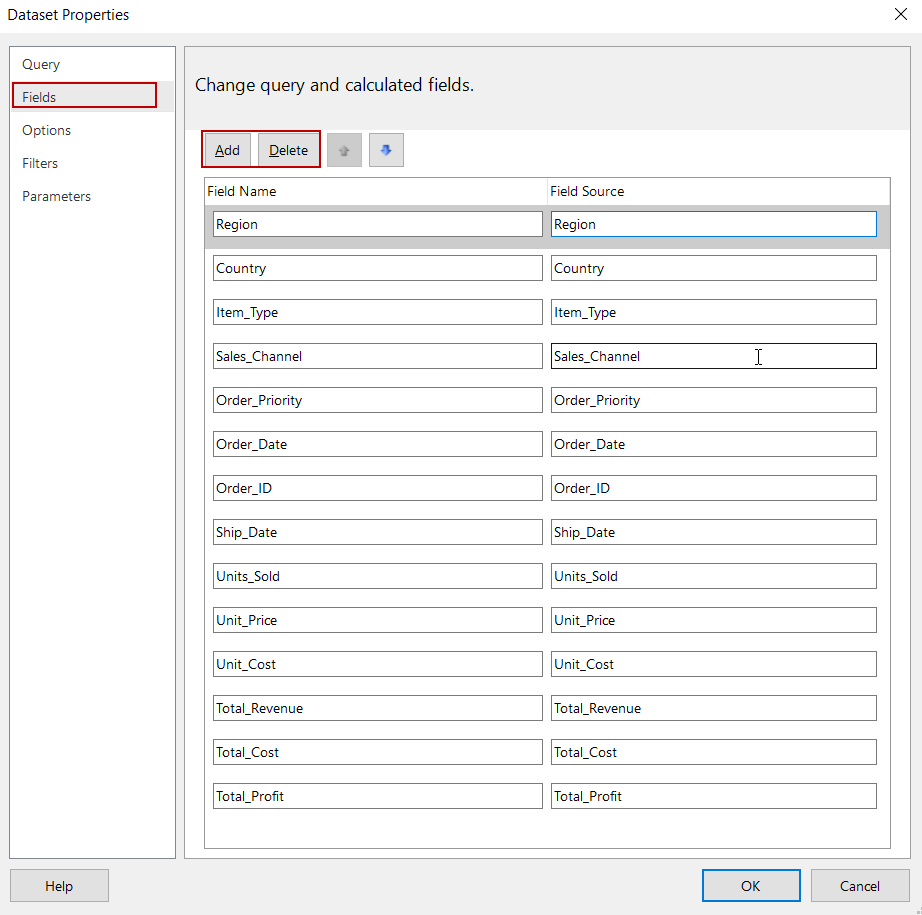
In field tab we can add and delete columns of the dataset and we can also change the columns names.
The Filter tab helps us to filter dataset with specified filter expression, this filter does not affect the dataset query. It only influences dataset rows after the query execution so query populates all data to dataset and the filter expression refines the data.
In the Parameter tabs, we can find out and define parameters which are related to dataset so we can use parametrized queries in the report builder dataset.
Designing a report
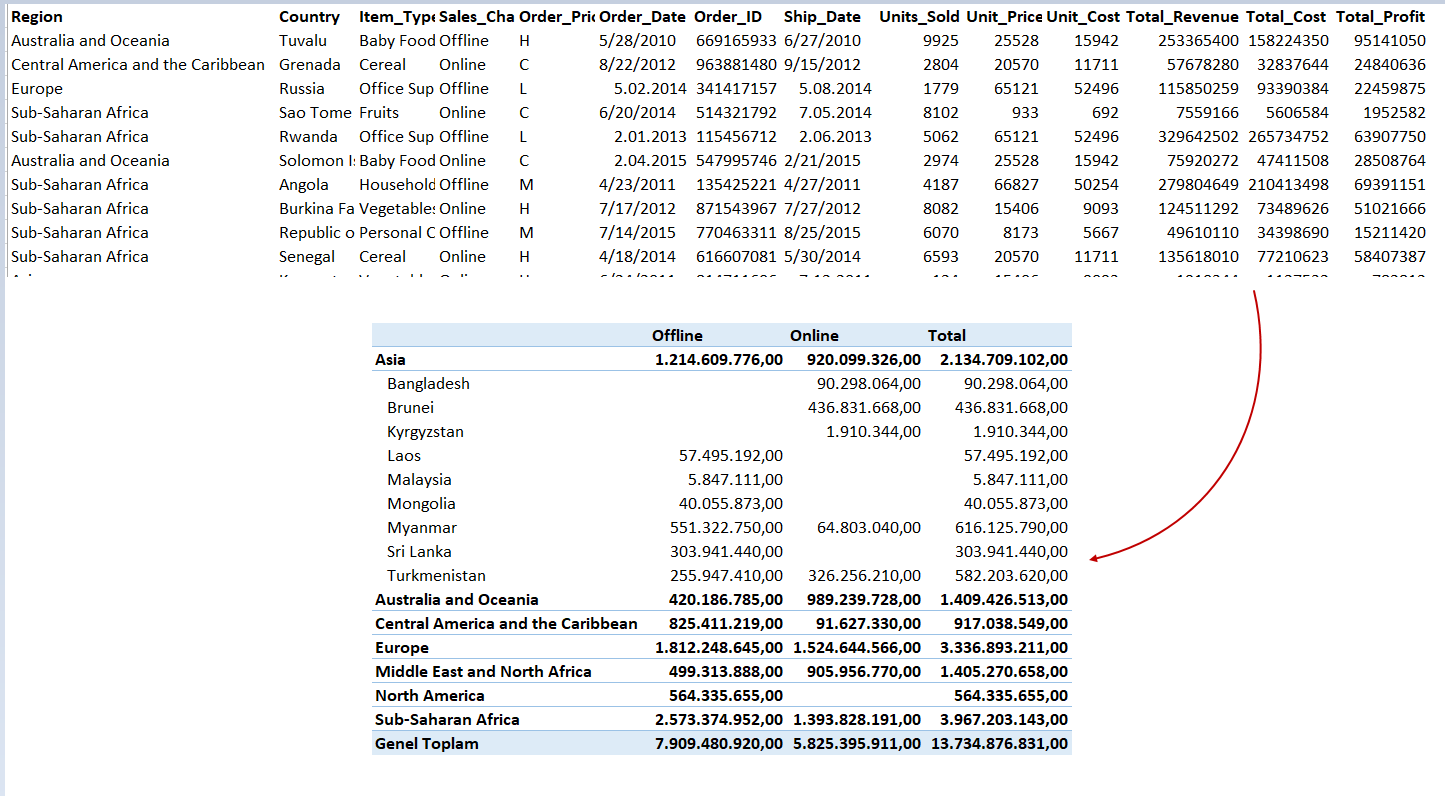
The Matrix helps us to aggregate data summaries such as excel pivot table. Through the matrix, we can group and summarize data in several formats. At the end of this section, our report design should look similar to following illustration.
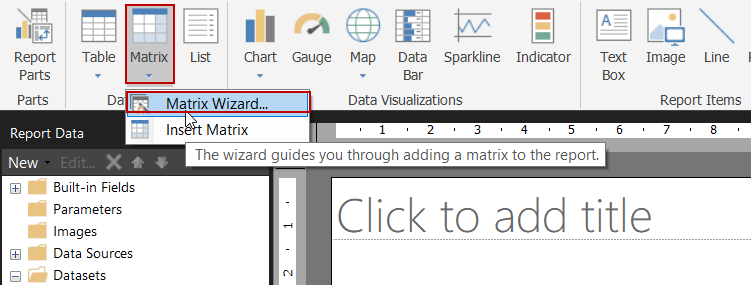
At first, we will select the Matrix Wizard in order to create a summarized report.
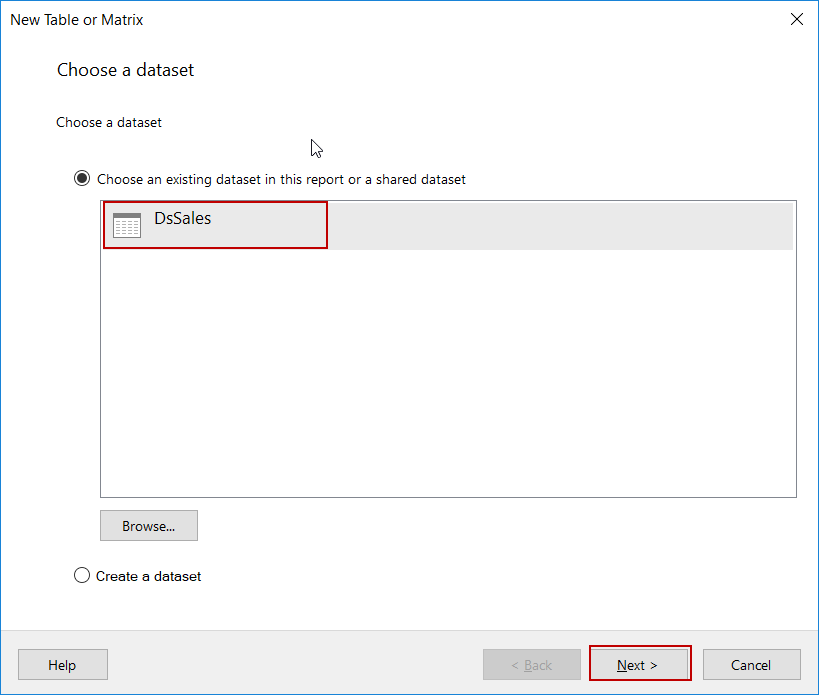
Select the dataset in which we want to display the data in summarized format.
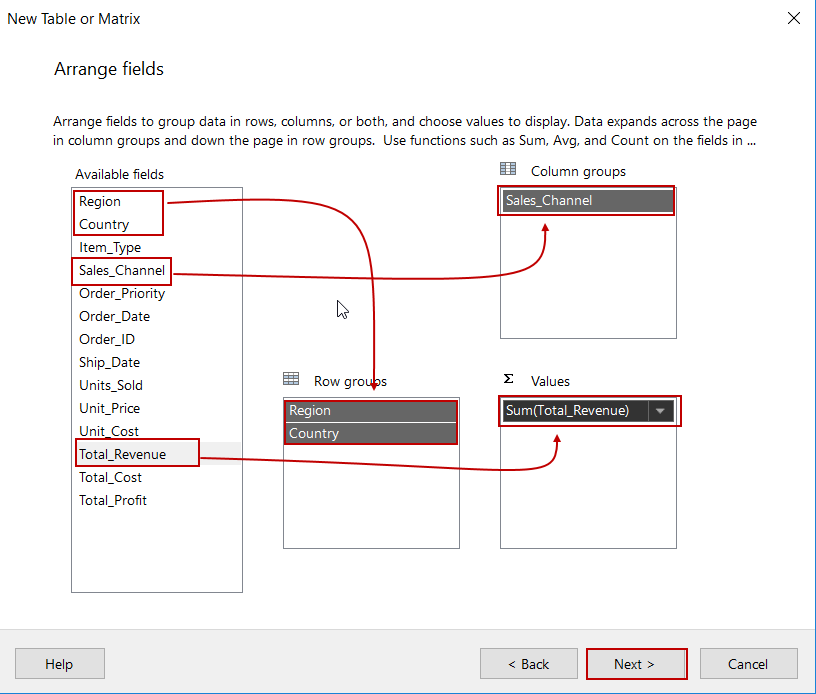
In the next screen, we will arrange the row and column we want to group and also we have to select column we want to aggregate in sum.
We will check the Expand/collapse groups in the layout screen in order to enable drilldown toggles so that report readers can use report interactively.
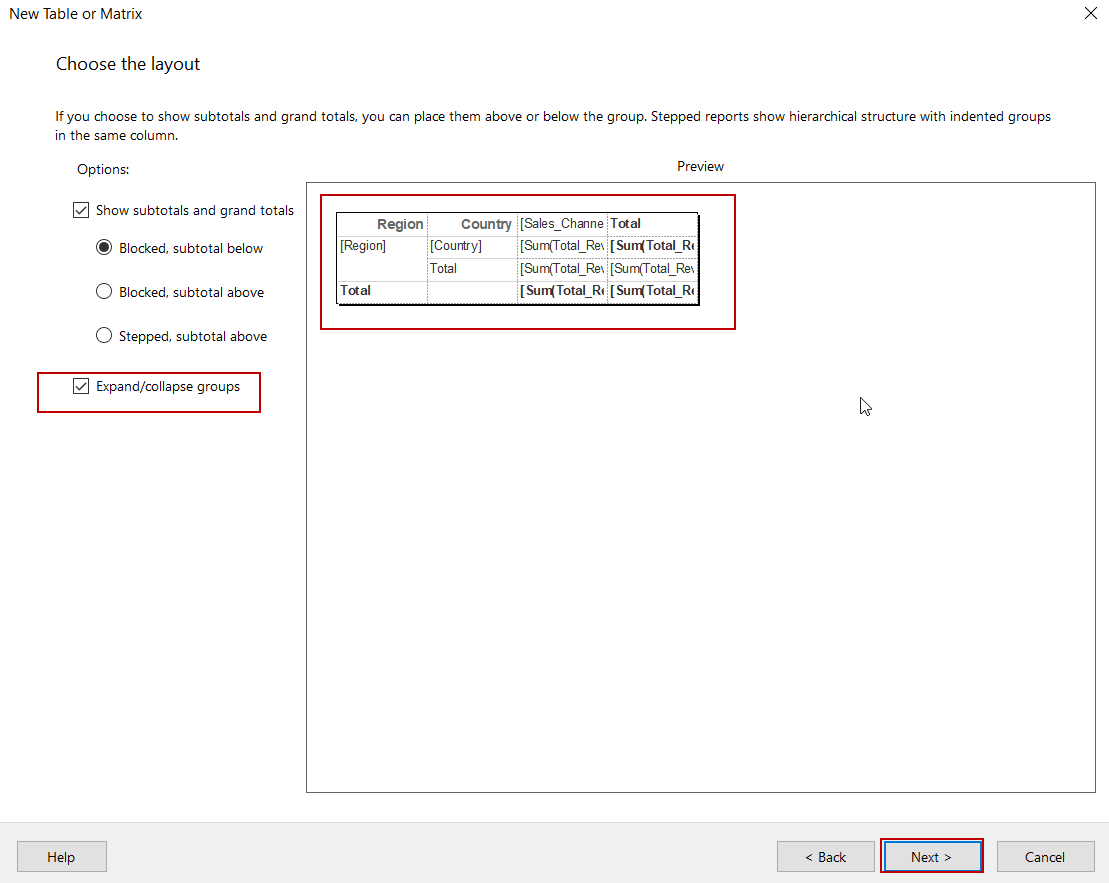
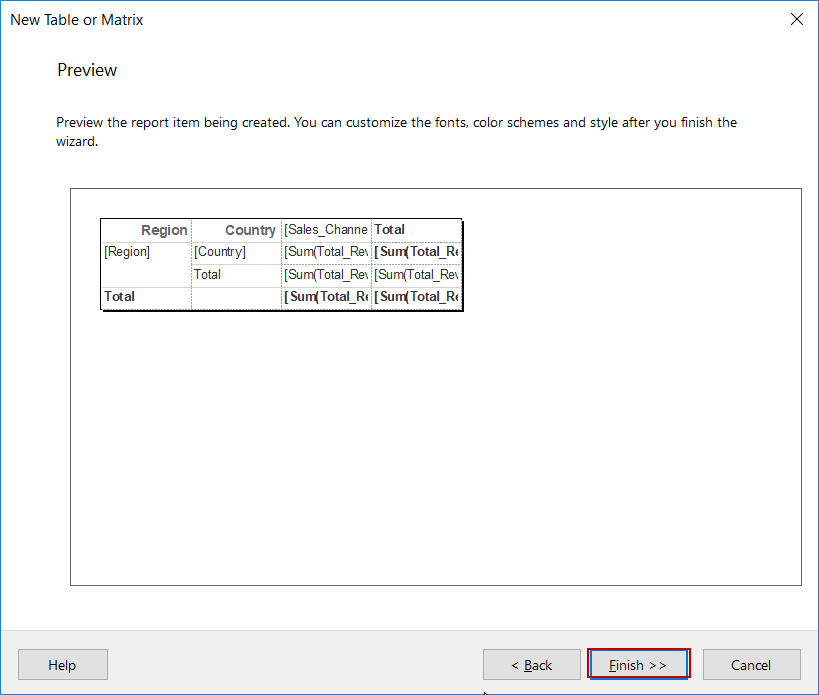
Click Finish
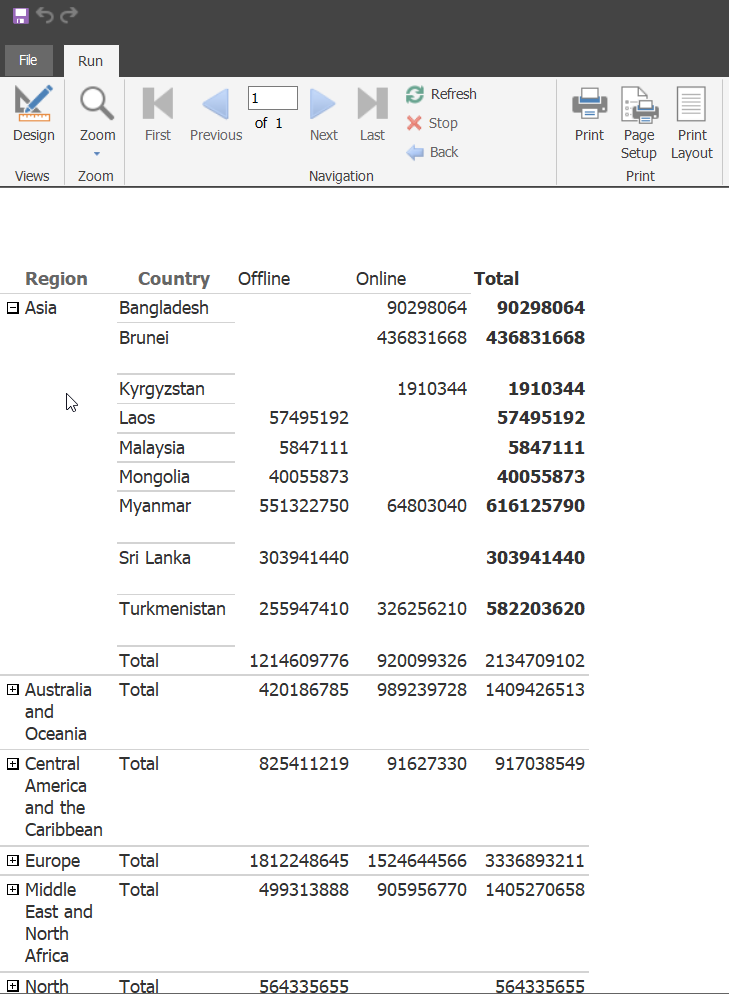
We will Run the report
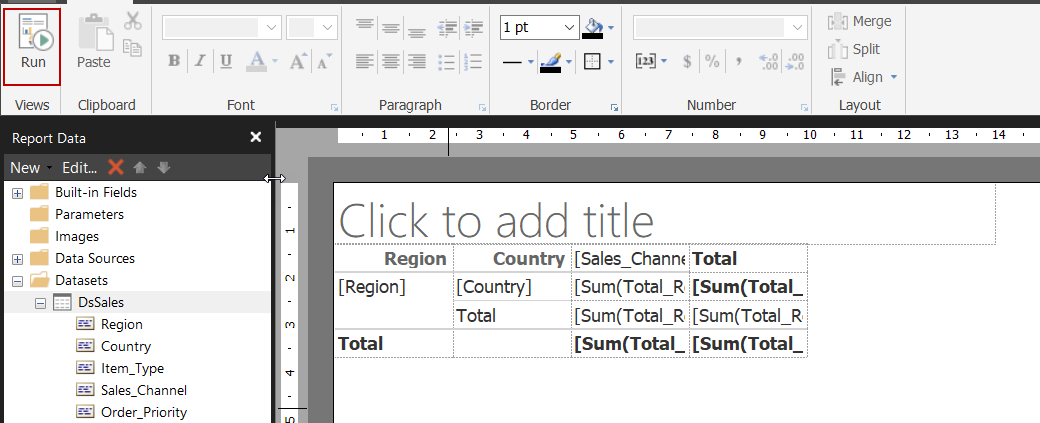
The output of the report will be as follows
We completed the report design but this report still needs some style improvements.
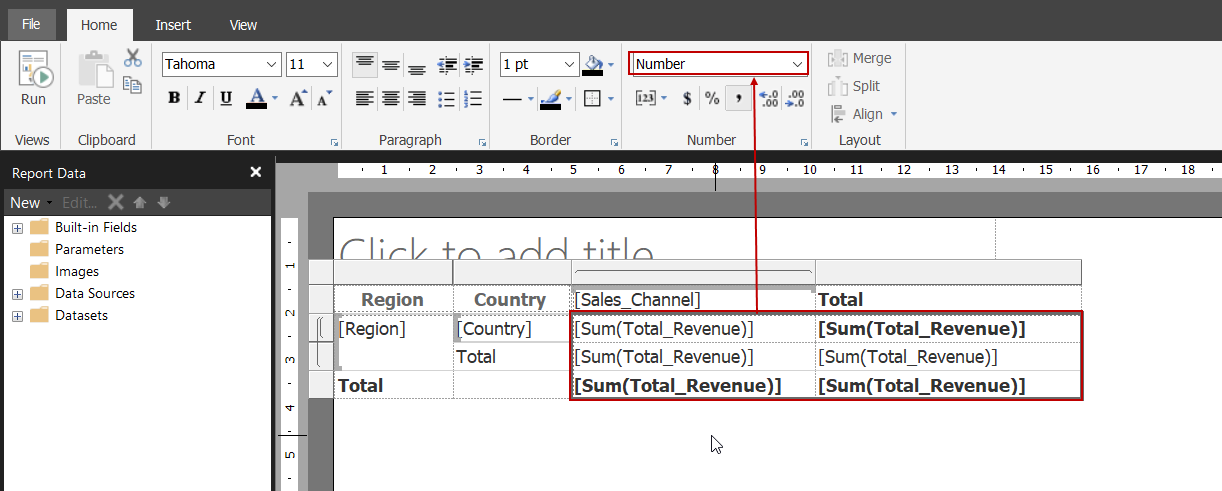
Select the numerical cells and then change the format of cells to Number.
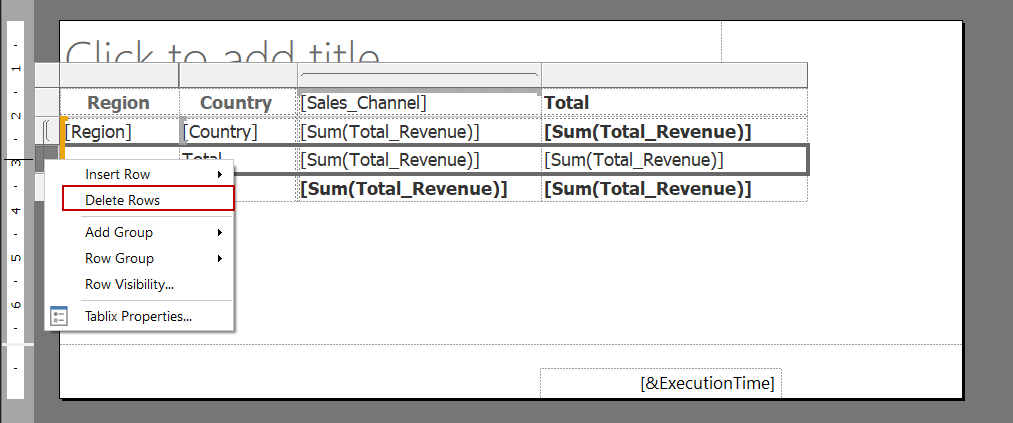
We will remove the Country subtotals row.
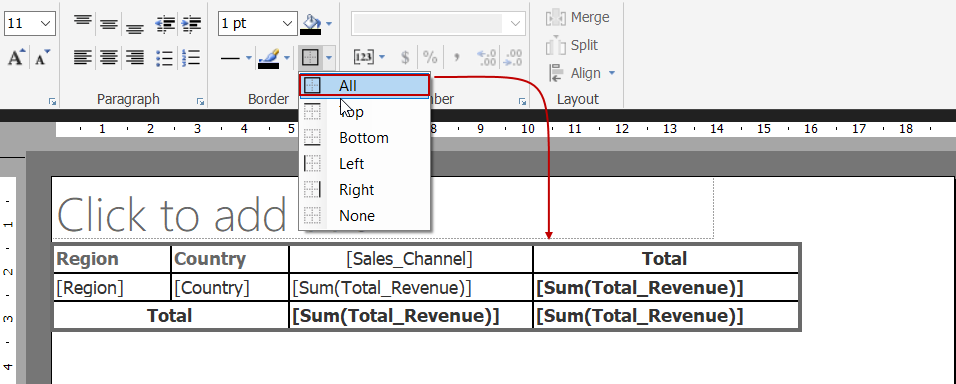
We will apply borders to cell so that the report layout will be shown smoother.
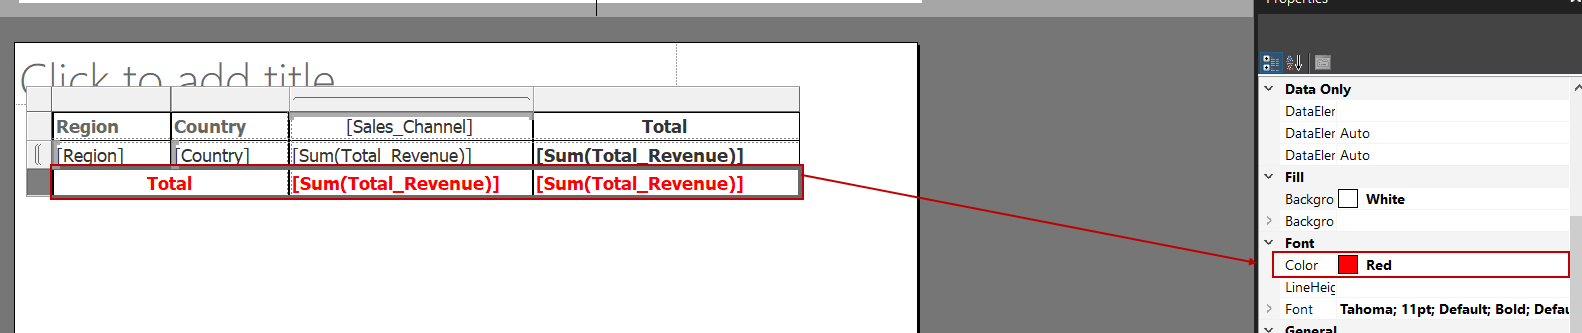
We will change the font color of the total row to Red.
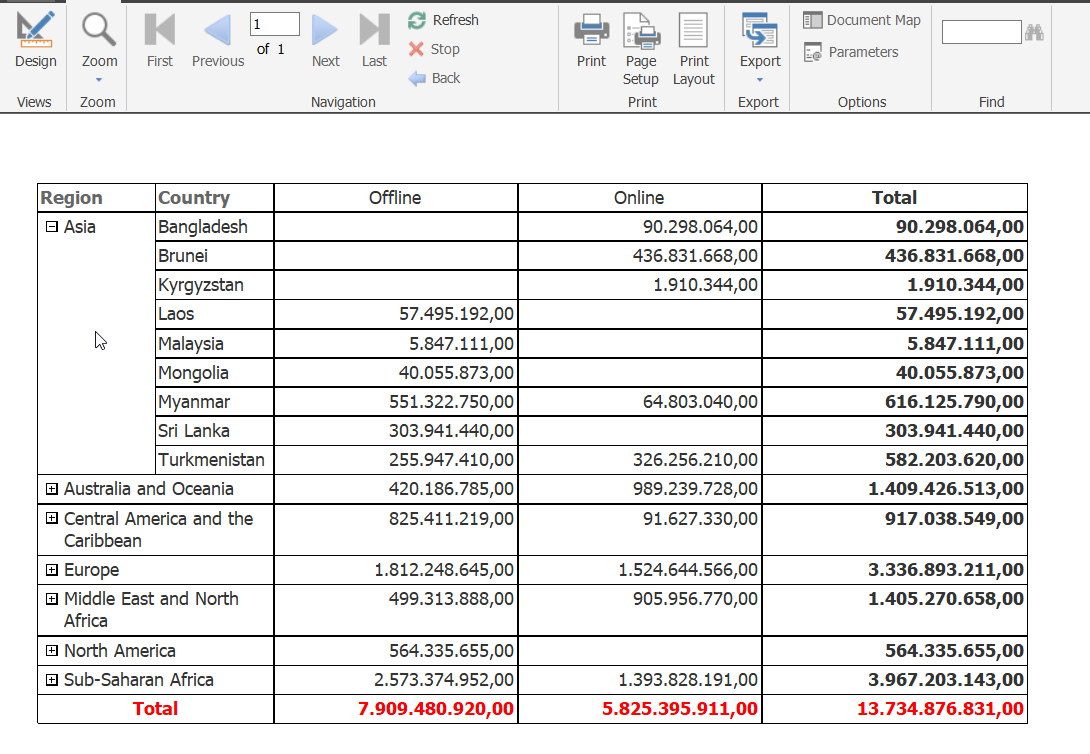
We will Run the report again.
Finally, we completed our design with SSRS report builder and now we will deploy this report to My Reports Folder. However, we need to enable My Reports folder.
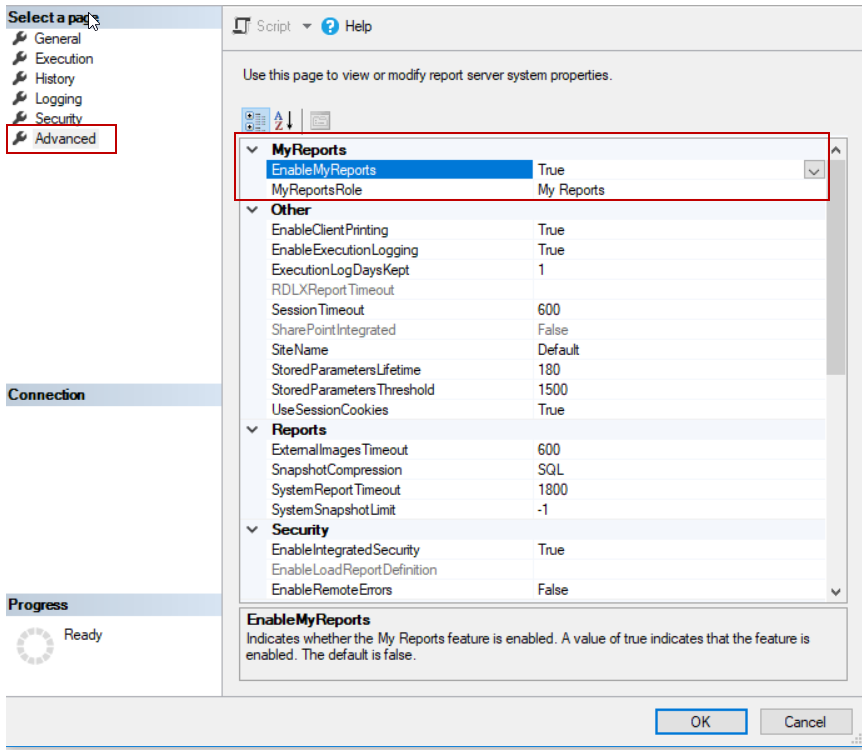
Connect to SQL Server Reporting Service through SQL Server Management Studio and then right click to report server. Navigate to advanced tab and set true to EnableMyReports parameter.
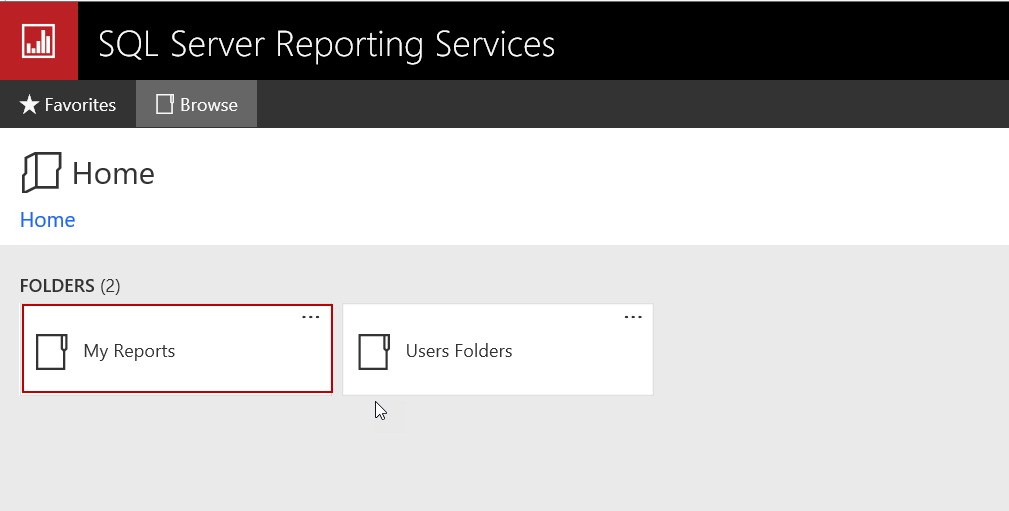
My Reports folder will be shown in the SSRS web portal.
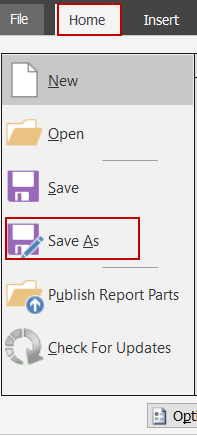
Now, we will publish the report to SSRS. Click the File menu and then select Save As and then connect to report server.
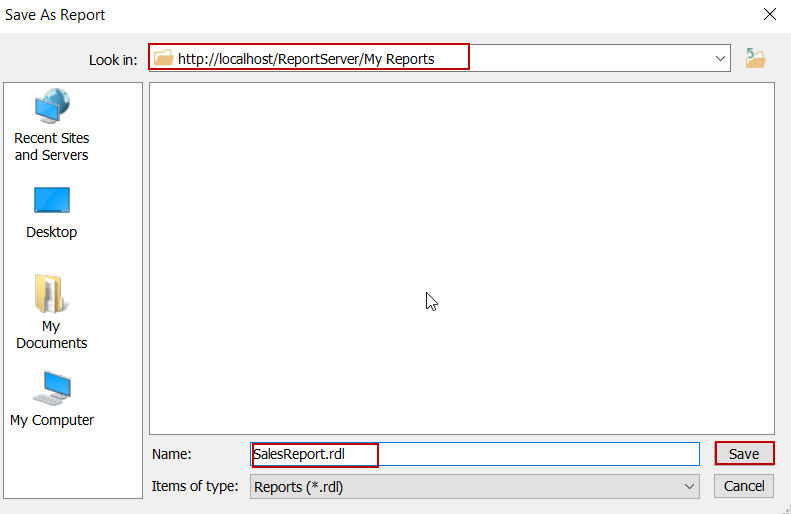
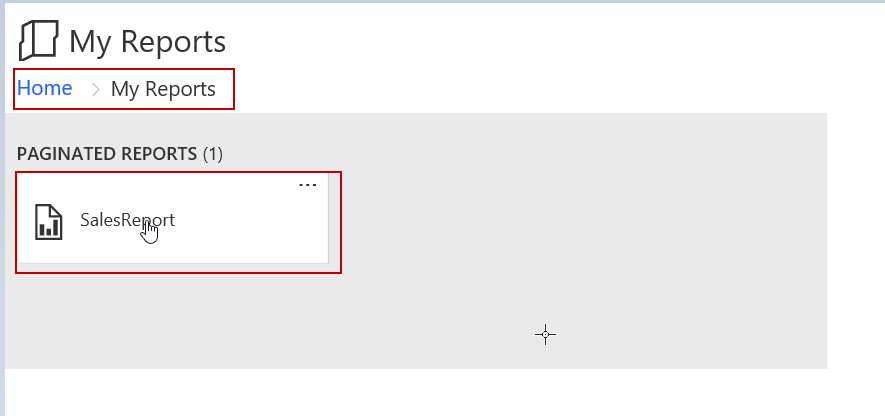
We can find out the report under the My Folder after the deployment process.
Conclusion
In this article, we mentioned about how to design SSRS reports with the SSRS report builder. The report builder comes to the forefront with easy usage so it takes more advantage in self-service BI implementations.

Most of his career has been focused on SQL Server Database Administration and Development. His current interests are in database administration and Business Intelligence. You can find him on LinkedIn.
View all posts by Esat Erkec
- SQL Performance Tuning tips for newbies - April 15, 2024
- SQL Unit Testing reference guide for beginners - August 11, 2023
- SQL Cheat Sheet for Newbies - February 21, 2023