
In this article, I am going to explain how we can easily debug Python scripts using the Visual Studio (VS) Code. In my previous article on this topic, I have explained how to set up a development environment to start coding in Python. I would definitely recommend reading that article if you have not setup your Visual Studio Code environment yet. This article can be considered as a continuation of the above-mentioned steps as I am assuming that you are already into programming in Python using the VS Code.
The need for debugging code
While we talk about how to debug Python scripts in VS code, it is essential for us to know why we should debug our code in the first place. Not only for Python, debugging is related to every other programming language in the world, starting from C, C++, JavaScript, and so on. In the software programming world, debugging is the process that allows the programmer to identify and locate bugs/errors in the existing code. Debugging is an integral part of any software development life cycle and sometimes it can take more time to debug code than to write the same.
Is debugging the same as testing?
Not really, debugging and testing are two different terms and should not be confused with one another. Let me clear this out. Suppose you are developing a new project and you have written all your code and as per the business requirements the code works well. Now, once you are done with the development, this code will be assigned to the QA engineer whose job is to test the application that you just developed. Let us assume that although the application works fine functionally, there is some issue due to which a calculation is being wrongly displayed. The QA engineer will then identify this as a defect/bug in your code and assign it back to you so that you can fix it.
Now, when you reproduce the code on your machine, your job is to identify the piece of code which is responsible for those calculations and identify the glitch in there. This process of identifying the correct code and trying to fix it with or finding another workaround is known as debugging. Although Visual Studio Code is capable of debugging most of the programming languages, we will use Python in this tutorial.
Debug Python scripts in VS Code
Assuming that you have already set up your Python development environment, let us now understand how to debug Python scripts from VS Code directly. I will begin by writing some sample code that can be used for demonstration purposes. Please note that we will only focus on debugging and writing the Python script is out of scope for this article.
Head over to the Visual Studio Code and create a new Python file. You can also use an existing file if you already have one. I am using the following code for demonstration purposes.
|
1 2 3 4 5 6 7 8 9 10 11 12 |
# Debugging simple variable statements. number = 100 print(f'Number is {number}') number = 500 print(f'New Number is {number}') # Debugging a for loop userList = ['Rob','Dave','Fred'] for user in userList: print(user) |
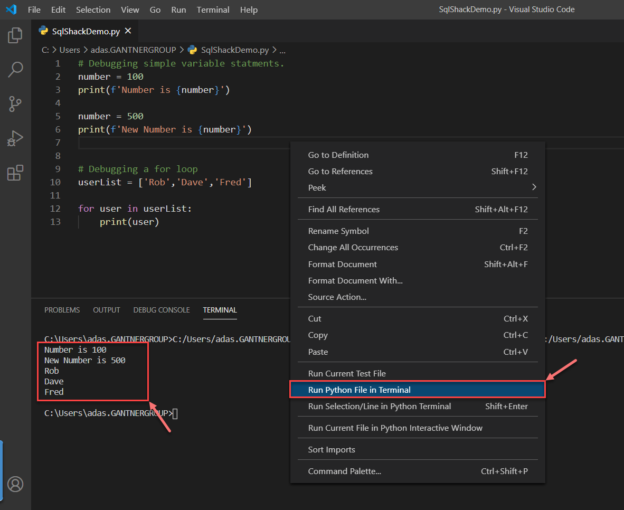
As you might be aware, you can just run this code by simply selecting Run Python File in Terminal from the context menu or by clicking on the Run icon on the top right corner. The following will be the result after the script is successfully executed.

Figure 1 – Executing Python Code in the Terminal
Now that we know our code is executed, we can go ahead and run the debugger to test the code and the execution flow as well. You can start the debugger in the following ways.
- Select Start Debugging from the Run menu
- Selecting the Run icon from the left pane and click on Run and Debug
- Pressing F5 on the keyboard
I would like to go with the second option and hit Run and Debug.
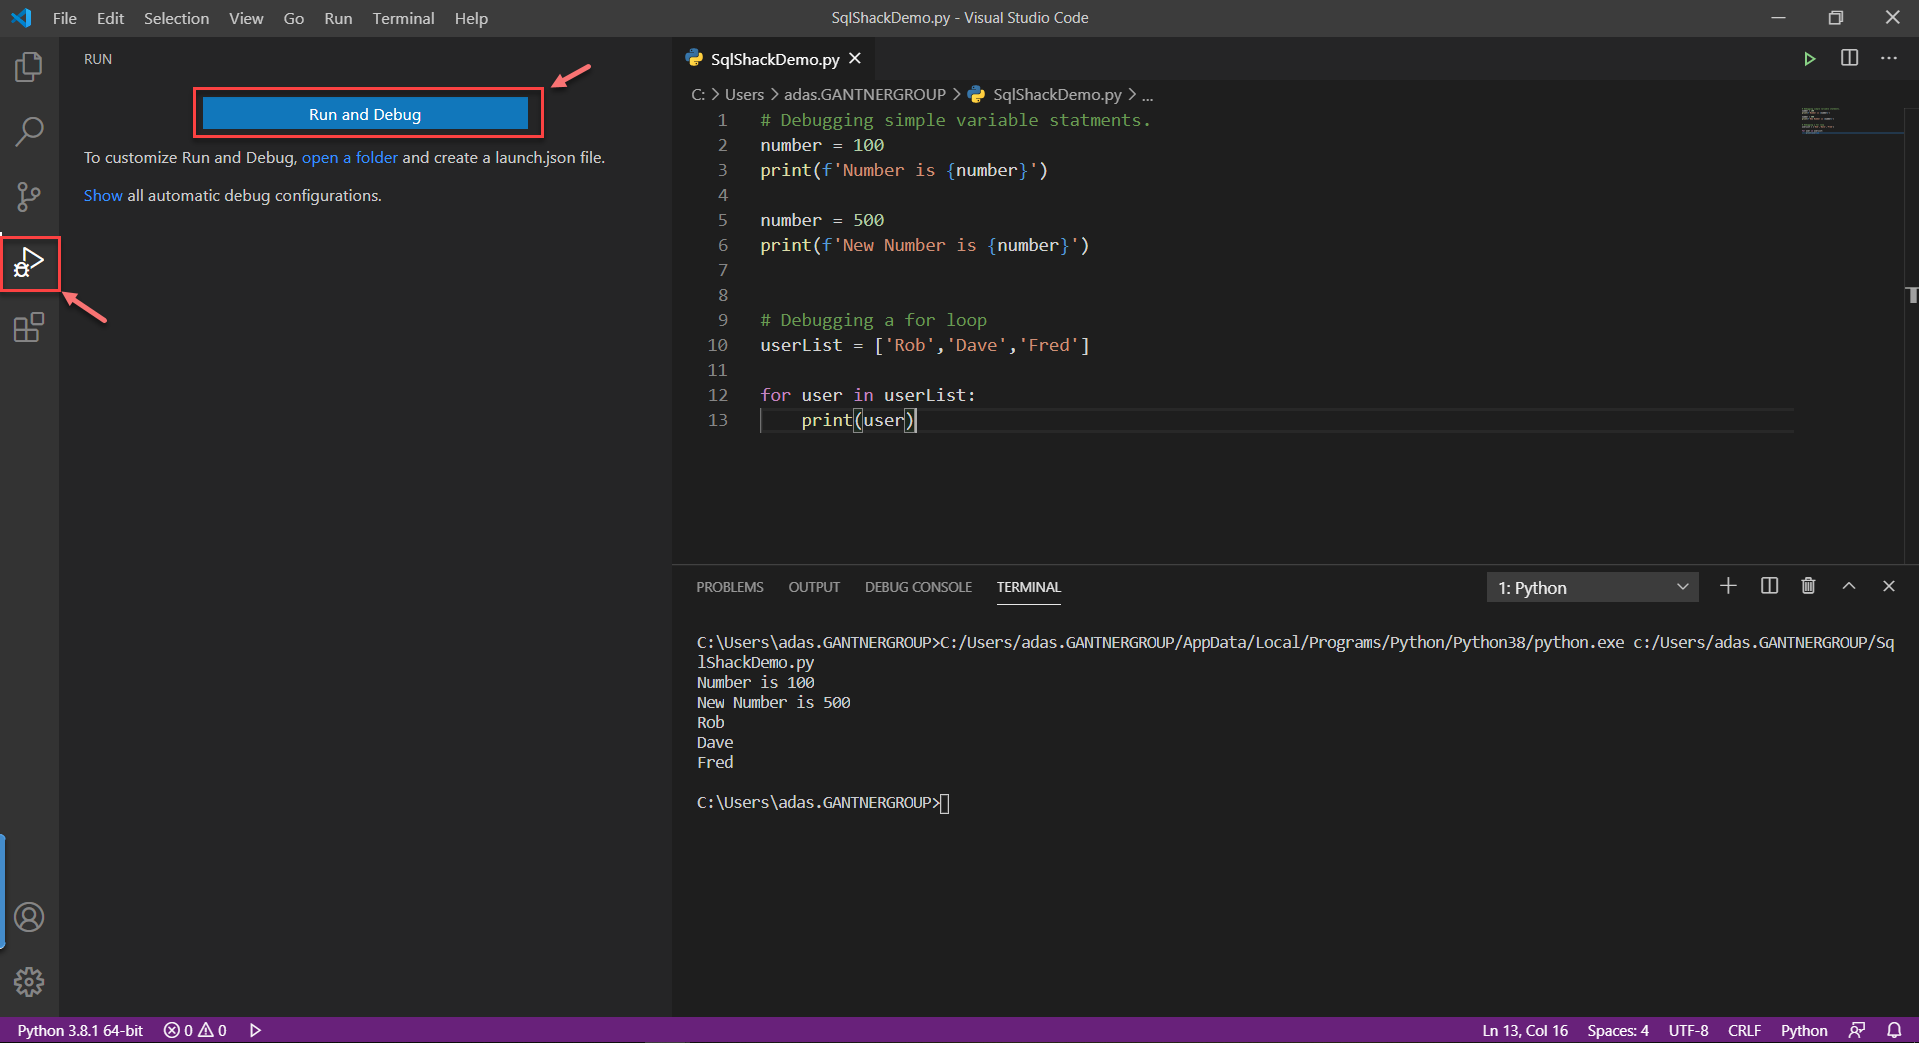
Figure 2 – Debug Python Scripts in VS Code
As soon as you hit the Run and Debug button, a popup will appear in VS Code which will prompt you to choose the Debug Configuration that you would like to use. Let us go ahead with the Python File option for the time being. You can select other debug configurations based on the application that you are working with.
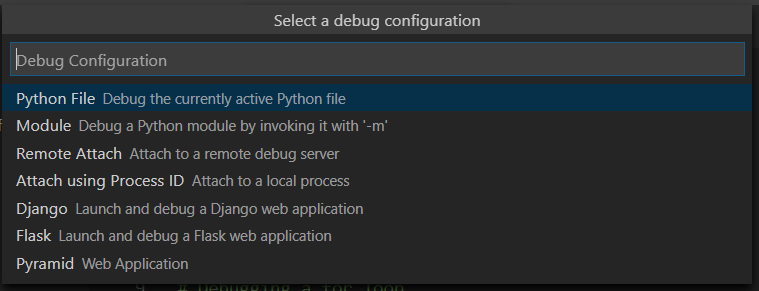
Figure 3 – Selecting Debug Configuration in the VS Code
As you select the debug configuration in Visual Studio Code, you can see that the Terminal window opens up from the bottom and the debugger starts executing your code.
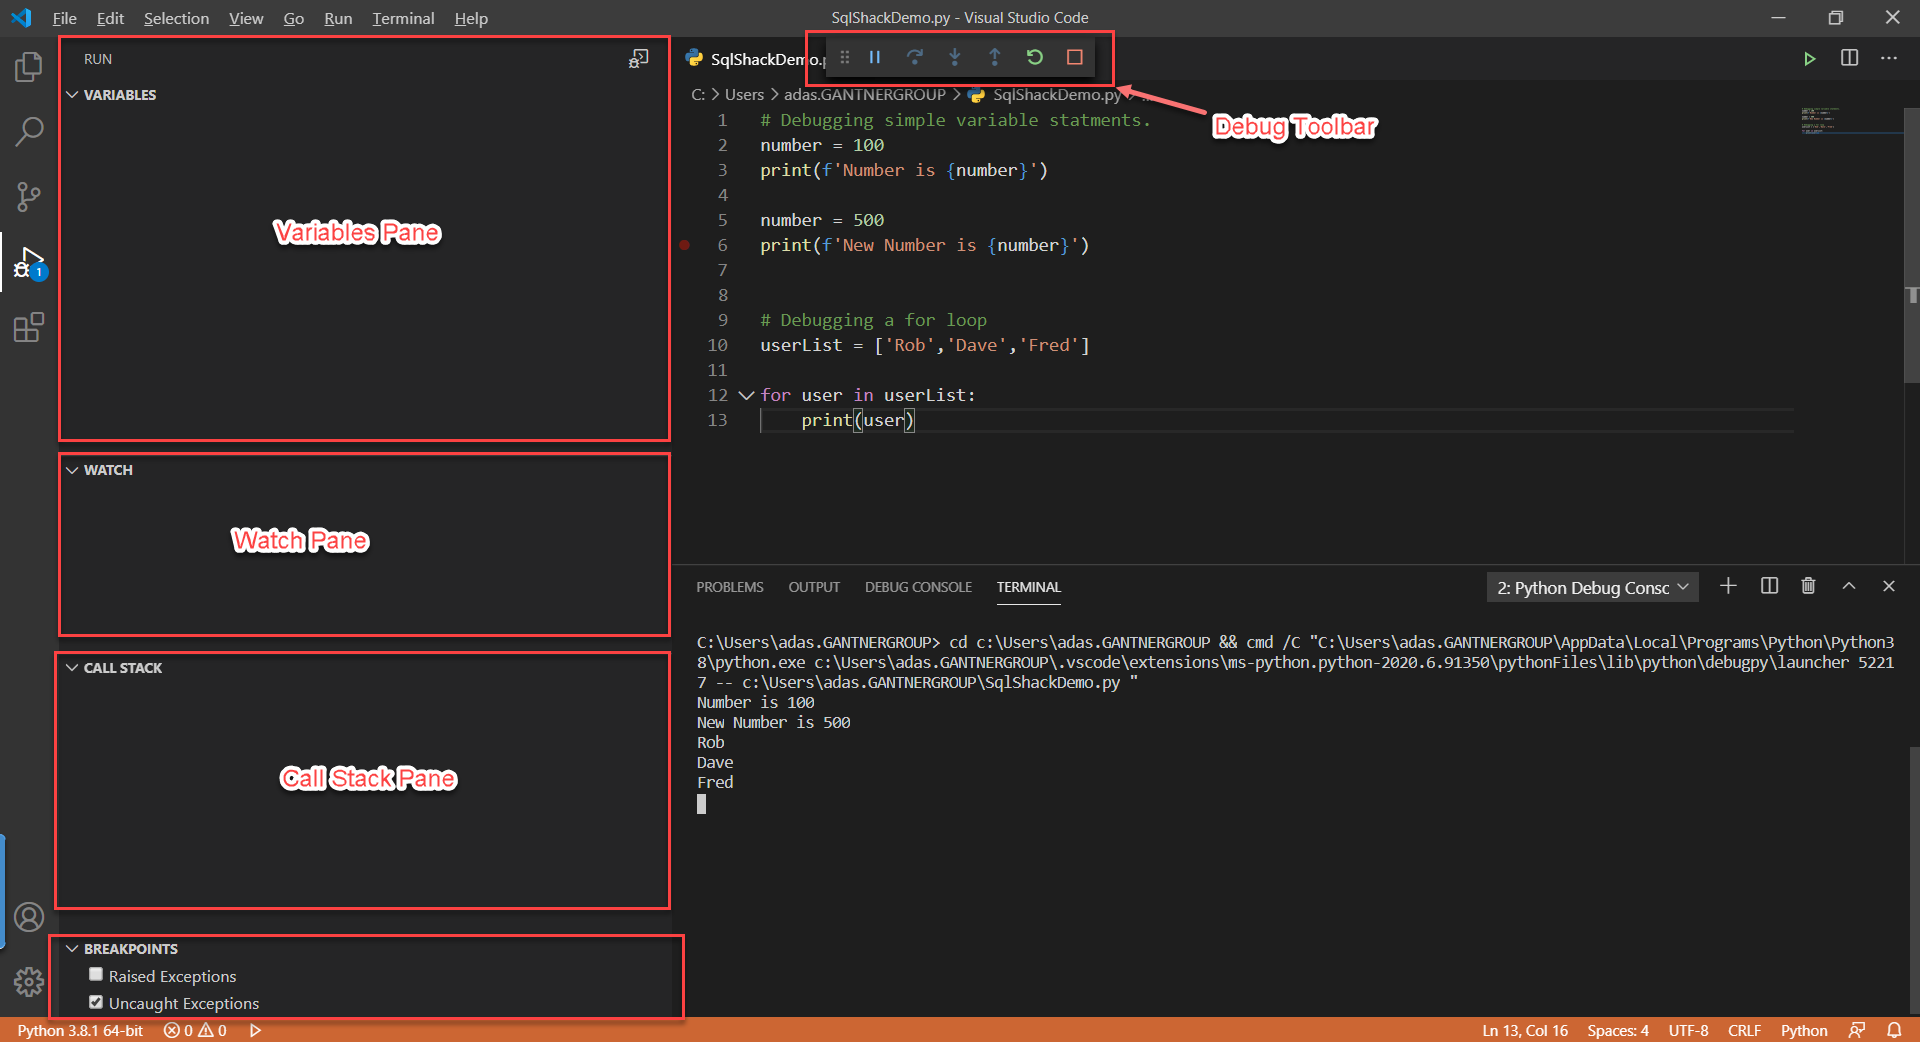
Figure 4 – Debugger started
Let me quickly explain the various areas that you can see on the screen.
Debug Toolbar – This is the main toolbar that allows you to navigate along with your code as you try to debug it. There are six actions on this toolbar which are as follows:
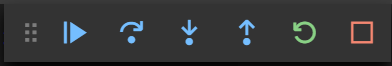
Figure 5 – Debug Toolbar
- Continue/Pause (F5) – Allows you to pause or continue the debugging process
- Step Over (F10) – Allows you to move over to the next line of code
- Step Into (F11) – Allows you to enter inside a different method during debugging
- Step Out (Shift+F11) – Allows you to move to the parent stack
- Restart (Ctrl+Shift+F5) – Restarts the debugging session from the beginning
- Stop (Shift+F5) – Stops the debugging session
Variables Pane – Using the variables pane you can easily inspect the data elements within your program. When you start debugging a lot of system-defined variables are initiated along with the user-defined variables. During the debugging session, you can verify the values of each of those variables from this pane.
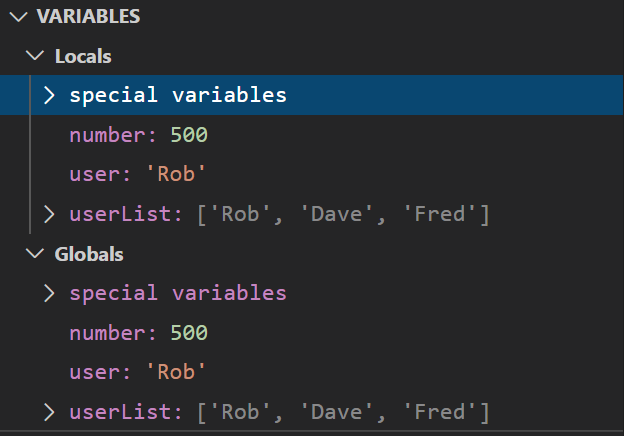
Figure 6 – Variables Pane in the VS Code
Watch Pane – Sometimes you may write a program with hundreds of variables within it. It is not possible to monitor the values of all those variables from the Variables pane as mentioned above. In such a case, you might want to monitor only one or two variables of your choice leaving the worry about the rest. You can add those variables to your watch list, and you can easily monitor the status and the values for those particular variables within this pane.
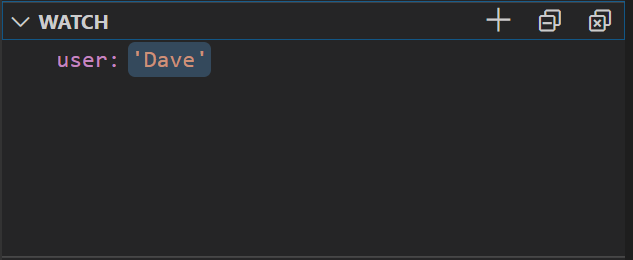
Figure 7 – Watch Pane in VS Code
Call Stack Pane – This is helpful when your code has a lot of inner methods and you navigate deep inside a stack and then you might lose track of your stack. When there is any error in your program you can easily know from which stack is the error has occurred and then debug it accordingly.
Breakpoints – This is an important concept while debugging code in any language. You may notice that while you initially started the debugger session, the terminal just executed the script and the debugging session stopped automatically. What if you want to stop the debugging session at some particular line and monitor the variables closely? In such a case, the breakpoints come to our rescue. You can attach a breakpoint to any line by just click on the left of the line number. A red dot will appear which means that the breakpoint has been defined for that line. The next time when you debug, you can see that the program stops the execution at the line and waits for your command. You can now use the Debug Toolbar to navigate along with your code.
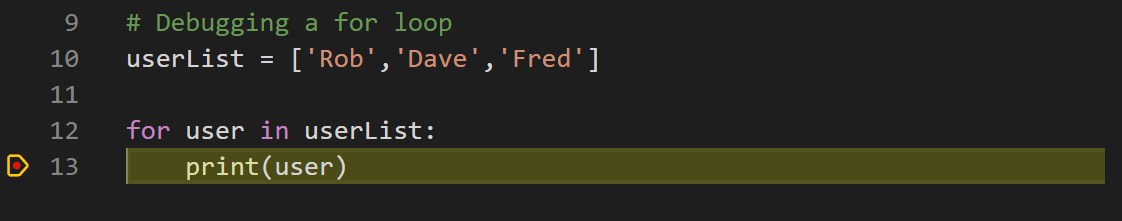
Figure 8 – Breakpoints in VS Code
Conclusion
In this article, we have talked about the various topics on how to debug Python scripts in Visual Studio Code. As already discussed, Visual Studio Code is by far one of the simplest, yet powerful tools from Microsoft and used by many developers for the development of their applications. While writing complex applications, it often becomes a pain point to identify bugs in the existing system. In order to understand the complete flow and remove those bugs, debugging helps us to identify those pain points and understand them with more details about the execution flow of the application. Debugging should be considered as one of the core parts of any application development.
Table of contents

He is a prolific author, with over 100 articles published on various technical blogs, including his own blog, and a frequent contributor to different technical forums.
In his leisure time, he enjoys amateur photography mostly street imagery and still life. Some glimpses of his work can be found on Instagram. You can also find him on LinkedIn
View all posts by Aveek Das
- Getting started with PostgreSQL on Docker - August 12, 2022
- Getting started with Spatial Data in PostgreSQL - January 13, 2022
- An overview of Power BI Incremental Refresh - December 6, 2021