

In this article, we will learn how to build a customized widget in Azure Data Studio that helps to monitor the performance metrics.
What is Azure Data Studio?
Azure Data Studio (ADS) is a new generation database administration, development, and maintenance environment that can be used for on-premises and cloud data platforms. Azure Data Studio’s target user group is not just limited to database administrators, it also aims at the software developers or other non-DBA users who deal with the databases as part of their jobs. Such as, one of the standout features of ADS is that it is easily customizable and can also gain new features via extensions. If we give an example, after installing the PostgreSQL extension, we can connect any PostgreSQL (also known as Postgres) database and execute the PL/pgSQL queries.
Another capability of the ADS is that it can work on multiple operating systems:
- Windows
- macOS
- Linux
SQL Server Management Studio’s (SSMS) initial release was published in 2005 and until the announcement of the ADS, it was the alone SQL database management and development tool of Microsoft. Nowadays, some are already starting to think that Azure Studio will run rings around SSMS. However, these two tools have advantages and disadvantages over each other but the following little touches of Azure Studio seem to have made it more attractive:
- Export Results to CSV, JSON, XLSX
- Generating customized dashboards easily
- Dark theme configuration ( The dark theme can be set in SSMS to use the config files)
Despite this, SQL Server Management Studio still offers unique features:
- Provides to configure and manage Always On through user-friendly interfaces
- Error log viewer
- Advanced Extended Events management
-
Can connect to:
- Analysis Services
- Integration Services
- Reporting Services
How to create a custom widget in Azure Data Studio
One of the most advantageous features of ADS is that it allows the creation of customized widgets. With the help of the widgets, we can easily visualize the result of the queries using different graph types. In this context, building the performance monitoring widgets can be a reasonable approach so that we can track the performance metrics readily. Now, let’s learn how to build a custom widget with a very straightforward example.
The sys.dm_exec_requests dynamic management view returns the info about each request that is executing in SQL Server. The wait_type column is one of the important columns of this view that define which source the currently executing query is waiting for.
Tip: SQL Server wait types are one of the significant performance metrics and they are used to monitor the resource bottlenecks and diagnose the performance problems of the SQL Server.
The following query aggregates the wait times of the wait stats so that we can figure out which resource causes a bottleneck at present.
|
1 2 3 4 5 6 7 8 9 10 11 |
SELECT DER.wait_type,SUM(DER.wait_time) AS [Wait Type] FROM sys.dm_exec_requests AS DER JOIN sys.databases AS DB ON DER.database_id = DB.database_id JOIN sys.dm_exec_sessions AS DES ON DER.session_id = DES.session_id WHERE NOT DER.status IN ('background', 'sleeping') AND DER.wait_type IS NOT NULL GROUP BY DER.wait_type |
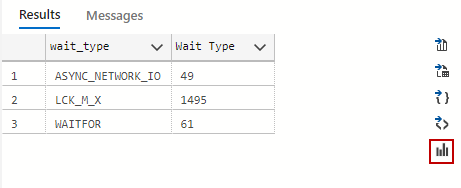
In the result panel, we click the chart button and select the following properties to customize the chart.
Chart Type: Doughnut
Data Direction: Vertical
Use column names as labels: true
Legend Position: Top
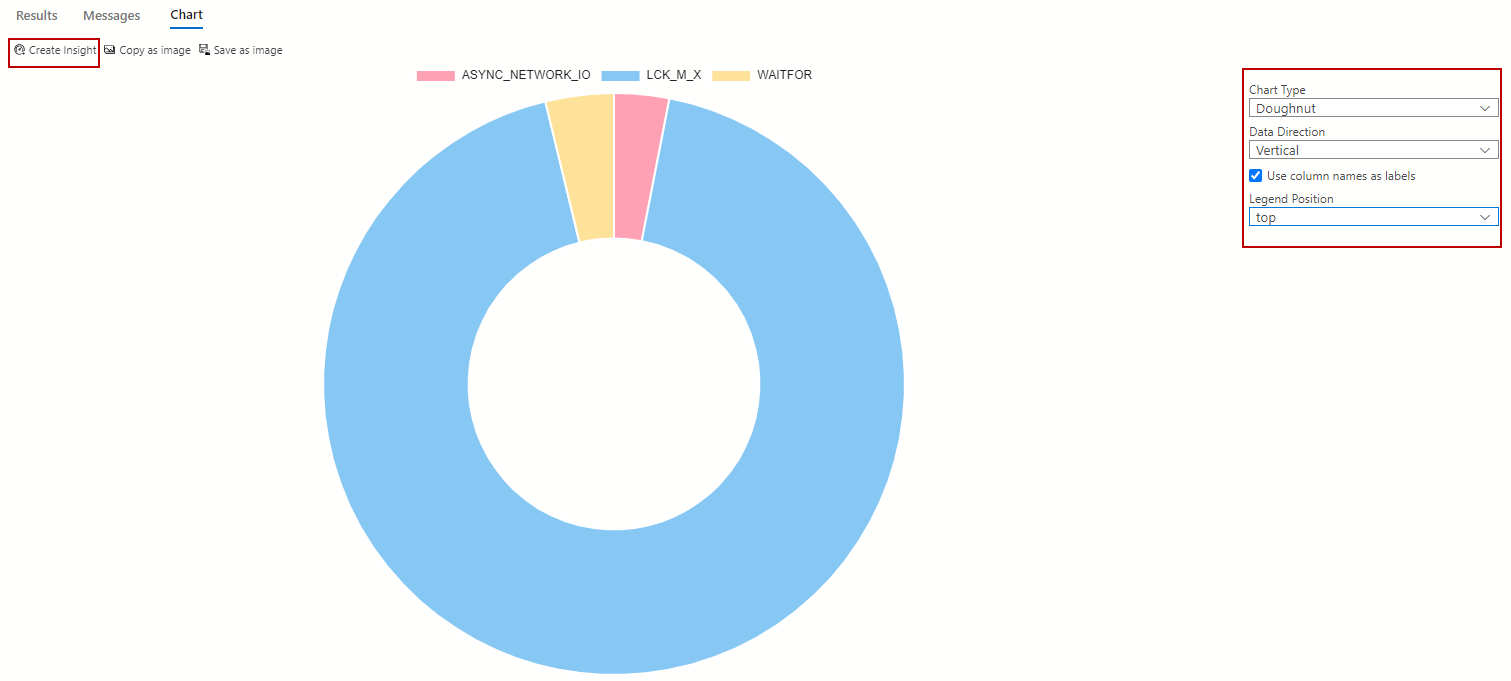
A widget infrastructure uses JSON format to visualize query resultsets. To obtain the JSON of this chart, we will click the Create Insight button, and then the JSON of the chart appears on another screen.
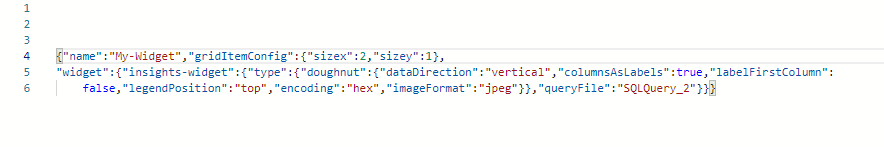
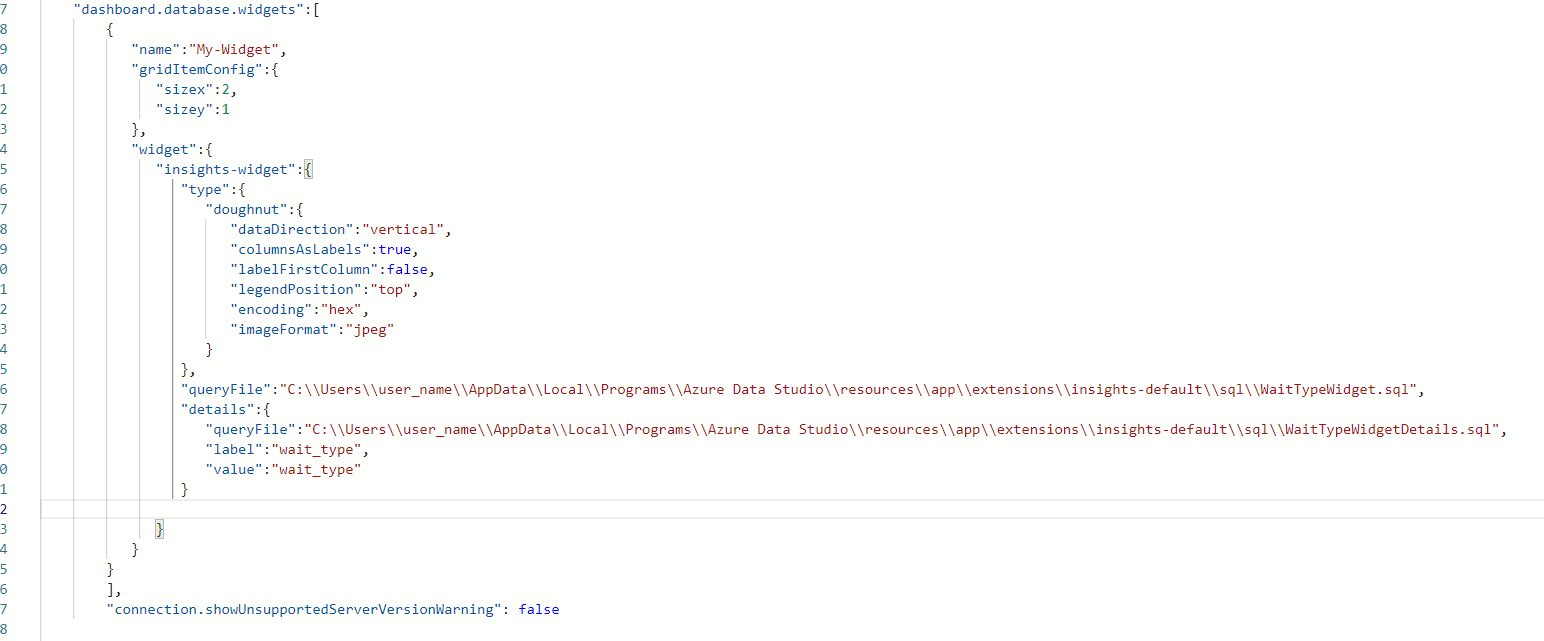
We need to store the query in a specific folder so that the chart can use this query every time the chart is viewed or refreshed. We delete the SQLQuery_2 value of the queryFile key and then place the query file path instead of it. After these steps, the JSON will be as follows:
|
1 2 3 4 5 6 7 8 9 10 11 12 13 14 15 16 17 18 19 20 21 22 |
{ "name":"My-Widget", "gridItemConfig":{ "sizex":2, "sizey":1 }, "widget":{ "insights-widget":{ "type":{ "doughnut":{ "dataDirection":"vertical", "columnsAsLabels":true, "labelFirstColumn":false, "legendPosition":"top", "encoding":"hex", "imageFormat":"jpeg" } }, "queryFile":"C:\\Users\\user_name\\AppData\\Local\\Programs\\Azure Data Studio\\resources\\app\\extensions\\insights-default\\sql\\WaitTypeWidget.sql" } |
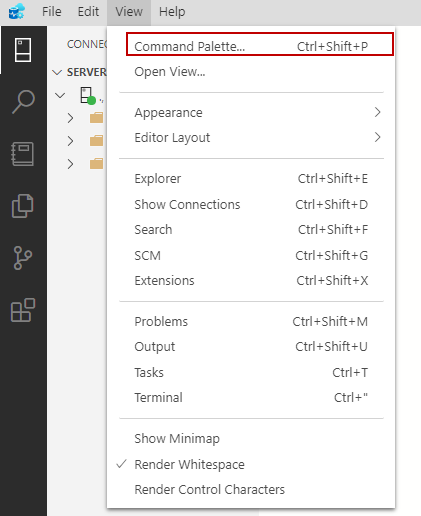
As the second step, we need to inject the chart JSON that we have prepared into the Azure Data Studio user settings file. We will click the View menu and then click the Command Palette… menu item.
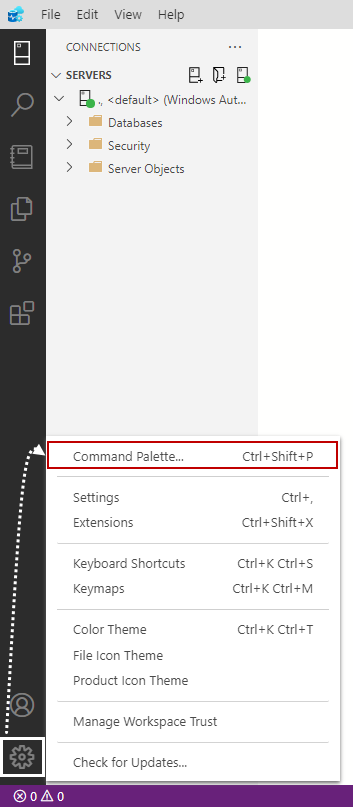
As an alternative way, we can click the Manage button and then click the Command Palette.
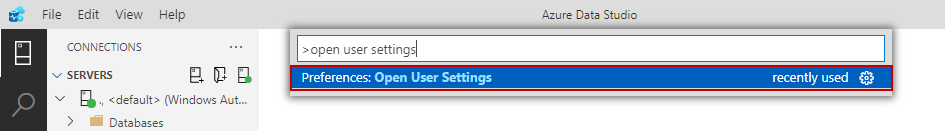
After enabling the Command Pallete, we will type the “open user settings” keywords and then will click the Preferences: Open User Settings.
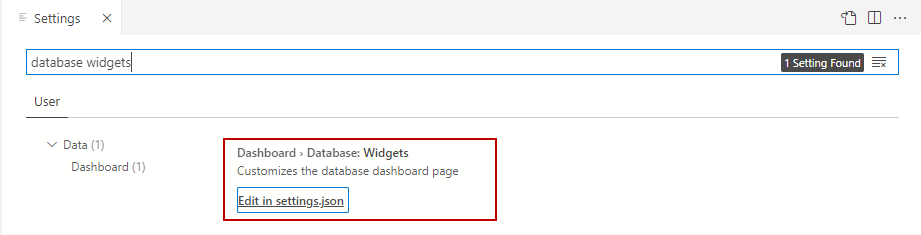
In the settings tab, we search the widget setting and then click over the Edit in the settings.json hyperlink.
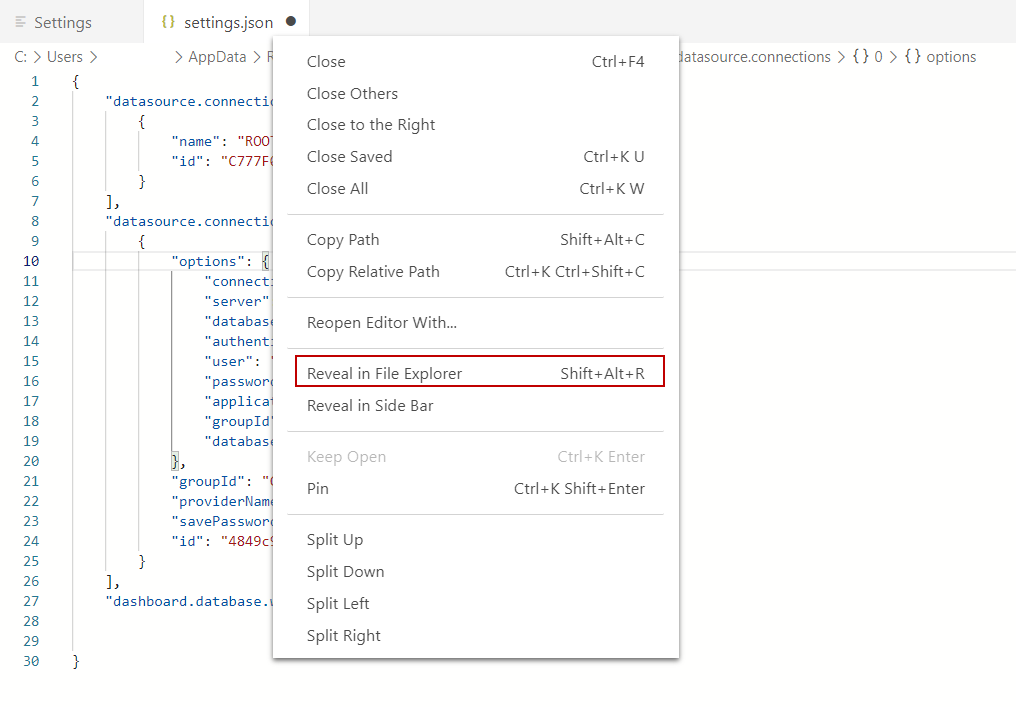
On the JSON editor, we right-click over the settings.json tab and select the Reveal in File Explorer menu item and reach the file path of the user setting file of the Azure Data Studio. We take a copy of the settings.json file into any safe path, we may want to restore the previous settings.
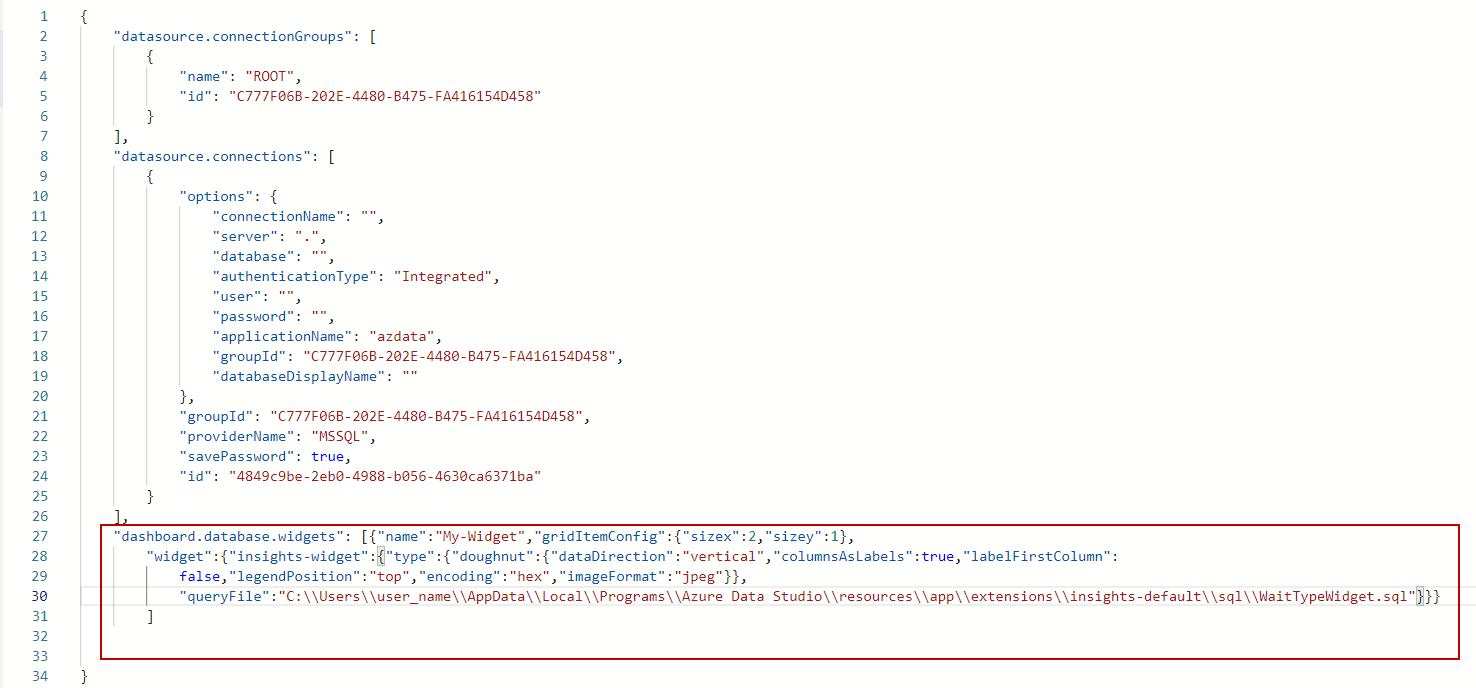
In the setting.json file, we inject the following code at the end of this setting file.
|
1 2 3 4 5 6 |
"dashboard.database.widgets": [{"name":"My-Widget","gridItemConfig":{"sizex":2,"sizey":1}, "widget":{"insights-widget":{"type":{"doughnut":{"dataDirection":"vertical","columnsAsLabels":true,"labelFirstColumn": false,"legendPosition":"top","encoding":"hex","imageFormat":"jpeg"}}, "queryFile":"C:\\Users\\user_name\\AppData\\Local\\Programs\\Azure Data Studio\\resources\\app\\extensions\\insights-default\\sql\\WaitTypeWidget.sql"}}} |
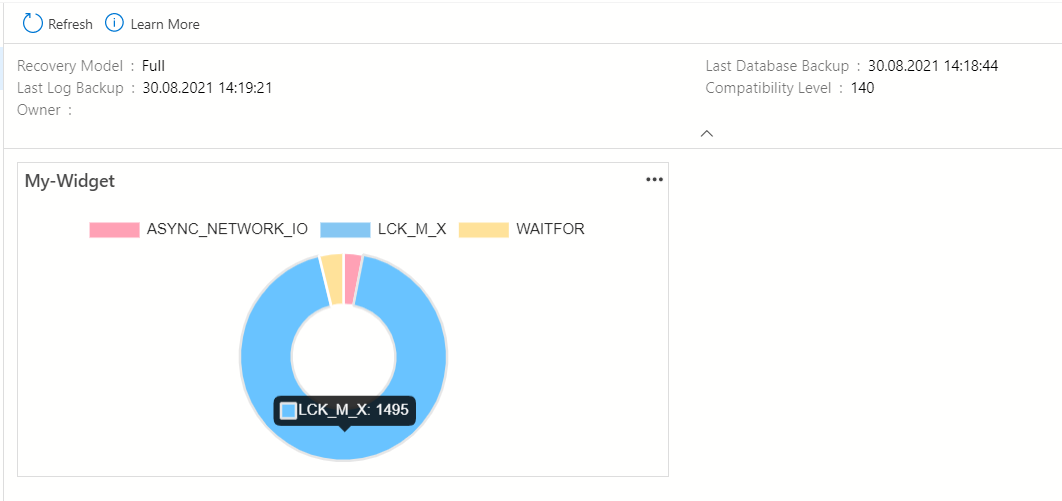
The widget will be displayed any database management tab.
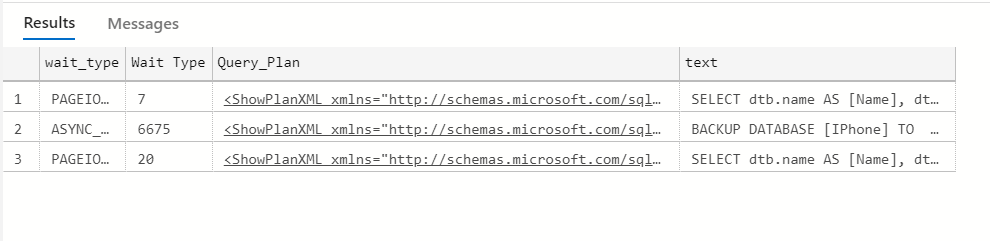
We can add a drill-down capability to customized widgets in order to access chart details. To do this, we need a query that fetches the data that makes up the details of the chart data. The following query returns each of the active session query text and query plan details.
|
1 2 3 4 5 6 7 8 9 10 11 12 13 |
SELECT DER.wait_type,DER.wait_time AS [Wait Type] ,CAST(QueryPlan.query_plan as XML) as Query_Plan ,SqlText.text FROM sys.dm_exec_requests AS DER JOIN sys.databases AS DB ON DER.database_id = DB.database_id JOIN sys.dm_exec_sessions AS DES ON DER.session_id = DES.session_id CROSS APPLY sys.dm_exec_query_plan(DER.plan_handle) QueryPlan CROSS APPLY sys.dm_exec_sql_text(DER.sql_handle) SqlText WHERE NOT DER.status IN ('background', 'sleeping') AND DER.wait_type IS NOT NULL |
Firstly, we will store this query with a file path and this path can be the same as the chart query file path. As a next step, we need to add the details key to the JSON code of the custom widget therefore we re-open the settings.
- To open the Command Palette press Ctrl+Shift+P
- Search Preferences: Open User Settings and click it
- Search Database widgets and click the Edit in settings.json
|
1 2 3 4 5 6 7 8 9 10 11 12 13 14 15 16 17 18 19 20 21 22 23 24 25 26 27 28 29 30 |
"dashboard.database.widgets":[ { "name":"My-Widget", "gridItemConfig":{ "sizex":2, "sizey":1 }, "widget":{ "insights-widget":{ "type":{ "doughnut":{ "dataDirection":"vertical", "columnsAsLabels":true, "labelFirstColumn":false, "legendPosition":"top", "encoding":"hex", "imageFormat":"jpeg" } }, "queryFile":"C:\\Users\\user_name\\AppData\\Local\\Programs\\Azure Data Studio\\resources\\app\\extensions\\insights-default\\sql\\WaitTypeWidget.sql", "details":{ "queryFile":"C:\\Users\\user_name\\AppData\\Local\\Programs\\Azure Data Studio\\resources\\app\\extensions\\insights-default\\sql\\WaitTypeWidgetDetails.sql", "label":"wait_type", "value":"wait_type" } } } } |
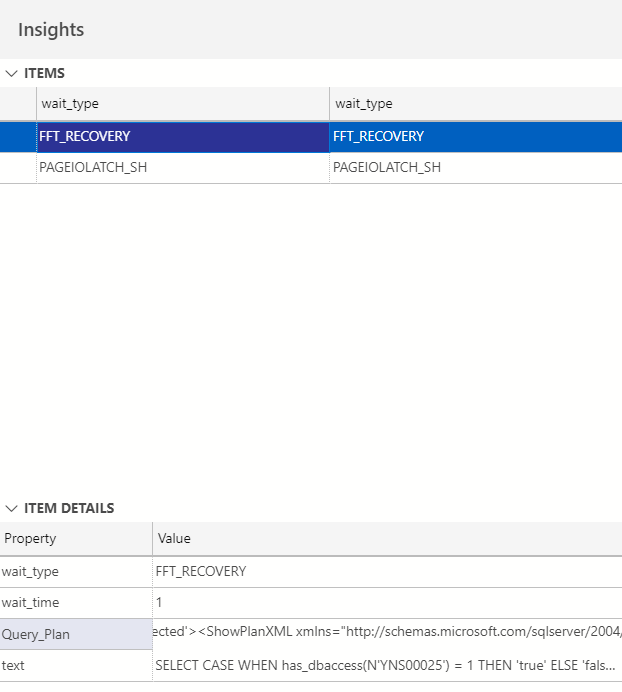
We will click the ellipses (…) in the upper right of the widget and open the details report.
How to enable built-in performance monitoring widget in Azure Data Studio
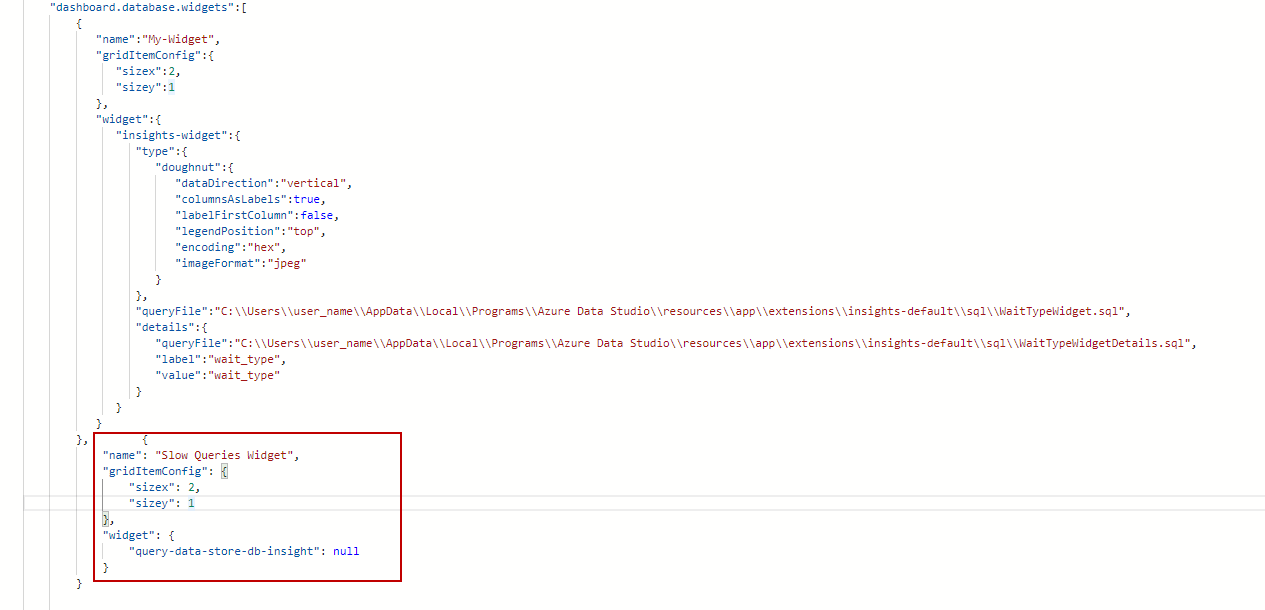
As we have learned the Azure Data Studio allows us to create customized widgets and it also offers some built-in widgets. One of these built-in widgets helps to monitor the five slowest queries. In order to enable this widget, we need to make some customizations on the user setting of the ADS. We re-open the setting.json file, we will add the following code at the end of this setting file.
|
1 2 3 4 5 6 7 8 9 10 11 12 13 |
"dashboard.database.widgets": [ { "name": "Slow Queries Widget", "gridItemConfig": { "sizex": 2, "sizey": 1 }, "widget": { "query-data-store-db-insight": null } } |
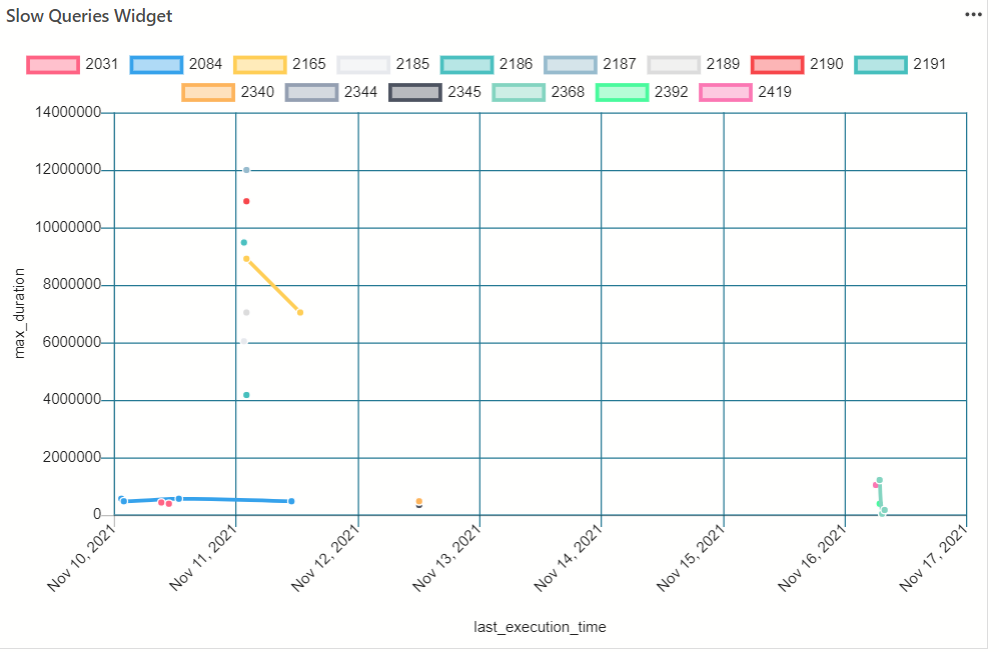
After saving the setting file, right-click one of the database lists and choose the Manage menu item. The dashboard views the slowest five queries in the database.
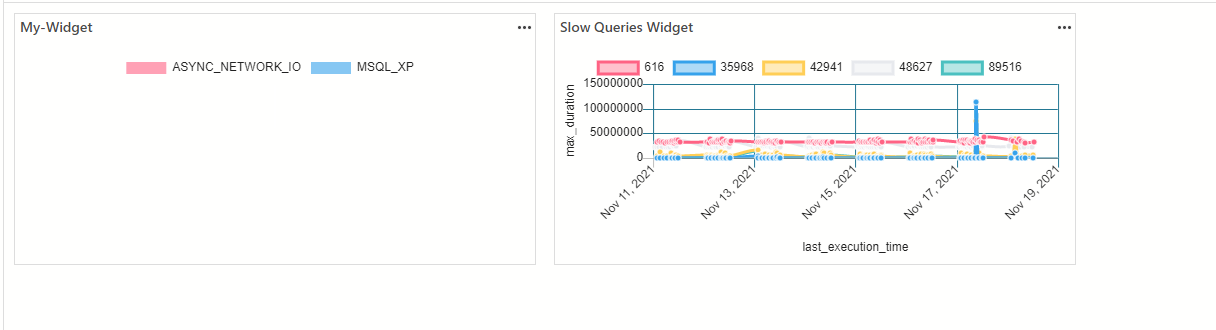
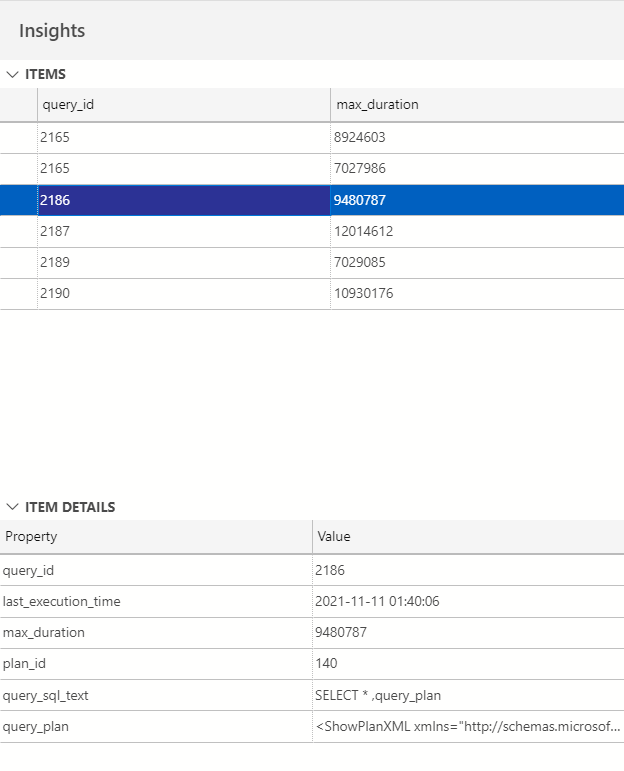
To obtain more details about the slowest quires, we click the ellipses (…) in the upper right and select Show Details. When we click any query on the items report, the subreport shows all details about the query.
Tip: To display more than five queries in the insight widget, we can edit the query that provides the data. This query is placed under the “C:\Users\user_name\AppData\Local\Programs\Azure Data Studio\resources\app\extensions\insights-default\sql” and the query file name is qds.sql and qds_detail.sql. We can edit the top statement in these query files to show more slow queries on the widget.
Enabling autoRefreshInterval option for the widgets
Azure Data Studio allows adding some basic options to the widgets and one of these options is autoRefreshInterval. With help of this option, the widget can automatically refresh the shown data within specified periods. To enable this feature, we need to add the autoRefreshInterval attribute into the setting of the chart. The autoRefreshInterval is placed after the queryFile key and then specifies the interval value as an integer and in minutes.
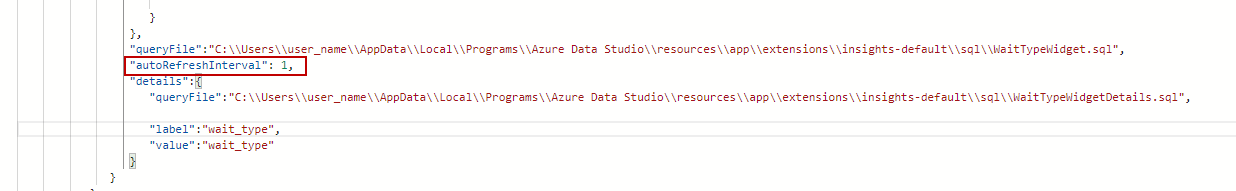
For our sample widget, we determine this value as 1 minute so the widget refreshes all data every one minute.
Summary
Azure Data Studio is a new database management and development platform of Microsoft. There is no doubt that ADS includes some excellent features and one of them is the ability to create a customized chart. Through this feature, we can transform the query result for ease of understanding.

Most of his career has been focused on SQL Server Database Administration and Development. His current interests are in database administration and Business Intelligence. You can find him on LinkedIn.
View all posts by Esat Erkec
- SQL Performance Tuning tips for newbies - April 15, 2024
- SQL Unit Testing reference guide for beginners - August 11, 2023
- SQL Cheat Sheet for Newbies - February 21, 2023