The purpose of this article is to give newbies some basic advice about SQL performance tuning that helps to improve their query tuning skills in SQL Server.
Introduction
The performance tuning aims to optimize and reduce the response time of the queries so that we can provide fast and reliable access to data for the end users.
We will cover topics such as indexing, statistics, and query optimization to help you get the most out of your SQL Server. By following these tips, you can improve the performance of your SQL Server and provide a better experience for your end users.
Measure the Query Statistics
In this part, we will look at the oldie-but-goodie tools which are very beneficial for SQL performance tuning :
- TIME STATISTICS
- IO STATISTICS
TIME STATISTICS is a feature in SQL Server that allows us to collect and view statistics about the amount of time that is spent executing a query. We can enable time statistics by using the SET STATISTICS TIME ON statement, and we can view the time statistics by looking at the messages that are returned by SQL Server after executing a query
|
1 2 3 4 5 6 7 8 9 10 11 12 |
SET STATISTICS TIME ON SELECT P.Name AS [Product Name], SOH.OrderDate AS [Order Date] FROM Sales.SalesOrderHeader AS SOH INNER JOIN Sales.SalesOrderDetail AS SOD ON SOH.SalesOrderID = SOD.SalesOrderDetailID INNER JOIN Production.Product AS P ON SOD.ProductID = P.ProductID SET STATISTICS TIME OFF |
We can find the time statistics report on the Message tab of the SQL Server Management Studio.
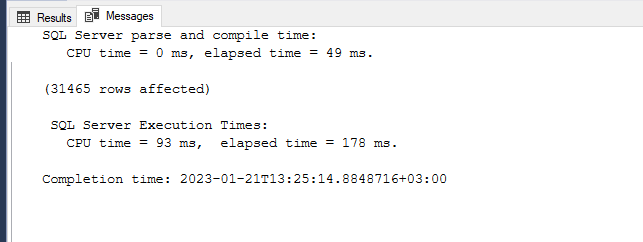
CPU time: The total time which is spent by the CPU
Elapsed time: The total time which is spent by SQL Server.
Parse and compile time and SQL Server Execution Times. The parse and compile time statistics show how much time is spent to parse and compile a query. If we see these times as zero, it indicates that the optimizer has found a cached query plan for the executed query.
IO STATISTICS shows the physical and logical activity of a query. We can enable the IO statistics like time statistics.
|
1 2 3 4 5 6 7 8 9 10 11 12 |
SET STATISTICS IO ON SELECT P.Name AS [Product Name], SOH.OrderDate AS [Order Date] FROM Sales.SalesOrderHeader AS SOH INNER JOIN Sales.SalesOrderDetail AS SOD ON SOH.SalesOrderID = SOD.SalesOrderDetailID INNER JOIN Production.Product AS P ON SOD.ProductID = P.ProductID SET STATISTICS IO OFF |
Scan count: Number of index or table scans performed.
Logical reads: Number of pages read from the data cache.
Physical reads: Number of pages read from disk.
Read-ahead reads: Number of pages placed into the cache for the query
It is important to note that when time statistics are enabled, they will be included in the output of each query, which can impact the performance of the system, so it is recommended to use it only when needed and turn it off when not in use.
Learn to Interpret Query Execution Plans
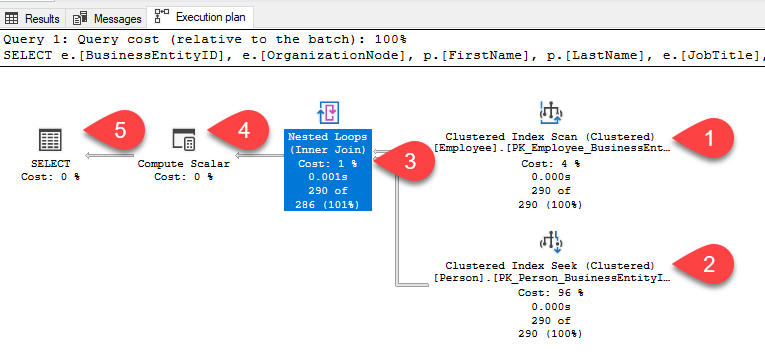
Learning to interpret the query plans are the most important point to figuring out how the query optimizer is decided to access the data and which steps are performed during this process. An execution plan is a very good pathfinder for SQL performance tuning because, through the execution plan of a query, we can identify the bottlenecks and inefficiencies of the query. There are two types of the execution plan:
- The Estimated Execution Plan shows the estimated steps and information of a query and it does not include runtime statistics about the query. We can generate this plan without executing the query
- The Actual Execution Plan includes all runtime statistics, warnings, and steps after the execution of the query.
We can enable the query plans easily in SQL Server Management Studio with help of the Include Actual Execution Plan or Actual Execution Plan buttons which are located in the Query Menu toolbar.
The first thing to know when interpreting a query plan is, the graphical query plans should read top to bottom and right to left.
Follow up on the Novelties of the SQL Server Query Tuning
Many new SQL performance tuning features are added to SQL Server in each new version. In some cases, these features might boost our query performance dramatically. For this reason, it will always be useful for us to be informed about these new features. Such as the following features are very outstanding:
- Adaptive Joins (SQL Server 2017) dynamically decide to join type on the runtime according to the actual number of rows
- Parameter Sensitivity Plan Optimization (SQL Server 2022) allows us to keep multiple execution plans for the parameters of the parameterized queries. So that, this feature may help to resolve parameter sniffing issues.
- Batch Mode (SQL Server 2019) in Rowstore allows fetching multiple rows at once without the need for columnstore indexes.
Knowing about SQL Server’s new features will always put us one step ahead in our SQL performance tuning processes.
Learn the Usage Details of the sp_whoisactive
The sp_whoisactive is a stored procedure that allows us to view information about currently running queries and ongoing processes in the database engine. It provides a wealth of information about what is happening on your SQL Server, including details about active queries, blocked processes, and resource usage. It also allows you to filter the results by various criteria, such as database, username, and program name. Therefore, knowing about sp_whoisactive will always give us an advantage in SQL performance tuning operations. After installing the sp_whoisactive we can easily monitor the activities in the database engine.
Learn to Usage Details of the Extended Events
The Extended Event is a lightweight SQL performance tuning tool that helps to collect and monitoring of the database engine activities. Through the Extended Events, we can capture various activities of the database engine. Such as, we can use extended events to observe what activities an application is performing on SQL Server. To create an extended event session in SQL Server Management Studio (SSMS), follow these steps:
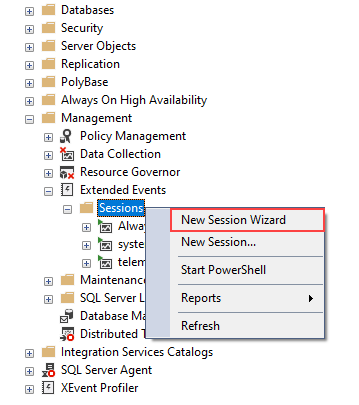
- In the Object Explorer, navigate to the “Management” folder and expand the “Extended Events” folder.
-
Right-click on the “Sessions” folder and select “New Session Wizard…”

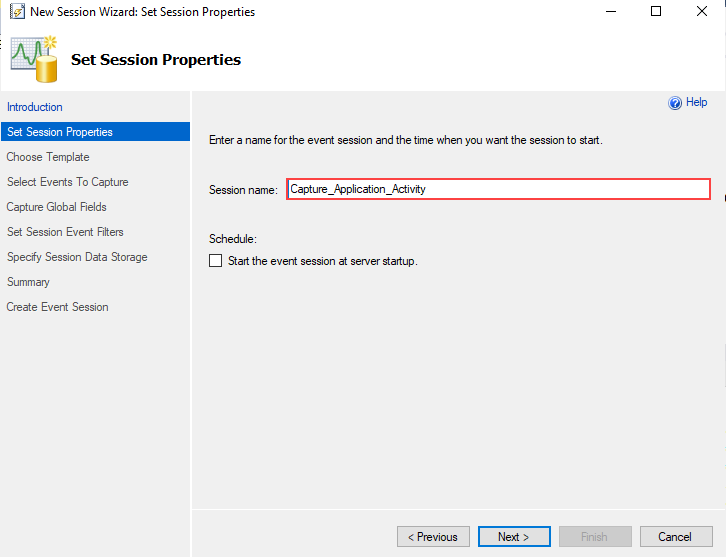
- In the “New Session Wizard” dialog box, give the session a name.
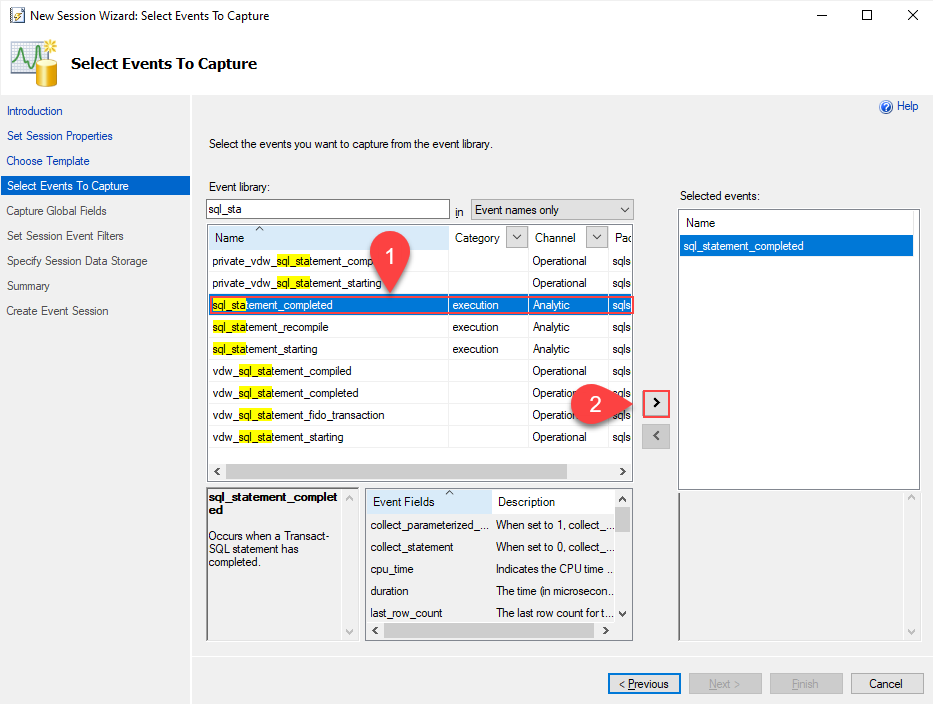
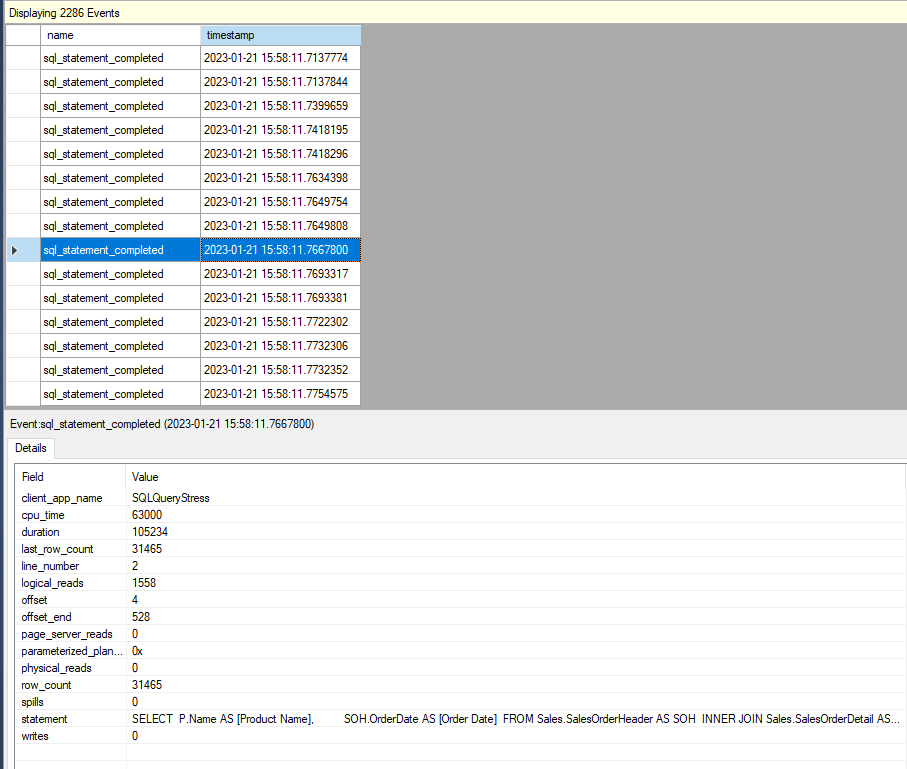
- Click on the “Event sessions” tab and select the sql_statement_completed event. Then click the right arrow and add it to the Selected events list
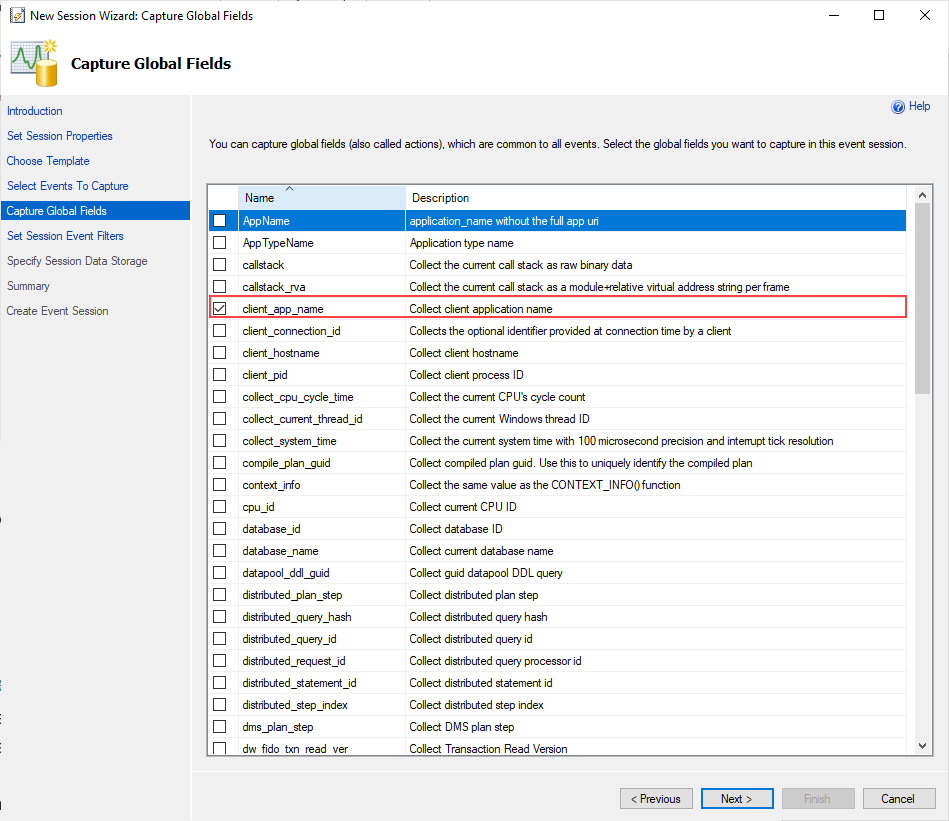
- Select the client_app_name on the Capture Global Fields screen
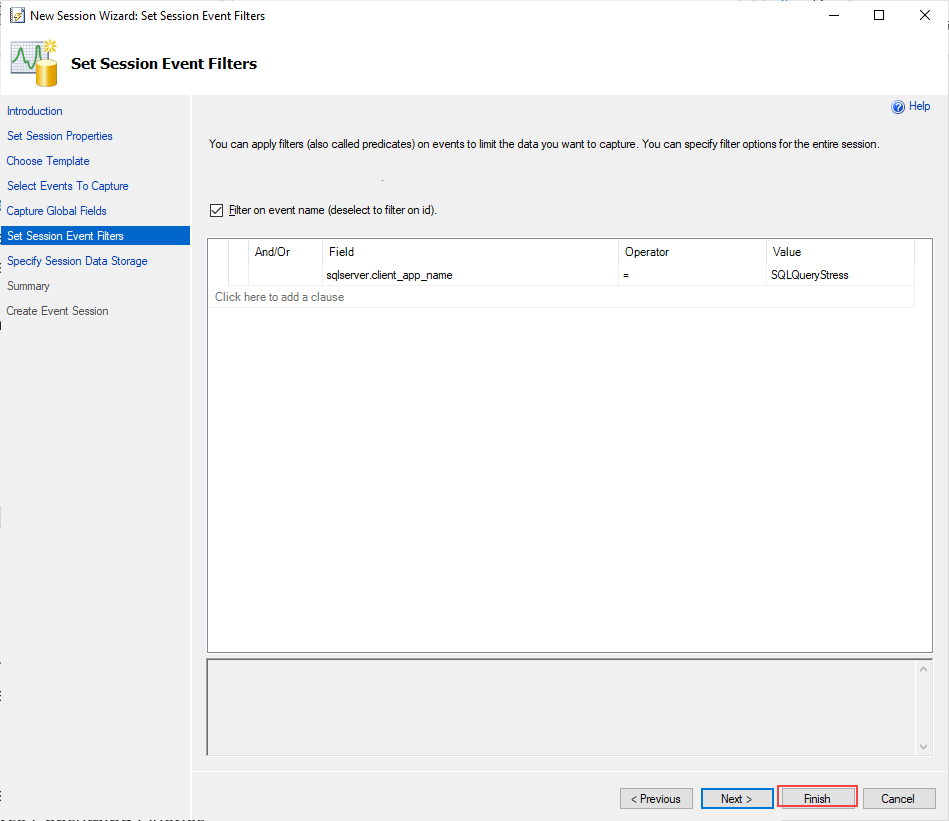
- Applying the filter to the client_app_name on the Set Session Event Filters screen, which application is wanted to monitor the activities. As a last step, we click the Finish button to create the extended event session.
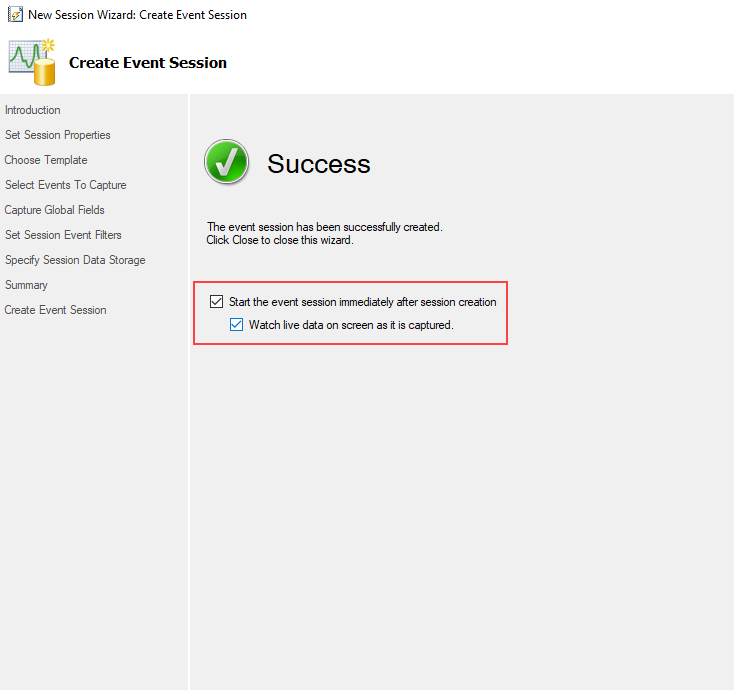
- On the Create Event Session, we check the Start the event session immediately after session creation and Watch live data on screen as it is captured
After completion of these steps, the Extended Event Watch Live data screen will be launched.
As we can see the Extended Events can always help to resolve SQL performance tuning issues.
Learn to Usage Details of the Query Store
Query Store is a feature in Microsoft SQL Server 2016 and later versions that allows you to track, report and analyze executed query performance over time. It captures a history of executed queries, their execution plans, runtime statistics, and query wait statistics, and stores all these data in a repository called the Query Store. This allows you to easily identify and troubleshoot SQL performance tuning issues. Additionally, Query Store includes a set of built-in reports and tools to help you analyze and optimize your queries. The Query Store reports various reports that help SQL query tunning operations:
- Regressed Queries
- Overall Resource Consumption
- Top Resource Consuming Queries
- Queries With Forced Plans
- Queries With High Variation
- Query Wait Statistics
- Tracked Queries
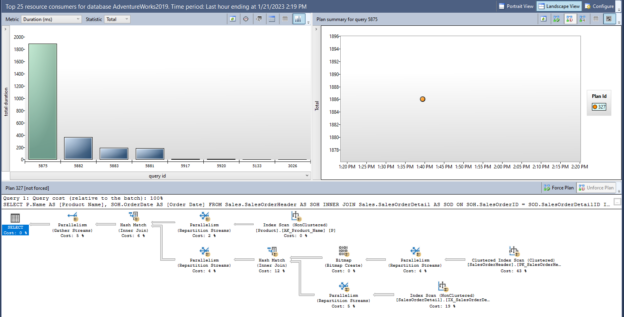
Such as, we use the Top Resource Consuming Queries report to identify the queries which are consuming more resources. After navigating to the Query Store folder in the SSMS, we can open this report.
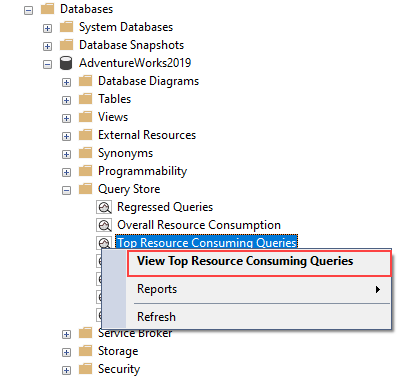
In this report screen, we can view a sorted list of queries according to selected metrics, and also we can view the execution plan and query text of the top resource-consuming.
Summary
SQL performance tuning operations can be very tough for beginners and they might not guess which tools can be needed. In this article, we took a glance at some useful tools which can be very useful for performance tuning.
- SQL Performance Tuning tips for newbies - April 15, 2024
- SQL Unit Testing reference guide for beginners - August 11, 2023
- SQL Cheat Sheet for Newbies - February 21, 2023

