
In my last post, Monitoring SQL Server with dynamic management objects – Sessions and connections, I introduced the concept of using T-SQL queries to monitor SQL Server using Dynamic Management Views. The article demonstrated how we can use two views, namely sys.dm_exec_sessions and sys.dm_exec_connections to view activity on our instance of SQL Server and we achieved this by utilising some of the functionality available to us within T-SQL like joins, aliases and functions, all of which helped us develop a query to return monitoring information to us.
As the sessions and connections views contain the same column, session_id, we utilised an inner join to return matching information based on this column value (there is a one to one relationship between connections and sessions). In this article we are going to put another Dynamic Management View into our query that will allow us to see information at a lower level than the session or connection objects.
I use the term lower level because it helps to visualise what the Dynamic Management Objects represent. We have sys.dm_exec_connections which is the physical connection between a server and our SQL instance and once connected a session is authenticated by login and then we can use sys.dm_exec_sessions to see the corresponding information.
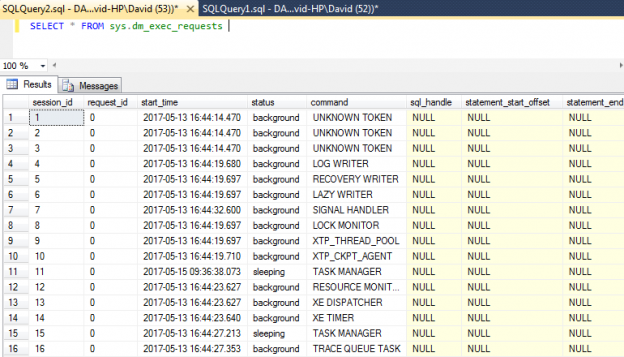
It stands to reason that sessions aren’t created and then nothing happens; if that was the case we’d never have performance issues! Instead work is created within SQL Server in the form of requests and we can use the sys.dm_exec_requests DMV to query this information directly:
On its own the DMV returns a lot of information and this is again, like the sessions view, because we are retrieving rows for both system and user related requests. However, unlike the sessions view we do not have a column such as is_user_process to filter out any system related row that we might not be interested in.
To filter these rows out we can use the matching column (session_id) to the sys.dm_exec_sessions view. We can then use an inner join with a where clause based on the sessions is_user_process column being equal to 1 that will remove any system related information:
|
1 2 3 4 5 6 |
SELECT * FROM sys.dm_exec_requests r INNER JOIN sys.dm_exec_sessions s ON r.session_id = s.session_id WHERE s.is_user_process = 1 |
On my test instance the following result set is returned:

Whilst we are using two DMVs we can alter the select statement to only return information from one DMV or the other using the alias and * in the select statement:
|
1 2 3 4 5 6 7 |
--return columns only from the requests view SELECT r.* FROM sys.dm_exec_requests r INNER JOIN sys.dm_exec_sessions s ON r.session_id = s.session_id WHERE s.is_user_process = 1 |
|
1 2 3 4 5 6 7 |
--return columns only from the sessions view SELECT s.* FROM sys.dm_exec_requests r INNER JOIN sys.dm_exec_sessions s ON r.session_id = s.session_id WHERE s.is_user_process = 1 |
Which show the corresponding result sets:
Requests

Sessions

Of course the whole concept of joins is not to have separate results but results using columns from all sources. I say all sources because we’re not limited to one join and we can use the query we created in my last post and add in a join to the sys.dm_exec_requests DMV there:
|
1 2 3 4 5 6 7 8 9 10 11 12 13 14 15 16 |
SELECT s.session_id, s.login_time, s.host_name, s.program_name, s.login_name, s.nt_user_name, s.is_user_process, database_id, DB_NAME(s.database_id) AS [database], s.status, s.reads, s.writes, s.logical_reads, s.row_count, c.session_id, c.net_transport, c.protocol_type, c.client_net_address, c.client_tcp_port, c.num_writes AS DataPacketWrites FROM sys.dm_exec_sessions s INNER JOIN sys.dm_exec_connections c ON s.session_id = c.session_id INNER JOIN sys.dm_exec_requests r -- added join to sys.dm_exec_requests ON s.session_id = r.session_id WHERE s.is_user_process = 1 |
Running this query will result in an error being returned:
Msg 209, Level 16, State 1, Line 3
Ambiguous column name ‘database_id’.
This is because our newly added DMV contains the database_id column so we’ll prefix the column in the select statement with our alias for the requests DMV:
|
1 2 3 4 5 6 7 8 9 10 11 12 13 14 15 16 17 |
SELECT s.session_id, s.login_time, s.host_name, s.program_name, s.login_name, s.nt_user_name, s.is_user_process, r.database_id, -- added r.alias DB_NAME(s.database_id) AS [database], s.status, s.reads, s.writes, s.logical_reads, s.row_count, c.session_id, c.net_transport, c.protocol_type, c.client_net_address, c.client_tcp_port, c.num_writes AS DataPacketWrites FROM sys.dm_exec_sessions s INNER JOIN sys.dm_exec_connections c ON s.session_id = c.session_id INNER JOIN sys.dm_exec_requests r -- added join to sys.dm_exec_requests ON s.session_id = r.session_id WHERE s.is_user_process = 1 |
Now we have a query that is looking at connection, session and request information and we can essentially pick and mix our columns to return information that we can use or act on. The sys.dm_exec_requests DMV is very popular to use in both monitoring and troubleshooting activities because of the wealth of useful information that is available.
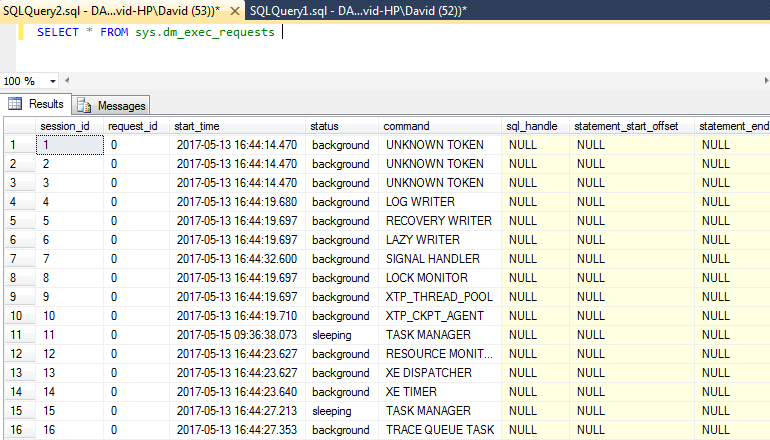
Before we explore the requests DMV in more detail there is one final note on the query and the joins that it is using. You may notice that our query based on session/connection information returns more rows than what the session/connection/requests one returns. This is because of the way the inner join works, by design it only returns matching rows so we’re essentially using this join mapping through all three views.
The sys.dm_exec_requests view only contains information on requests that are currently executing so although we may have additional sessions that inactive shown in our sessions/connections query if there is no matching request that is currently “active” that session information will not be shown.
Session/Connection
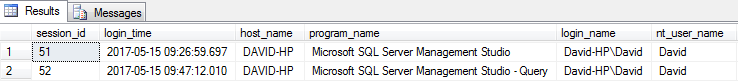
Session/Connection/Request

In the two screenshots above we can see that the query that does not contain the join to the requests DMV contains information for session ID’s 51 and 52. The second image where the join to sys.dm_exec_requests is present shows that we only have one row. This is all down to the matching rows that have been forced by the inner join, as we only have one executing request (session 52), that is all that is returned.
We can see why this is happening if we look at the status column from sys.dm_exec_sessions for the two session_ids with the following query:
|
1 2 3 4 |
SELECT session_id, status FROM sys.dm_exec_sessions WHERE session_id IN (51,52) |
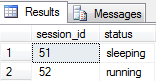
This shows that session 51 is inactive (no match in requests) whereas 52 is running and so would have a corresponding executing request record (with the matching session ID).
This is an important concept to understand because as you work with queries contain multiple joins we can end up with smaller result sets than expected and we often have to work backwards by removing join statements to find where rows aren’t being joined correctly.
There are other join types that we can use to change this behaviour but they are out of scope for this article.
Whist mentioning session IDs it’s also worth noting that the tabs in Management Studio will show the corresponding session ID of any queries you are working on:

We’ll now remove some columns from our query, including all the connection view related information so we can look at executing requests in more detail:
|
1 2 3 4 5 6 7 8 9 10 11 12 13 |
SELECT s.session_id, s.login_time, s.host_name, s.program_name, s.login_name, s.nt_user_name, s.is_user_process, s.database_id, DB_NAME(s.database_id) AS [database], s.status, r.status FROM sys.dm_exec_sessions s INNER JOIN sys.dm_exec_connections c ON s.session_id = c.session_id INNER JOIN sys.dm_exec_requests r ON s.session_id = r.session_id WHERE s.is_user_process = 1 |
Note that I have used two status columns; s.status and r.status, one from sessions and one from requests and we can see that both have a value of “running”.

To demonstrate how these are actually very different I’m going to create a very simple blocking scenario using the AdventureWorks2014 sample database. To achieve this I will perform an update within a transaction that does not have a corresponding commit or rollback and then whilst that transaction is open attempt a select from the same table. I’ll then check my activity query for the results.
|
1 2 3 4 5 6 7 8 9 |
USE AdventureWorks2014 GO BEGIN TRAN UPDATE [AdventureWorks2014].[Person].[Address] SET AddressLine1 = '1971 Napa Ct.' WHERE AddressID = 1 |
In a new window:
|
1 2 3 4 5 6 7 8 9 10 11 12 |
SELECT TOP 1000 [AddressID] ,[AddressLine1] ,[AddressLine2] ,[City] ,[StateProvinceID] ,[PostalCode] ,[SpatialLocation] ,[rowguid] ,[ModifiedDate] FROM [AdventureWorks2014].[Person].[Address] |
The select statement won’t return any rows and actually will be stuck on executing query. This is because the update transaction is still in limbo, it hasn’t committed or rolled back and because the default behaviour for SQL is not to read uncommitted data we are left waiting for the transaction to complete one way or the other.
When I look at my activity script I can see the following under the status columns:
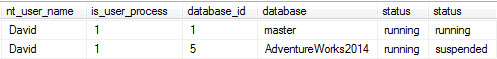
The second row is what we need to focus on; the first status (sessions) has a value of “running” but the second status column has a value of “suspended”. This tells us that although the session is active the request is unable to run.
If I then run a ROLLBACK TRAN command in the same window under the update command this will undo any changes and finish that statement. The select statement will have returned its results and if we run the activity query again we won’t have a corresponding row for the AdventureWorks2014 database.

In fact, I can add AND s.session_id <> @@SPID to the query and my result set will not contain any rows proving that this row relates to the activity query itself.
The requests status can immediately tell us if a request is processing (running) or if there’s a potential problem (suspended) however the status column can actually contain one of five values and each gives a good indicator into the current state of a request:
- Background
- Running
- Sleeping
- Suspended
- Runnable
A status of background means that the request is running behind the scenes so to speak and only system requests can have this particular status, as we’ve excluded them from our result set we’ll not see any of these.
Running as the value suggests means that the request is being processed and is consuming CPU.
Sleeping means that the request has finished and is awaiting command.
Suspended as we’ve just demonstrated is that request is awaiting resource, this could be resource such as memory or disk or that it is waiting for a lock on a data page.
Runnable indicates that the request is waiting for CPU resource. Note that this is not the same as a suspended status or wait but is in a queue to be placed on the CPU.
This status column is quite useful and although a very small part of the jigsaw it does enable us to see what requests are running and what requests potentially require more investigation. I use the word “potentially” quite often, particularly when demonstrating these types of DBA activities and that is because we can never make an assumption based on one small piece of information.
If we go back to the blocking scenario that I created earlier we could see a suspended request but even though we knew at the time that doesn’t necessarily mean we have an urgent issue. It could be very normal behaviour, what if the request had just started running that second and was awaiting some pages? That could actually be quite acceptable.
Here’s a query that focuses on some time based columns from the requests DMV (I’ve excluding the activity query session ID/SPID).
|
1 2 3 4 5 6 7 8 9 10 11 |
SELECT s.session_id, r.status, r.total_elapsed_time, r.cpu_time, r.wait_time FROM sys.dm_exec_sessions s INNER JOIN sys.dm_exec_connections c ON s.session_id = c.session_id INNER JOIN sys.dm_exec_requests r ON s.session_id = r.session_id WHERE s.is_user_process = 1 AND s.session_id <> @@SPID |
In this case I’ve left the select statement running for a while and then checked the activity query which returns the following:
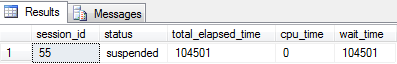
I can see here that the request has had no CPU time whatsoever and has been waiting for a total of 104501ms, whilst it’s always relative to the usual demand on a server this would indicate to me that this particular request is worth investigating. Conversely should the total_elapsed_time be extremely low I would run the query a few more times to assess if the wait_time values are increasing.
I’ll now add two additional columns from sys.dm_exec_requests to our query, command and percent_complete:
|
1 2 3 4 5 6 7 8 9 10 11 12 |
SELECT s.session_id, r.command, r.status, r.total_elapsed_time, r.cpu_time, r.wait_time, r.percent_complete FROM sys.dm_exec_sessions s INNER JOIN sys.dm_exec_connections c ON s.session_id = c.session_id INNER JOIN sys.dm_exec_requests r ON s.session_id = r.session_id WHERE s.is_user_process = 1 AND s.session_id <> @@SPID |
Here’s a result set from the blocking scenario that we have been working with:
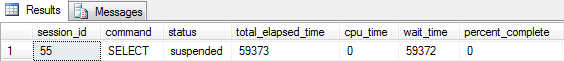
The command column tells us the type of statement that is running (SELECT in this example) but the percent_complete value is 0. The percent_complete column is very useful but it will only contain a meaningful value when certain commands are being executed, for example if I start a backup and then check I receive the following:
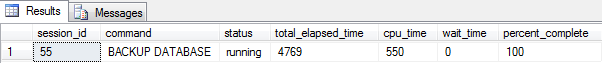
I can see the command column has a value of BACKUP DATABASE and I know it’s nearly finished as the percent_complete is at 100. Note the wait time is at 0 so I haven’t encountered any waits for resource (suspended status) and the total_elapsed time is just under 5 seconds. The difference between total_elapsed_time and cpu_time is time spent in the queue awaiting CPU (runnable status).
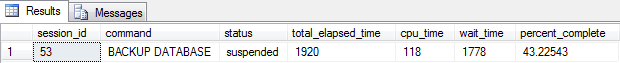
This next image shows a different story. Here we have a very similar backup command but this time the request has a status of suspended, we know this relates to the time awaiting resource and as such we can see a wait time of 1778ms. The actual backup operation is around 43% complete.
As mentioned the percent_complete column will only contain data for certain tasks, the full list being:
- ALTER INDEX REORGANIZE
- AUTO_SHRINK option with ALTER DATABASE
- BACKUP DATABASE
- DBCC CHECKDB
- DBCC CHECKFILEGROUP
- DBCC CHECKTABLE
- DBCC INDEXDEFRAG
- DBCC SHRINKDATABASE
- DBCC SHRINKFILE
- RECOVERY
- RESTORE DATABASE
- ROLLBACK
- TDE ENCRYPTION
This means for queries such as our earlier select statement we will never see a percentage complete value but clearly it is very useful for monitoring the progress of certain administrative tasks.
The final part of this article is to show what our requests are waiting for. This in itself is an extremely deep subject so this post is limited to showing that we can view wait information via T-SQL rather than explain all the different possibilities.
Let’s modify our query and add the wait_type column from sys.dm_exec_requests:
|
1 2 3 4 5 6 7 8 9 10 11 12 |
SELECT s.session_id, r.command, r.status, r.total_elapsed_time, r.cpu_time, r.wait_time, r.percent_complete, r.wait_type FROM sys.dm_exec_sessions s INNER JOIN sys.dm_exec_connections c ON s.session_id = c.session_id INNER JOIN sys.dm_exec_requests r ON s.session_id = r.session_id WHERE s.is_user_process = 1 AND s.session_id <> @@SPID |
The wait_type column is one of the most important pieces of diagnostic information that we can retrieve from SQL Server as it tells us exactly (at the moment of capture) what resource our requests are waiting for.
I’ll use two examples for this, first the backup task:

We can see here a wait_time of 1919ms and it has a corresponding wait_type of ASYNC_IO_COMPLETION. This is telling us exactly what resource our request is waiting for, in this example I know that the ASYNC_IO_COMPLETION relates to disk IO is typically associated with backup operations. Is this necessarily a problem? Well, to use the DBAs favourite line “it depends” and that would be answered by checking other ongoing activity and referencing previous backup timings.
Let’s use the blocking scenario from earlier to see what wait information we receive for that example:
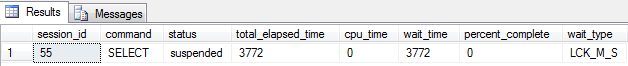
As we might have expected we now have a very different wait type. This time it’s LCK_M_S indicating that our select statement is being blocked. Fortunately the sys.dm_exec_requests DMV also contains a column where we can see which process is blocking our query, let’s add that to our script and run again:

Here we can see that our select statement (session 55) is being blocked by session 52. Session 52 isn’t present in our query results but we can use the built-in function sp_who to find out it’s details.
|
1 2 3 |
sp_who 52 |

This returns very similar information to what we have been looking at so far in the DMV queries and from this we can see session 52 is sleeping and awaiting command. We could either kill off or investigate a little further (never kill off a process without understanding its origin).
One question you may ask is why we don’t just use sp_who or even its older brother sp_who2 to return activity related information?
By using Dynamic Management Objects we have much more information to use and because we are creating the queries ourselves we can create completely customised scripts to return exactly the information we need, like in the query below:
|
1 2 3 4 5 6 7 8 9 10 11 12 13 14 15 16 |
SELECT s.session_id, s.login_name, s.host_name, c.client_net_address, s.program_name, db_name(r.database_id) AS [Database], r.command, r.status, r.total_elapsed_time, r.cpu_time, r.wait_time, r.percent_complete, r.wait_type, r.blocking_session_id FROM sys.dm_exec_sessions s INNER JOIN sys.dm_exec_connections c ON s.session_id = c.session_id INNER JOIN sys.dm_exec_requests r ON s.session_id = r.session_id WHERE s.is_user_process = 1 |
Of course we may want to include other bits of information and that’s the real beauty of using Dynamic Management Objects, they are extremely flexible. By adding just three more columns I can also see the read/write activity of any executing request, like in the query below:
|
1 2 3 4 5 6 7 8 9 10 11 12 13 14 15 16 17 |
SELECT s.session_id, s.login_name, s.host_name, c.client_net_address, s.program_name, db_name(r.database_id) AS [Database], r.command, r.status, r.total_elapsed_time, r.cpu_time, r.wait_time, r.percent_complete, r.wait_type, r.blocking_session_id, r.reads, r.logical_reads, r.writes FROM sys.dm_exec_sessions s INNER JOIN sys.dm_exec_connections c ON s.session_id = c.session_id INNER JOIN sys.dm_exec_requests r ON s.session_id = r.session_id WHERE s.is_user_process = 1 |
Having an understanding of Dynamic Management Objects is critical for DBAs and I always encourage people to read up on the information that they expose and how they relate to one another.
The previous article in this series

He has over 10 years experience working with SQL Server in different roles such as DBA, Database Developer and BI specialist. He has worked as Technical Lead on numerous mission critical projects in various sectors such as local government, finance, charities and retail.
David is extremely passionate about SQL Server and keeps his own blog at http://sqlclarity.blogspot.com/ where he shares his views on the Data Platform. In his spare time he loves spending time with his family, watching movies and cooking Asian cuisine!
View all posts by David Alcock
- Monitoring SQL Server with Dynamic Management Objects – Requests - May 17, 2017
- Monitoring SQL Server with Dynamic Management Objects – Sessions and connections - May 12, 2017
- CHECKSUM page verification in SQL Server - March 21, 2017