
In the article, we will learn how to use the ‘iotop’ and ‘iostat’ commands with various configuration options.
It is essential for SQL Server DBAs to learn important commands in Linux in order to troubleshoot any performance issues in a Linux environment. When we encounter any performance issues or need to check the system or user processes, we can use the ‘top’ command. The ‘top’ command gives basic information about the CPU and memory processes. We might require more details in order to troubleshoot the issue, though. In such cases, we can utilize information similar to that in Windows provided by the task manager, resource monitor, and performance monitor.
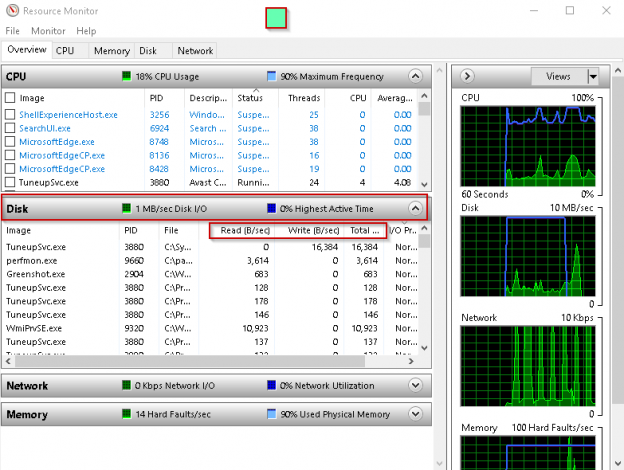
In Windows systems, we look at the resource monitor to get information about the individual process and their disk related activity (Reads\sec, writes\sec).

We can get further information using the performance monitor, where we can configure multiple parameters to get disk related activity.
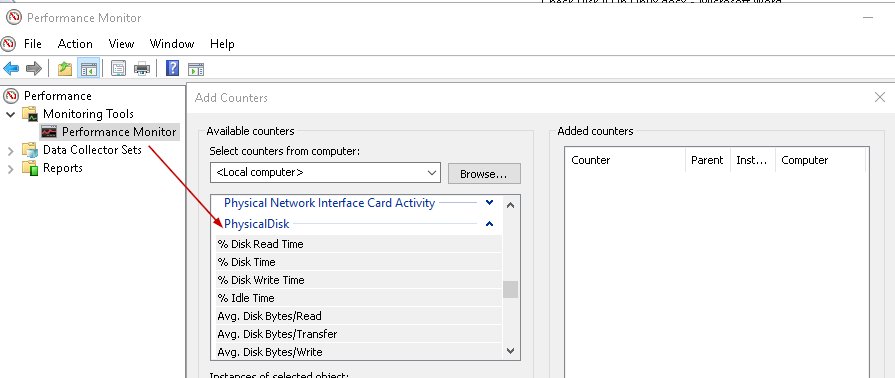
A few important counters in performance monitor are:
- Avg. Disk sec/Read
- Avg. Disk sec/Write
- % Idle Time
- Avg. Disk Queue Length
- Disk writes/sec
- Disk reads/sec
- Disk writes/sec
Let us explore some commands in Linux to get the disk related information.
iostat
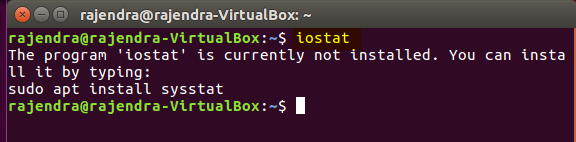
We can monitor IO statistics for all disks and file system in Linux using ‘iostat’ command. This command is not installed by default, so we need to install this.
- Note: In this article, we are using Ubuntu OS. You can prepare the Linux environment for the SQL Server by following my articles.
- SQL Server 2019 on Linux with Ubuntu
- SQL Server 2019 on Linux with a Docker container on Ubuntu
- SQL Server 2019 on Linux with Ubuntu and Azure Data Studio
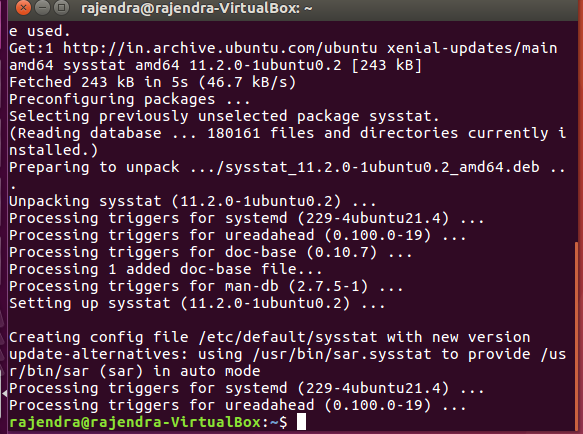
Therefore, install the ‘iostat’ using the below command in the terminal window.
$ sudo apt-get install sysstat
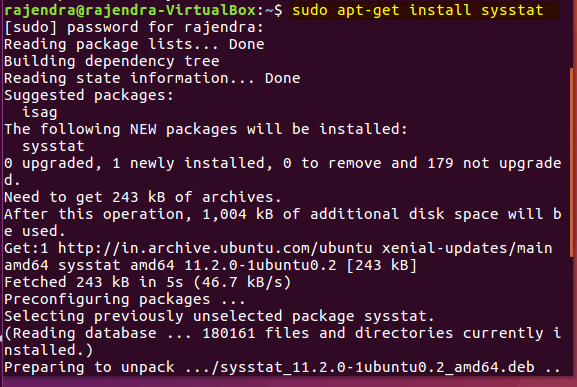
We can view the processes or task it performs to install the ‘iostat’ command.
We can now run the ‘iostat’ command and view the output.
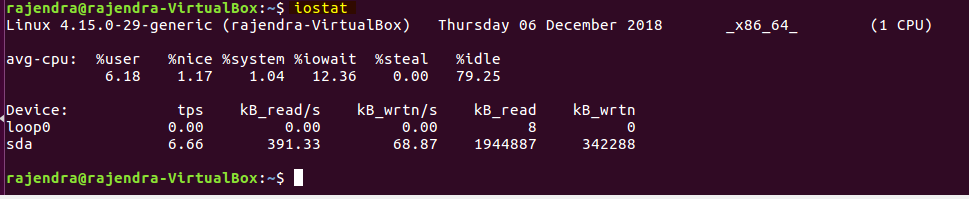
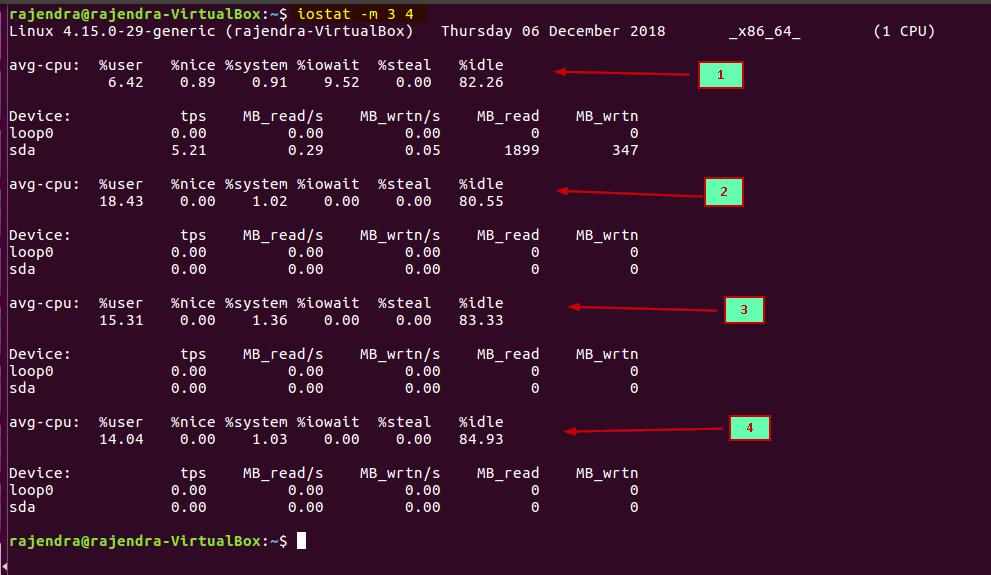
In the output, we can categorize the information as below.
- CPU related information:

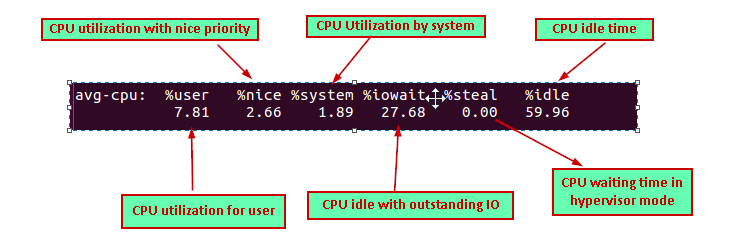
From the output, we can see below information:
- %user: It is the CPU utilization for the user
- %nice– this shows the CPU utilization with nice priority
- %system– it shows the CPU utilization by the system
- %iowait: this data shows the CPU idle time with an outstanding i/o request
- %idle: System idle time
- Disk related information:
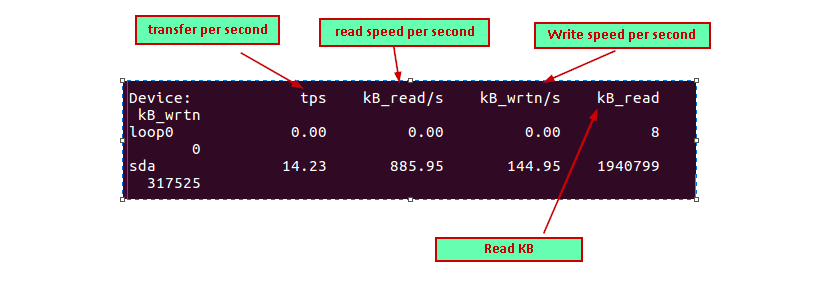
Below section shows the disk related information.
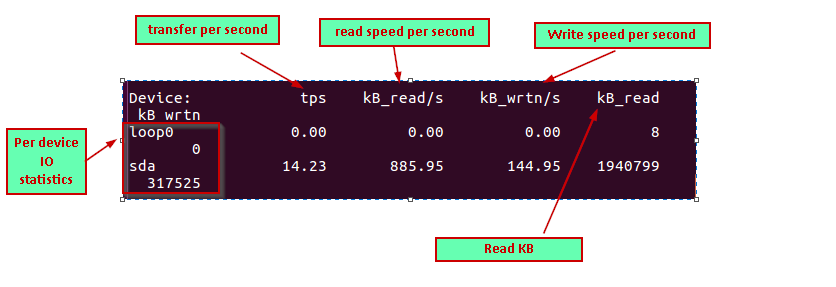
Below is the columns output we get for the individual disk device.
- Device: Name of the device
- Tps: transfer per second
- KB_reads/s: KB reads per second
- KB wrtn/s: KB writes per second
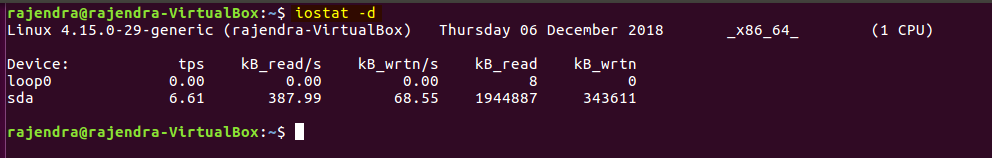
If we want to get only device-related information, run the below command:
$ iostat -d
By default, it command gives basic information about the disks. If we want to get detailed information, run the command with ‘-x’ parameter.
$ iostat -x
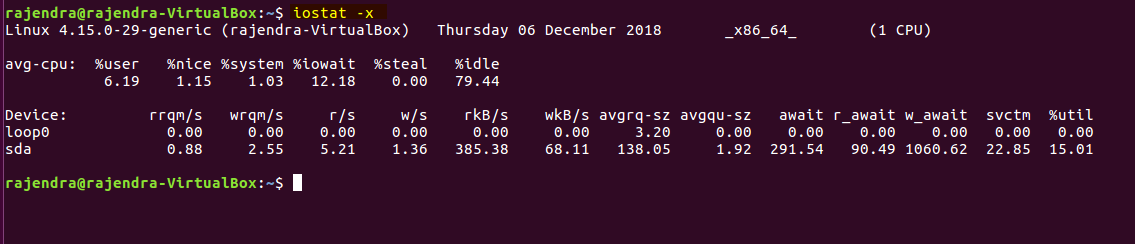
We get additional columns in the output as compared to the previous run without ‘-x’ parameter.
- ‘rrqm\s’: it shows the read requests merged per second queued to the device
- ‘wrqm/s: it shows the write requests merged per second queued to the device
- r/s and w/s: read and write requests per second
- rsec/s and wsec/s: Number of sector reads and writes per second
- avgrq-sz : average sector size of the requests
- avgqu-sz: average queue length of the requests
- await: average wait time in ms
- svctm: average service time in ms
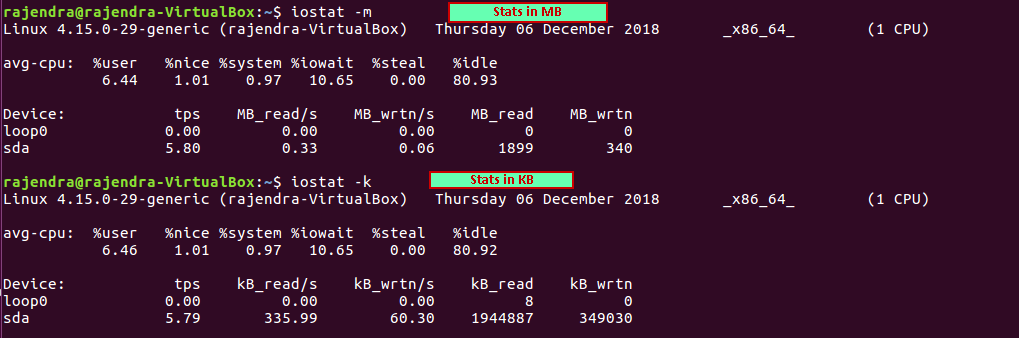
We can get the stats in KB or MB with the below commands:
iostat -m –Stats in MB
iostat -k –stats in KB
We can get the stats with a time interval as well. This helps to get the report.
Using below command, we can run ‘iostat’ with MB unit in 3 seconds interval and 4 times.
iostat -m 3 4
iotop
We can get IO information or disk utilization by the individual process. We also need to install this command to use it.
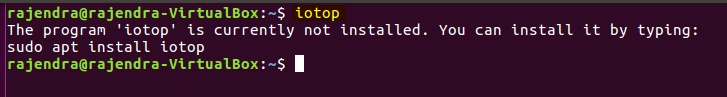
In Ubuntu, run the below command to install ‘iotop’:
sudo apt install iotop
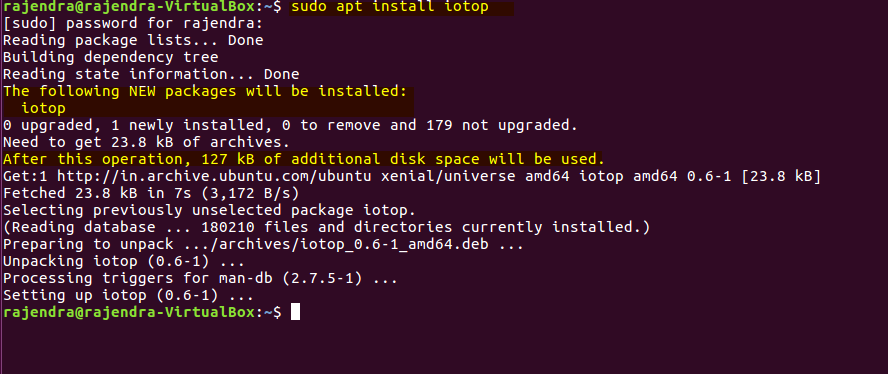
I highlighted the important information during the installation of ‘iotop’. We need to run this using administrative permission else, below error message is logged.
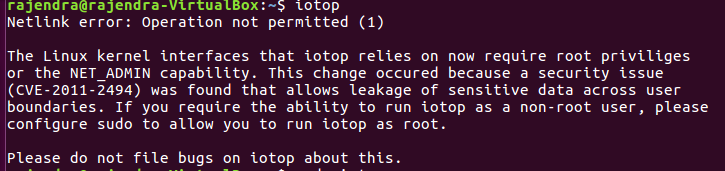
$ sudo iotop
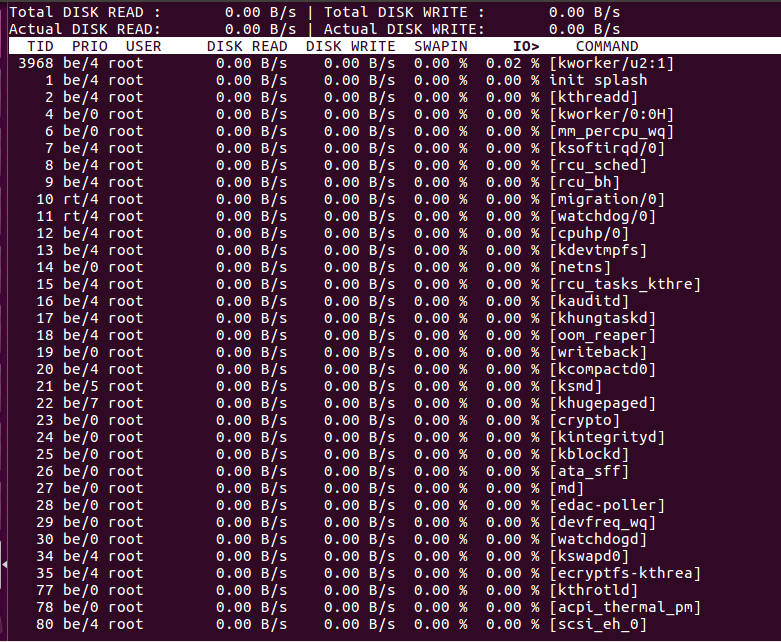
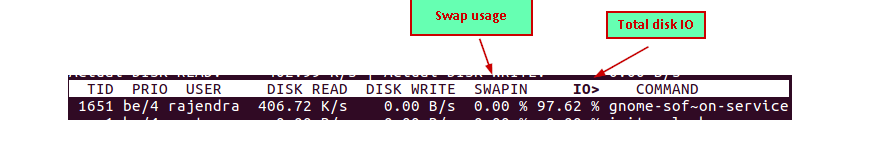
We can see below column header for the ‘iotop’ command. In this output:
- SWAPIN: swap usage for each process
- IO: total IO for each process
We can get information about the iotop command using the ‘sudo iotop –help’ command.
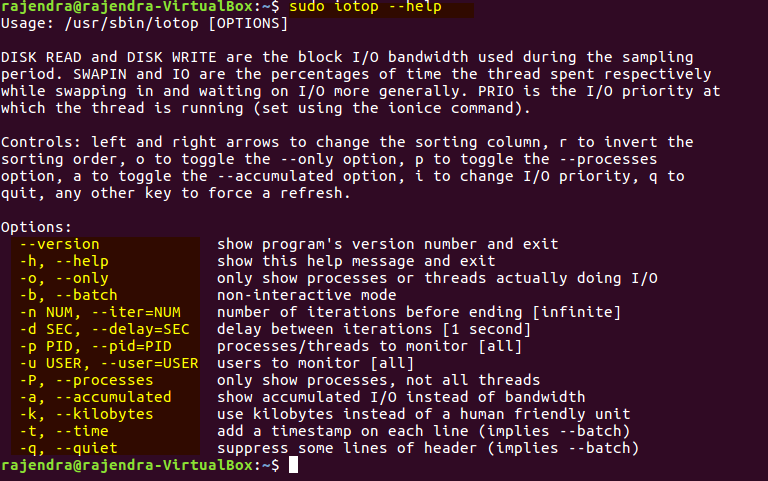
So let us explore these options.
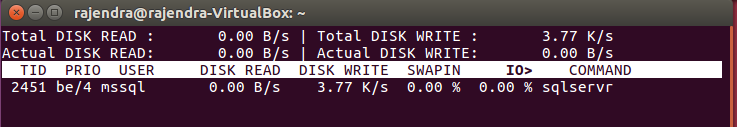
Current running processes:
If we want to check current running processes, we can run the command ‘sudo iotop –only’
Sort Column:
‘iotop’ command also gives output in interactive mode. We can change the sort column using the left and right arrow keys. You can notice the same in below screenshots.
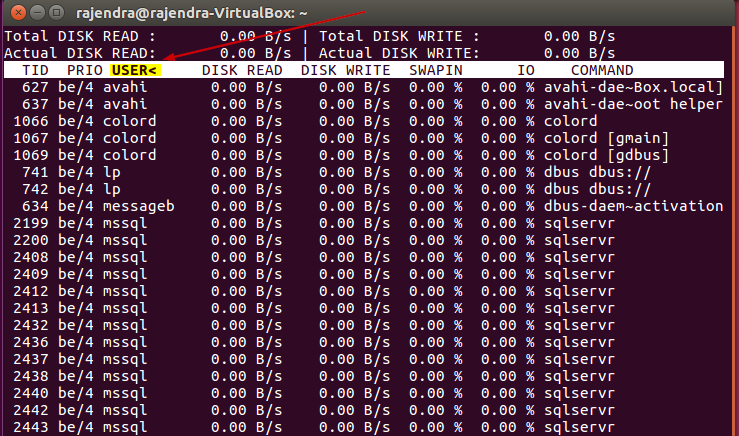
In below screenshot, the current sort column is ‘USER’.
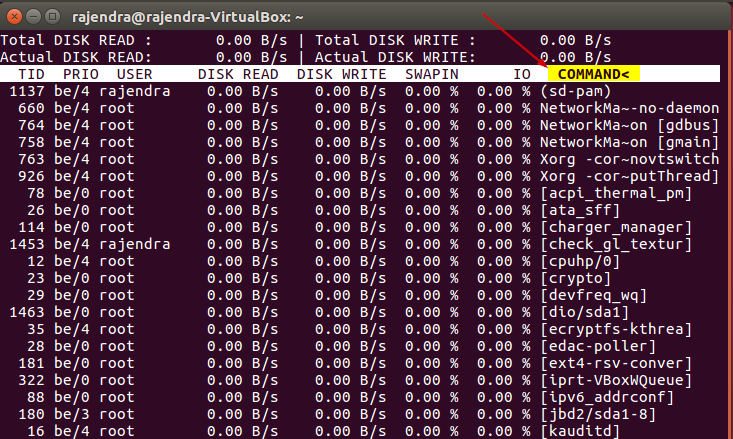
Press the right arrow key few times and we can change the sort key to ‘command’ as shown here:
In the running out, press ‘p’ to only show the processes.
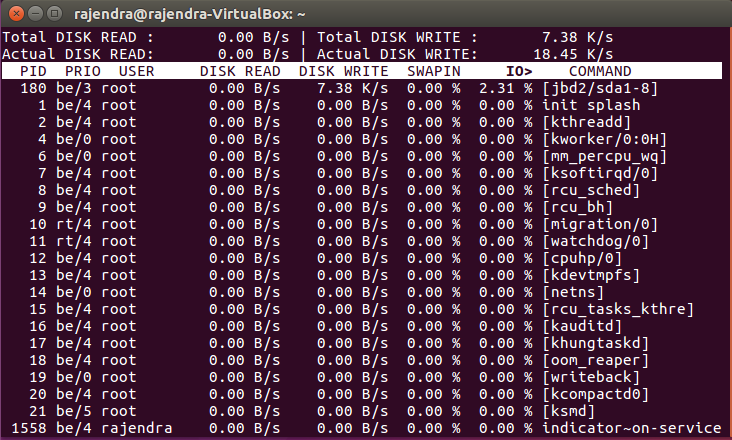
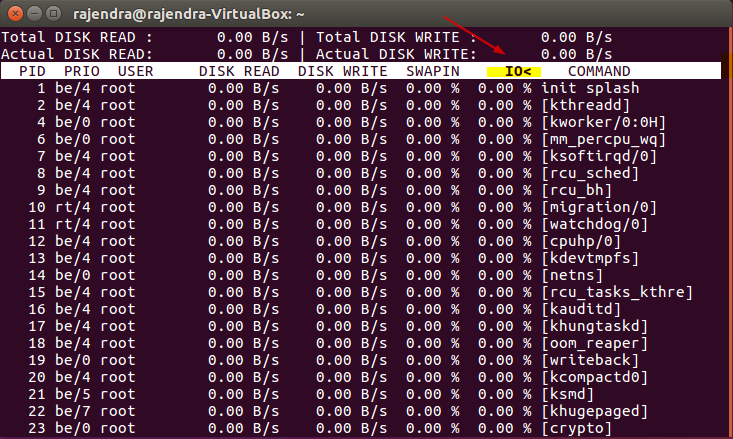
If we want to change the sort order, we can do it using the ‘r’ key. By default, in the sort column, you can see symbol ‘>’. Press ‘r and sort order changes and symbol changes to ‘<‘.
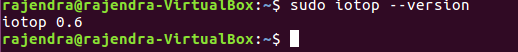
Version number:
Below command gives ‘iotop’ command version number.
Sudo iotop –version
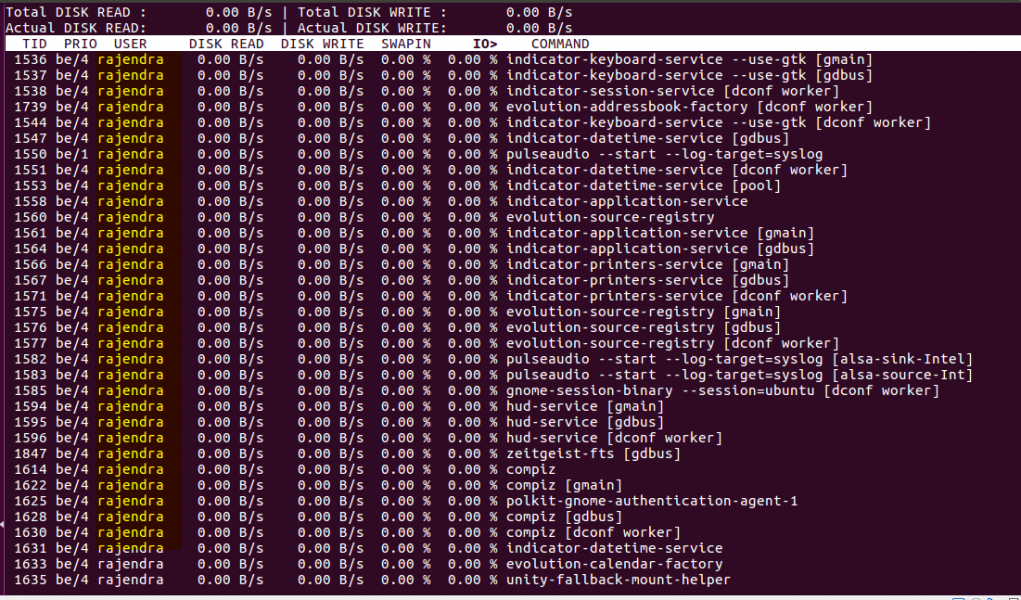
Monitor specific user processes
Run the below command to show only particular user processes. For example, we want to view only the user ‘rajendra’ processes.
Sudo iotop -u ‘rajendra’
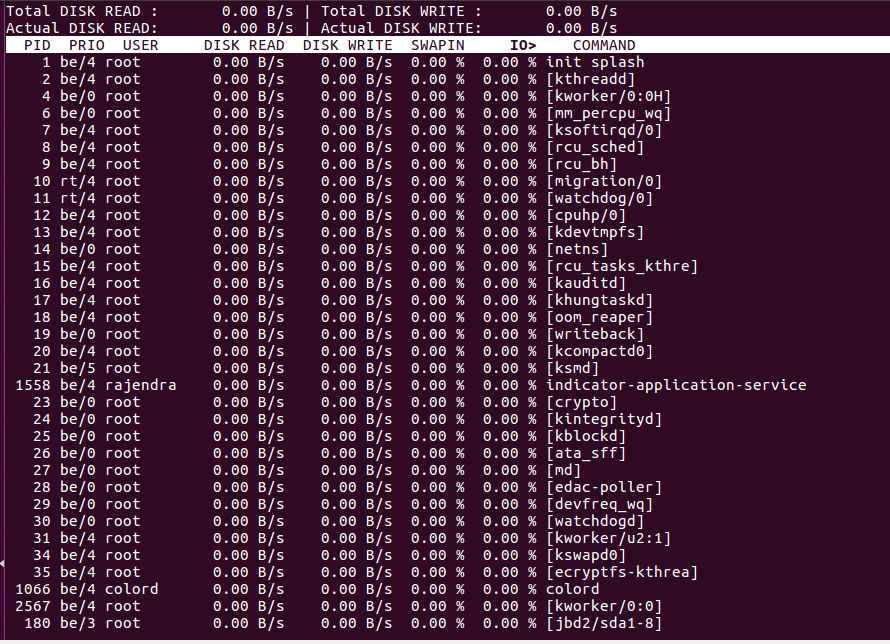
Monitor system processes:
To monitor the system processes, run the command:
Sudo iotop -P
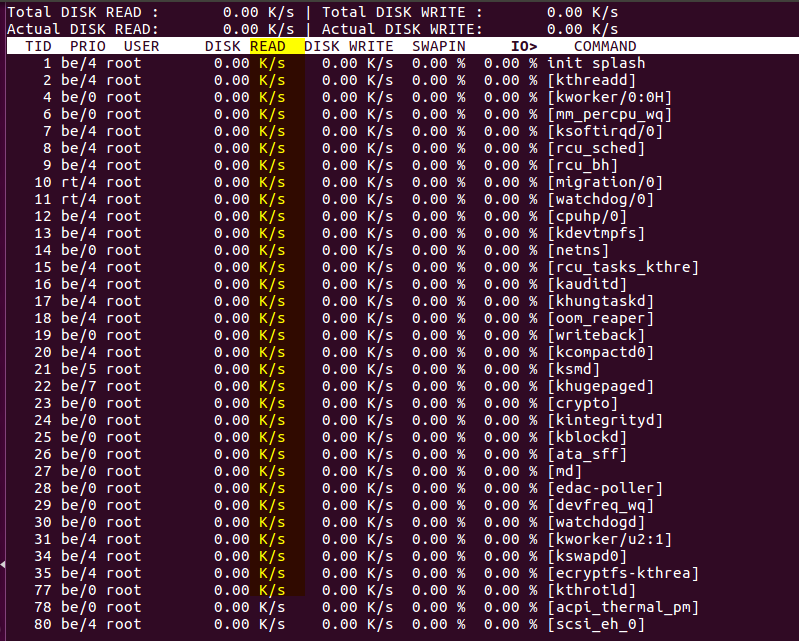
Change unit to KB/s instead of B/s:
Run the command with -k parameter:
Sudo iotop -k
Conclusion
In the article, we have learned to use the ‘iotop’ and ‘iostat’ commands with various configuration options. We can get the details about the individual processes; disks IO related information using these commands.
Table of contents
| Helpful Linux commands for SQL Server DBAs – top |
| Helpful Linux commands for SQL Server DBAs – iotop and iostat |

I am the author of the book "DP-300 Administering Relational Database on Microsoft Azure". I published more than 650 technical articles on MSSQLTips, SQLShack, Quest, CodingSight, and SeveralNines.
I am the creator of one of the biggest free online collections of articles on a single topic, with his 50-part series on SQL Server Always On Availability Groups.
Based on my contribution to the SQL Server community, I have been recognized as the prestigious Best Author of the Year continuously in 2019, 2020, and 2021 (2nd Rank) at SQLShack and the MSSQLTIPS champions award in 2020.
Personal Blog: https://www.dbblogger.com
I am always interested in new challenges so if you need consulting help, reach me at rajendra.gupta16@gmail.com
View all posts by Rajendra Gupta
- Understanding PostgreSQL SUBSTRING function - September 21, 2024
- How to install PostgreSQL on Ubuntu - July 13, 2023
- How to use the CROSSTAB function in PostgreSQL - February 17, 2023