
In this article, we will learn how to analyze data hosted in Azure Cosmos DB using Notebooks.
Introduction
Azure Cosmos DB is a NoSQL data repository that supports a variety of API types to consume the data hosted in it. Jupyter Notebooks is one of the popular methods to access data for almost any type of data repositories. These notebooks support various types of SDKs, programming languages and frameworks. Python is one of the most popular programming languages and is used for a variety of purposes including data analysis with libraries like pandas and numpy. These libraries can be very effective in processing schemaless data structures that are typically stored in Azure Cosmos DB. Let’s learn how we can analyze data hosted in Cosmos DB using Notebooks in this article.
Pre-requisites
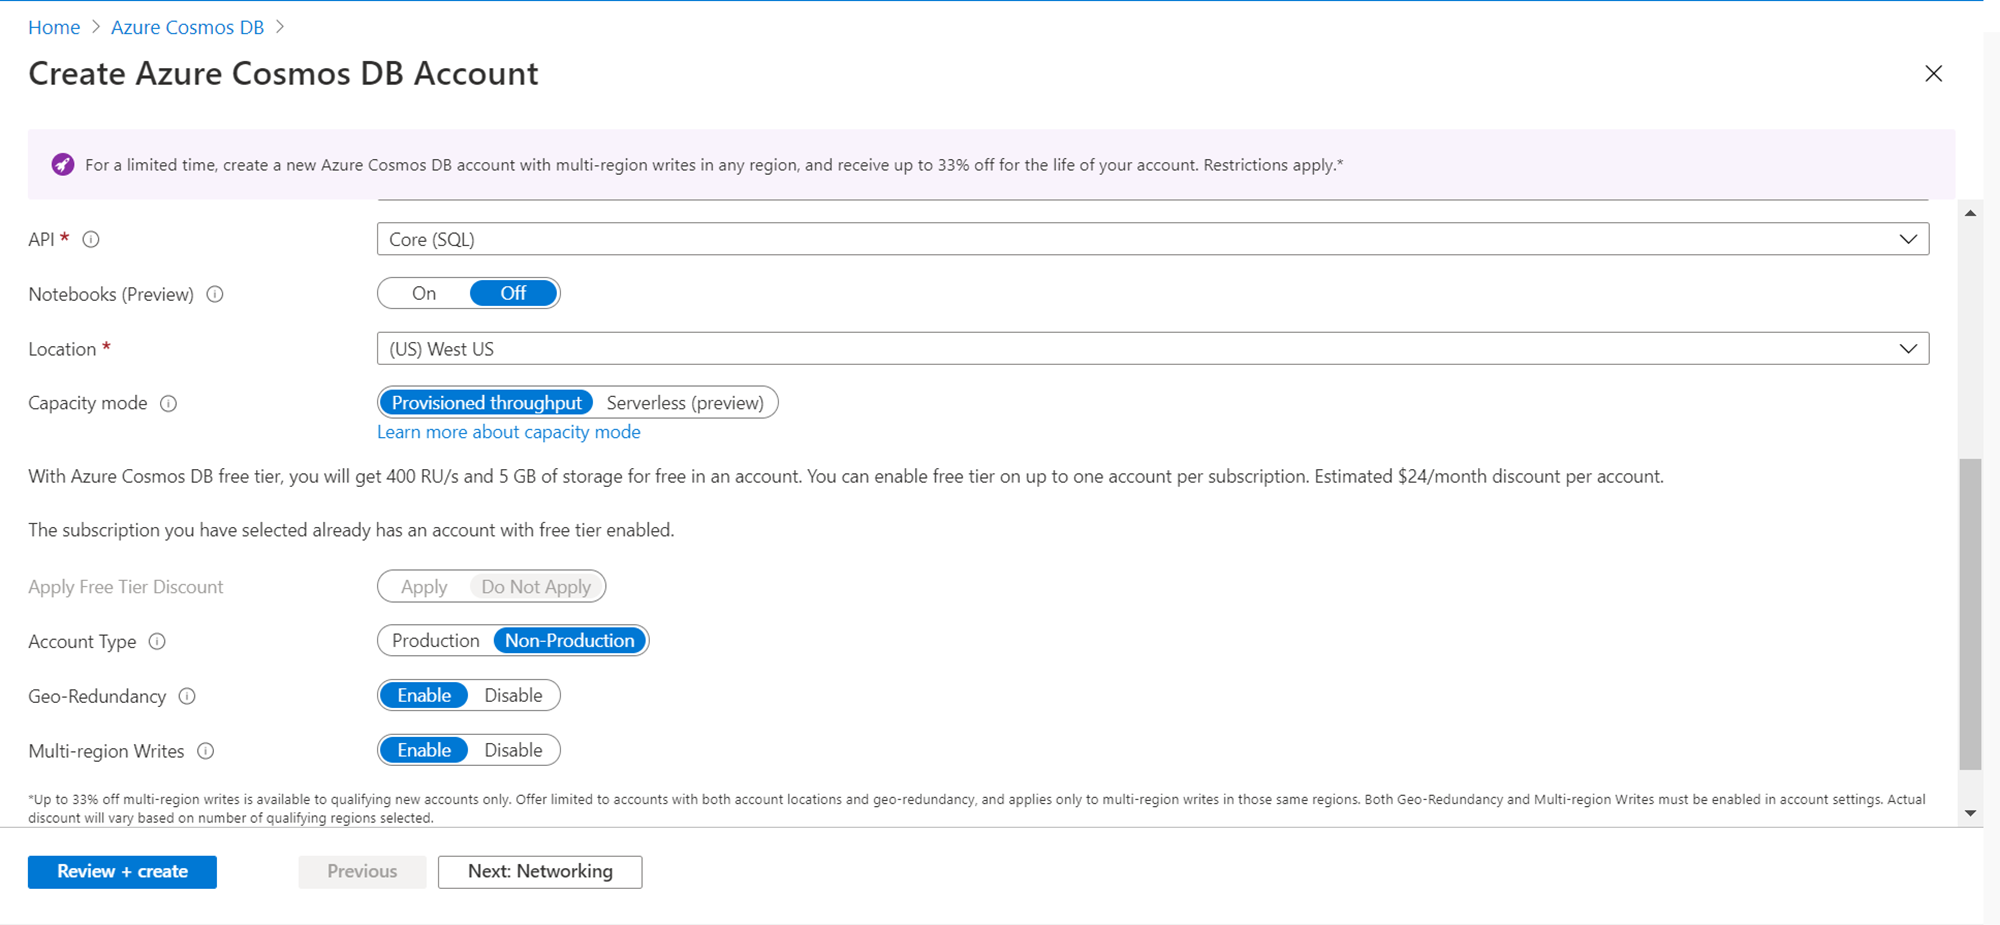
It is assumed that an Azure Cosmos DB account is already in place. In case not, then create a new account by opening the service and clicking on the New button. While creating the account, it provides an option to enable notebooks, which is Off by default. Ensure to switch “On” this option, as this will enable notebooks once the account is created. If you already have an account created, and this option was not turned on, on the console we would get an option to enable the notebooks. So, either way, ensure that the notebook feature is turned on. This feature is in preview as of the draft of this article, so it’s not yet recommended for use in a production environment till it goes generally available.
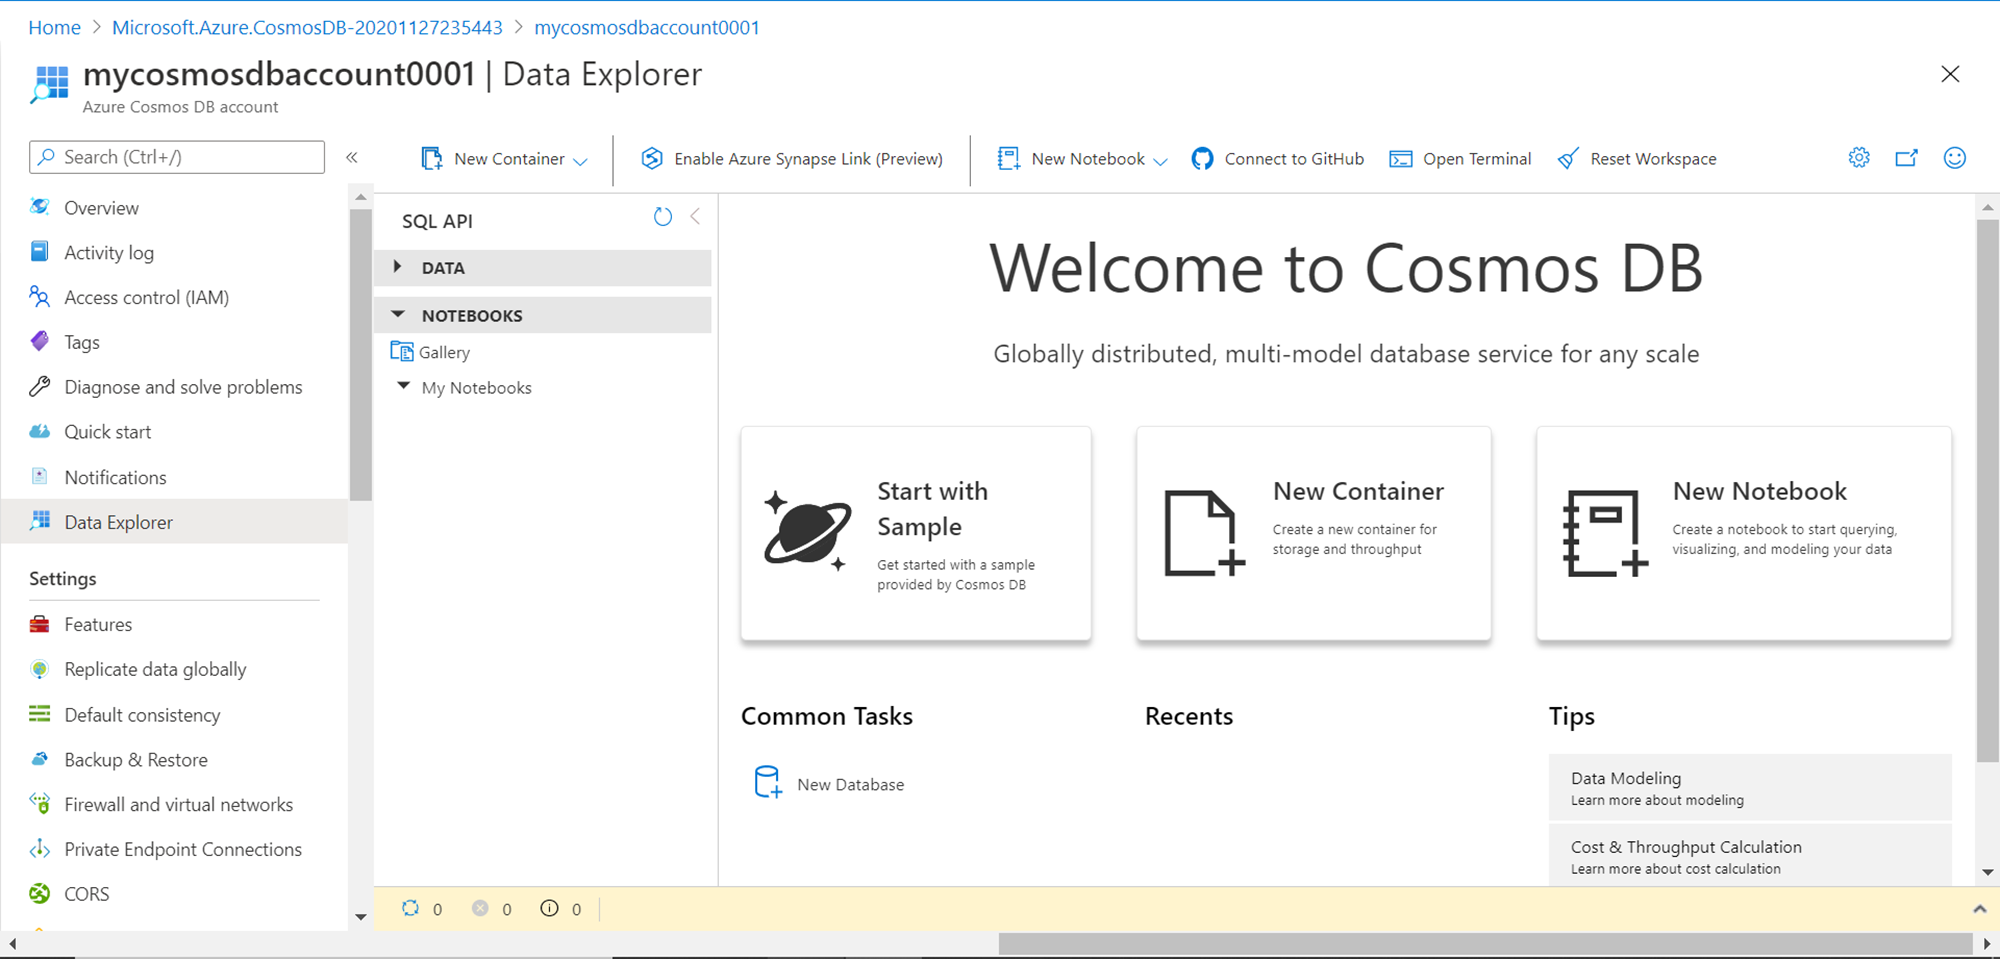
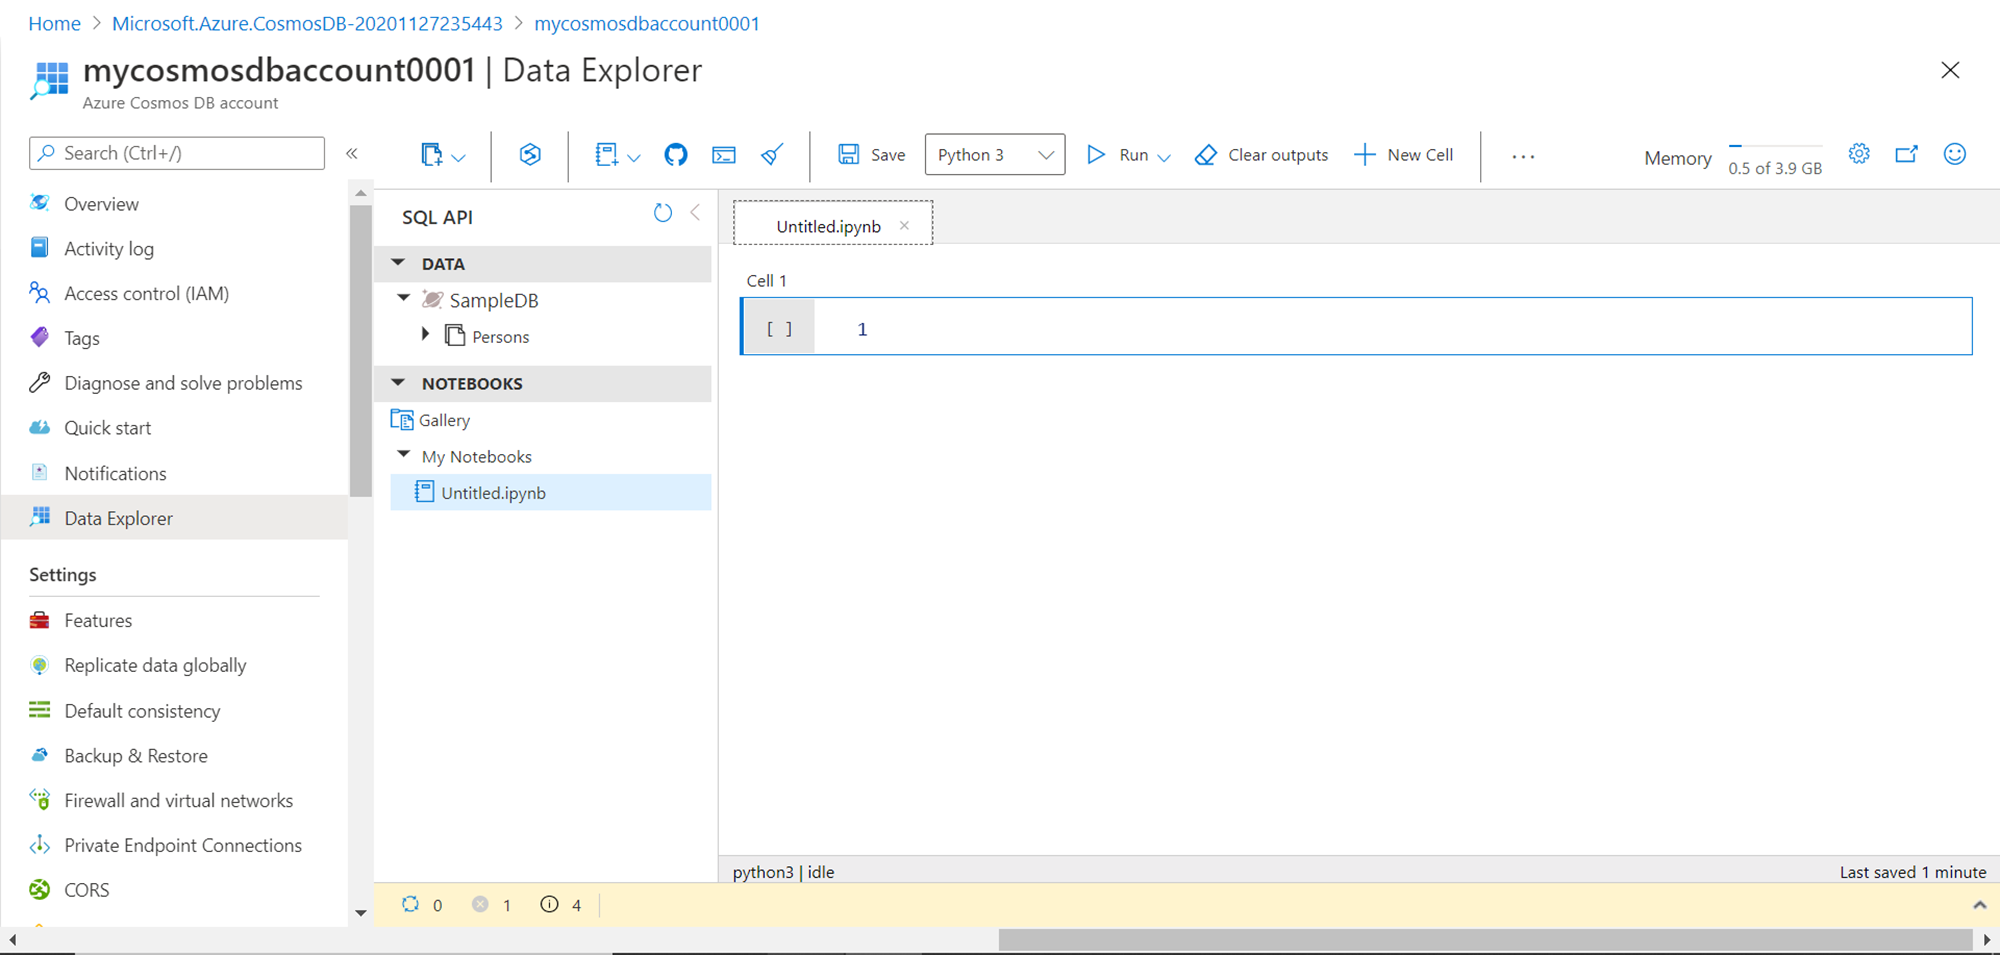
Once you have the account created with this feature turned on, when you open the account it would look as shown below. Navigate to the data explorer menu option, and under the Notebooks section, you would be able to see a gallery of notebooks as well as notebooks created by the end-user. In a new account, we would neither have any data nor any notebooks. We would create both in this exercise. Once we have an account that looks like this, our pre-requisite to start this exercise is met.
Azure Cosmos DB Notebooks
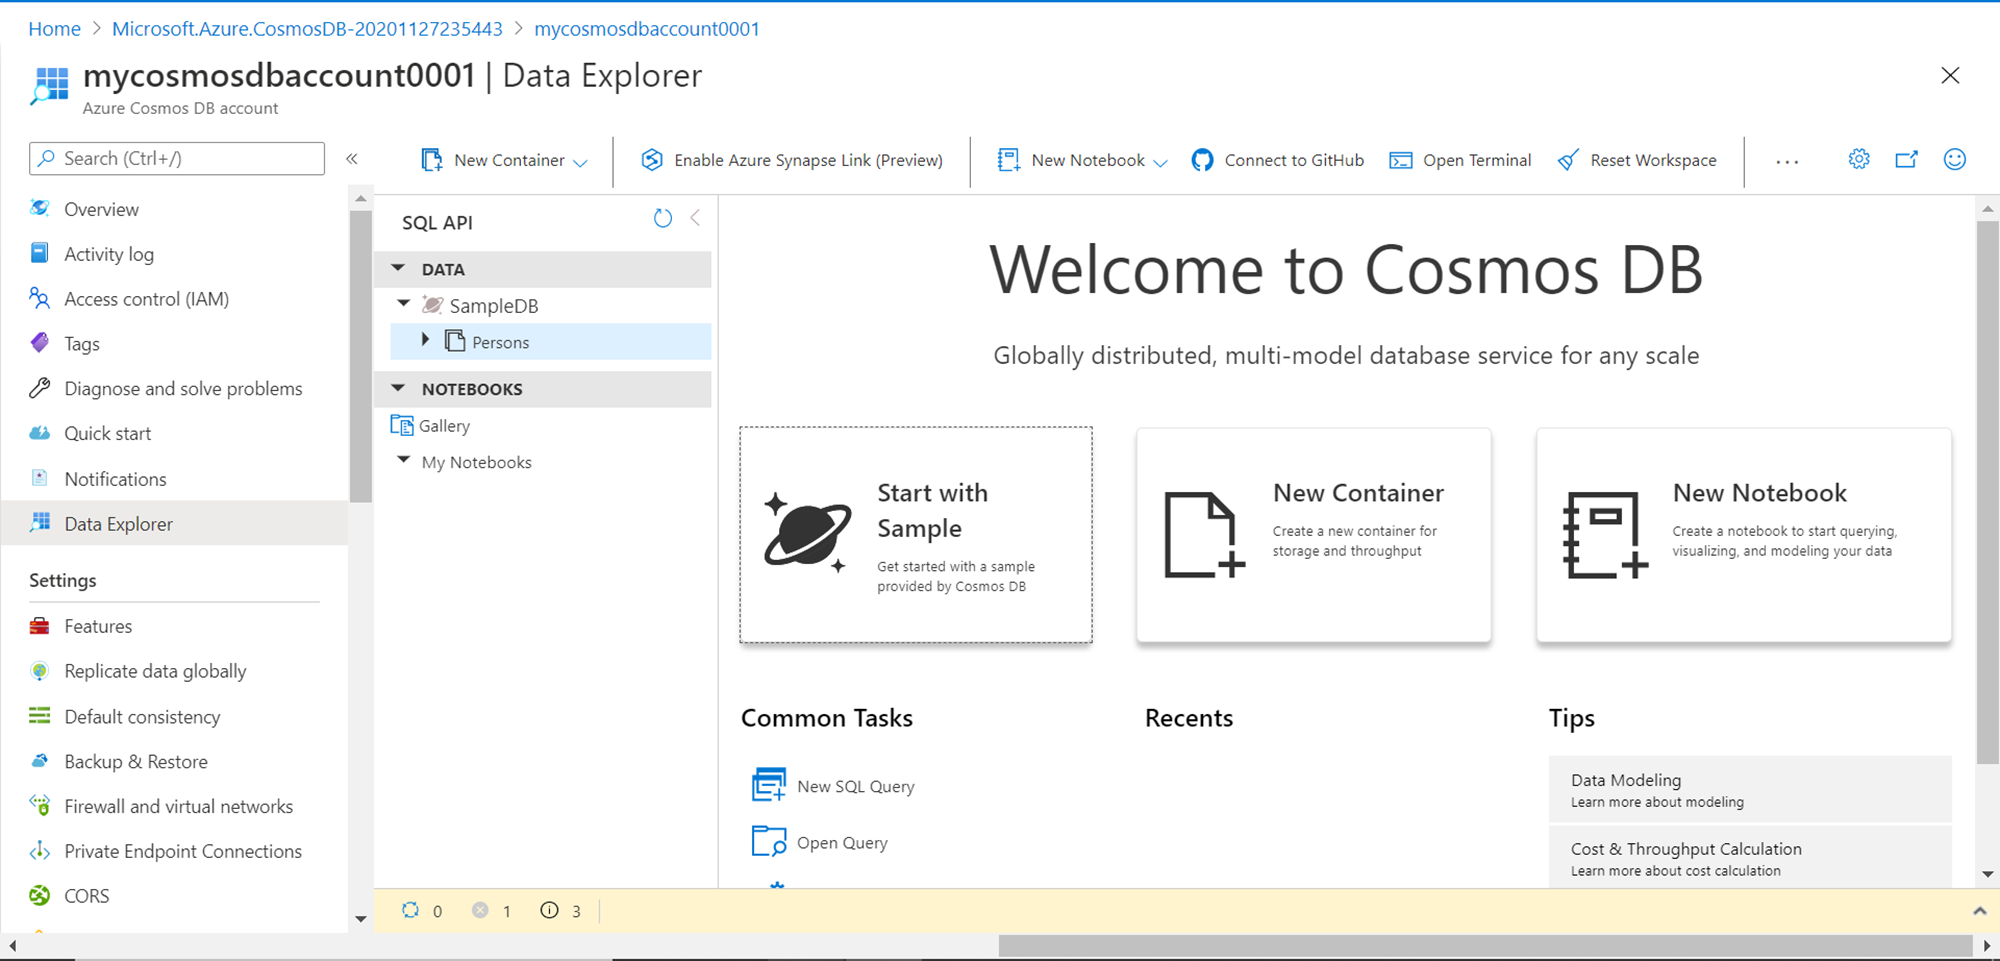
We intend to analyze data hosted in Azure Cosmos DB. We do not have any sample data available yet. There are two ways to create sample data. The first option is to click on the buttons “Start with Sample” or “New Container”. This would create a new database named Sample DB as well as a container under the same named “Persons” with some sample data in it as shown below. This is the easiest no-code approach to create sample data in Azure Cosmos DB.
Another way to create sample data is by using code executed from a Notebook. So, let us go ahead and create a new notebook. Click on the New Notebook button and it would create a new notebook named Untitled.ipnyb as shown below. The “.ipnyb” extension means an iron python notebook. We can rename this notebook and save it as well. If you carefully analyze the toolbar of the notebook, you would find that it provides the option to use different kernels like Python 3, C Sharp and a few others with Python 3 being the default. The memory available with this notebook instance is around 4 GB. We have options to add more cells that can contain text as well as code that can be executed and the output would be generated in the notebook. This output can be erased as well using the Clear outputs button. The interface provided in the notebook is near identical to Jupyter notebooks (for those who are aware of Jupyter Notebooks). By default, one cell is already added and we can start adding the text of code to this block.
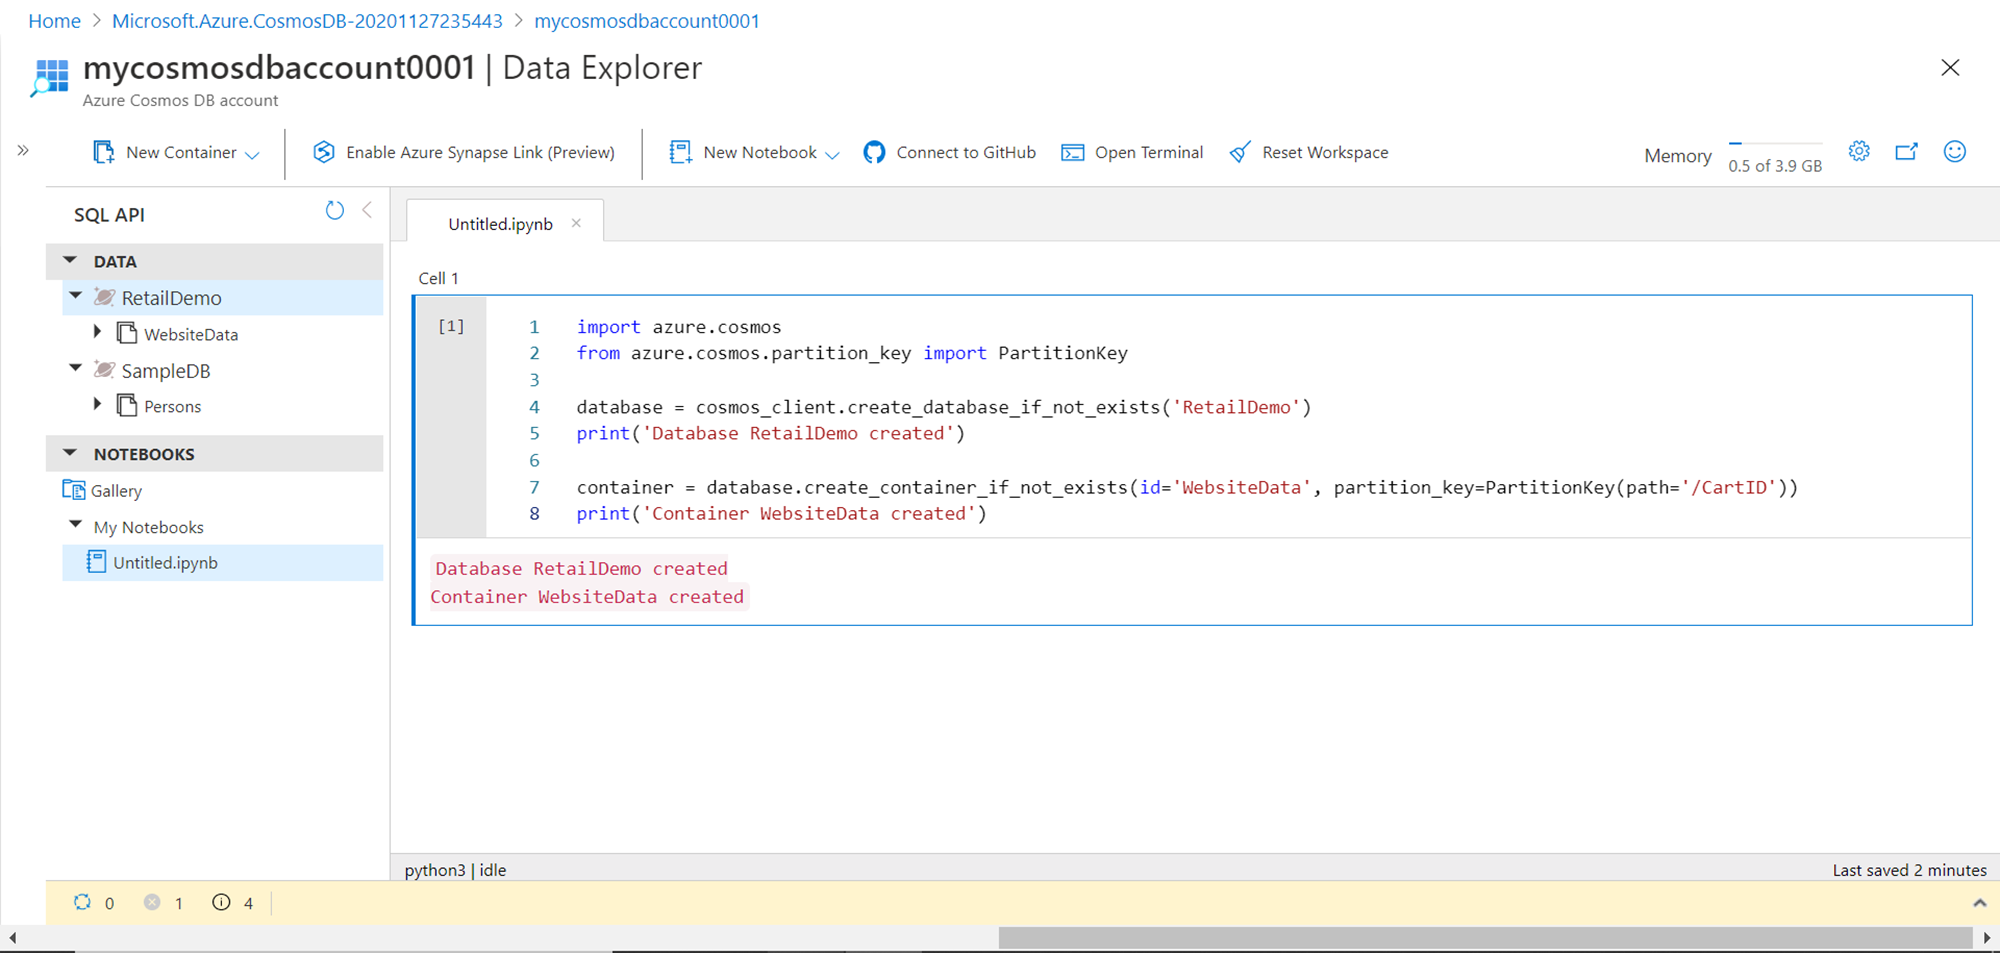
Type the code as shown below to create a new database and container. This is the first step towards creating a new sample data. In the first two lines of code, we are importing the azure.cosmos library which provides us the functions to perform the same operations on Azure Cosmos DB that are available from the console. Then we are creating a new database named “Retail Demo” and a new container named “WebsiteData”. Also, we are printing a confirmation message after the same gets created.
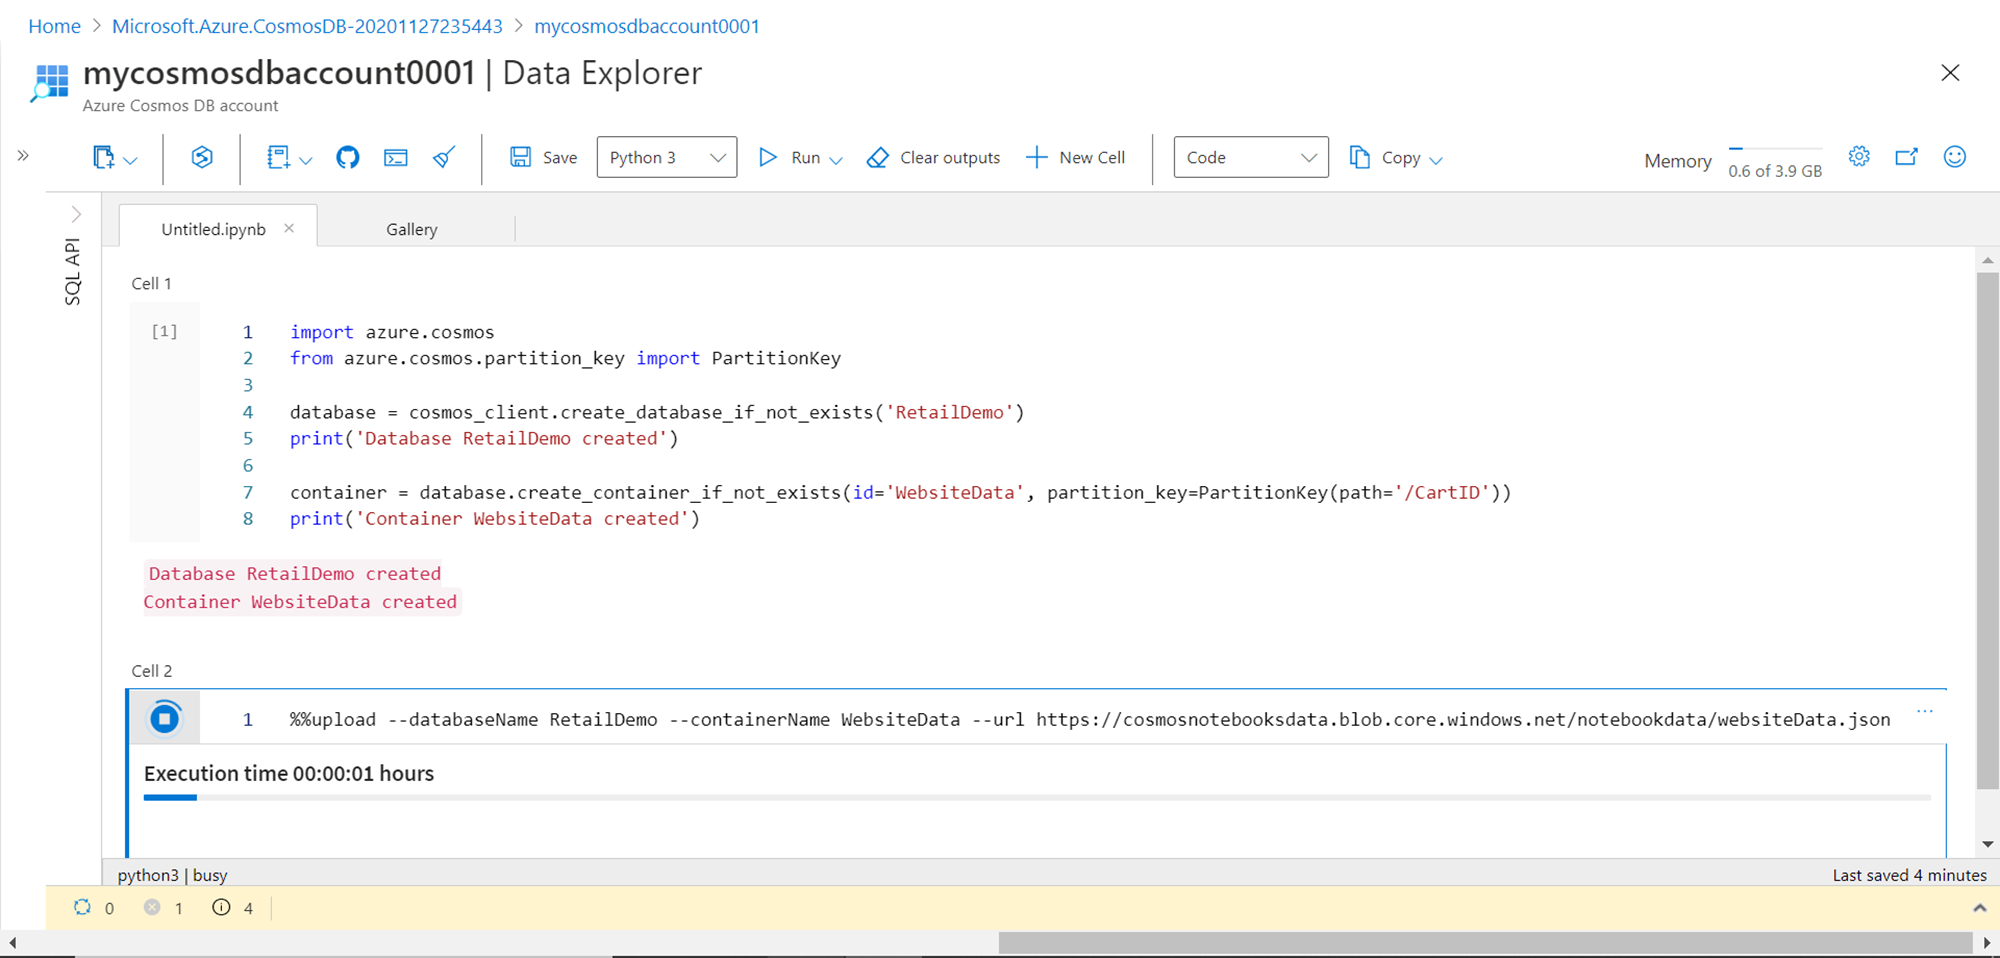
The next step is to populate the container with sample data. We can either remove the code specified in Cell 1 or we can add a new cell and execute the code in the new cell. To add a new cell, hover the mouse on Cell 1, and you would get a small pop-up to add code in a new cell. Once the new cell has been added, add the line of code shown below in Cell 2. Here we are using the upload command specifying the name of the database, container and a freely available sample JSON file from Azure that we can ingest into the container we already created earlier. Hover the mouse on the grey part of the cell and click on the execute button to execute the code. This would start the ingestion of sample data in the container. It may take a while to load the data depending on the write throughput capacity provisioned for the Azure Cosmos DB or container. To speed up the ingestion one can increase the provisioned capacity.
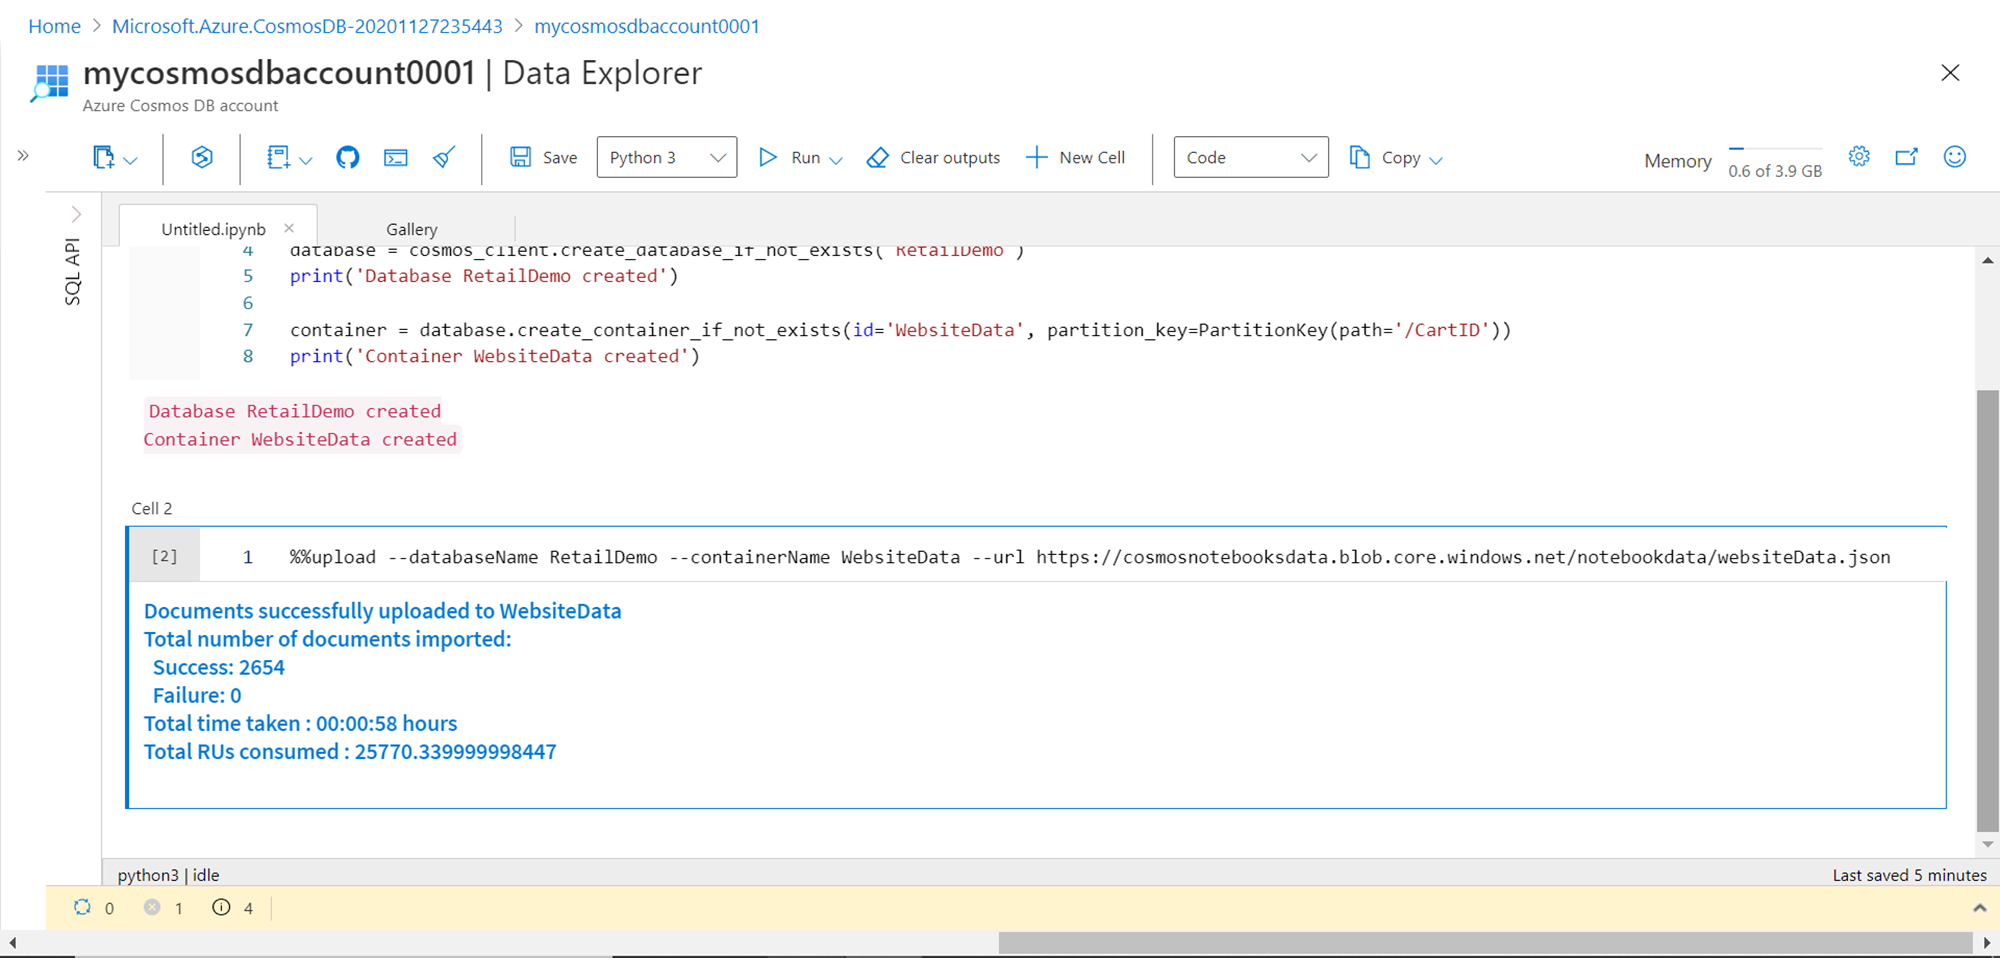
Once the data load completes, the result metrics would be reported as shown below. It would show the total number of records added to the container along with the time it took to load the data and the units consumed in this process.
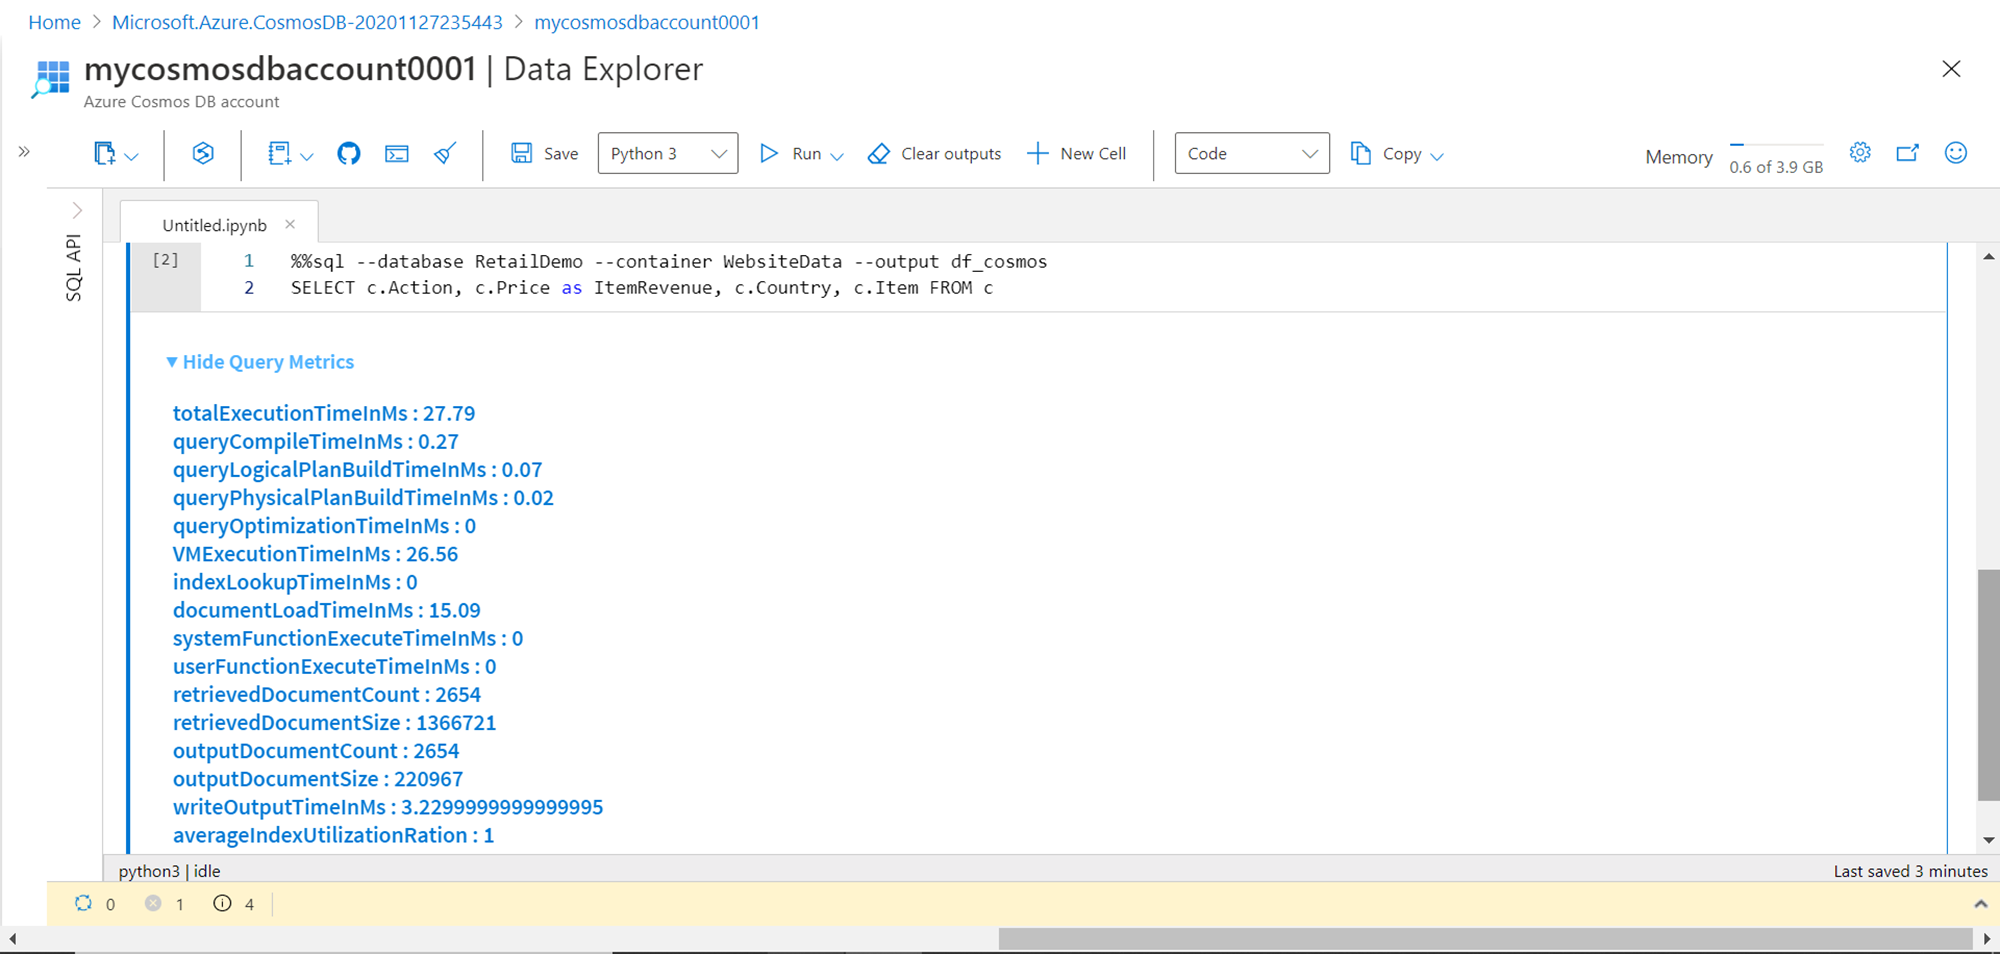
We intend to analyze this sample data using popular python libraries. The most common way of analyzing data in python is by populating a data frame with data from the data repository, and then analyzing it using popular data analysis and visualization libraries. We can use the SQL command to query the sample data and populate it in a new data frame as shown below. Once the execution completes the resulting metrics would be shown in the output. As shown below, these metrics provide a lot of detail regarding the performance of the query and the resulting dataset. This code populates the output dataset in a data frame named df_cosmos.
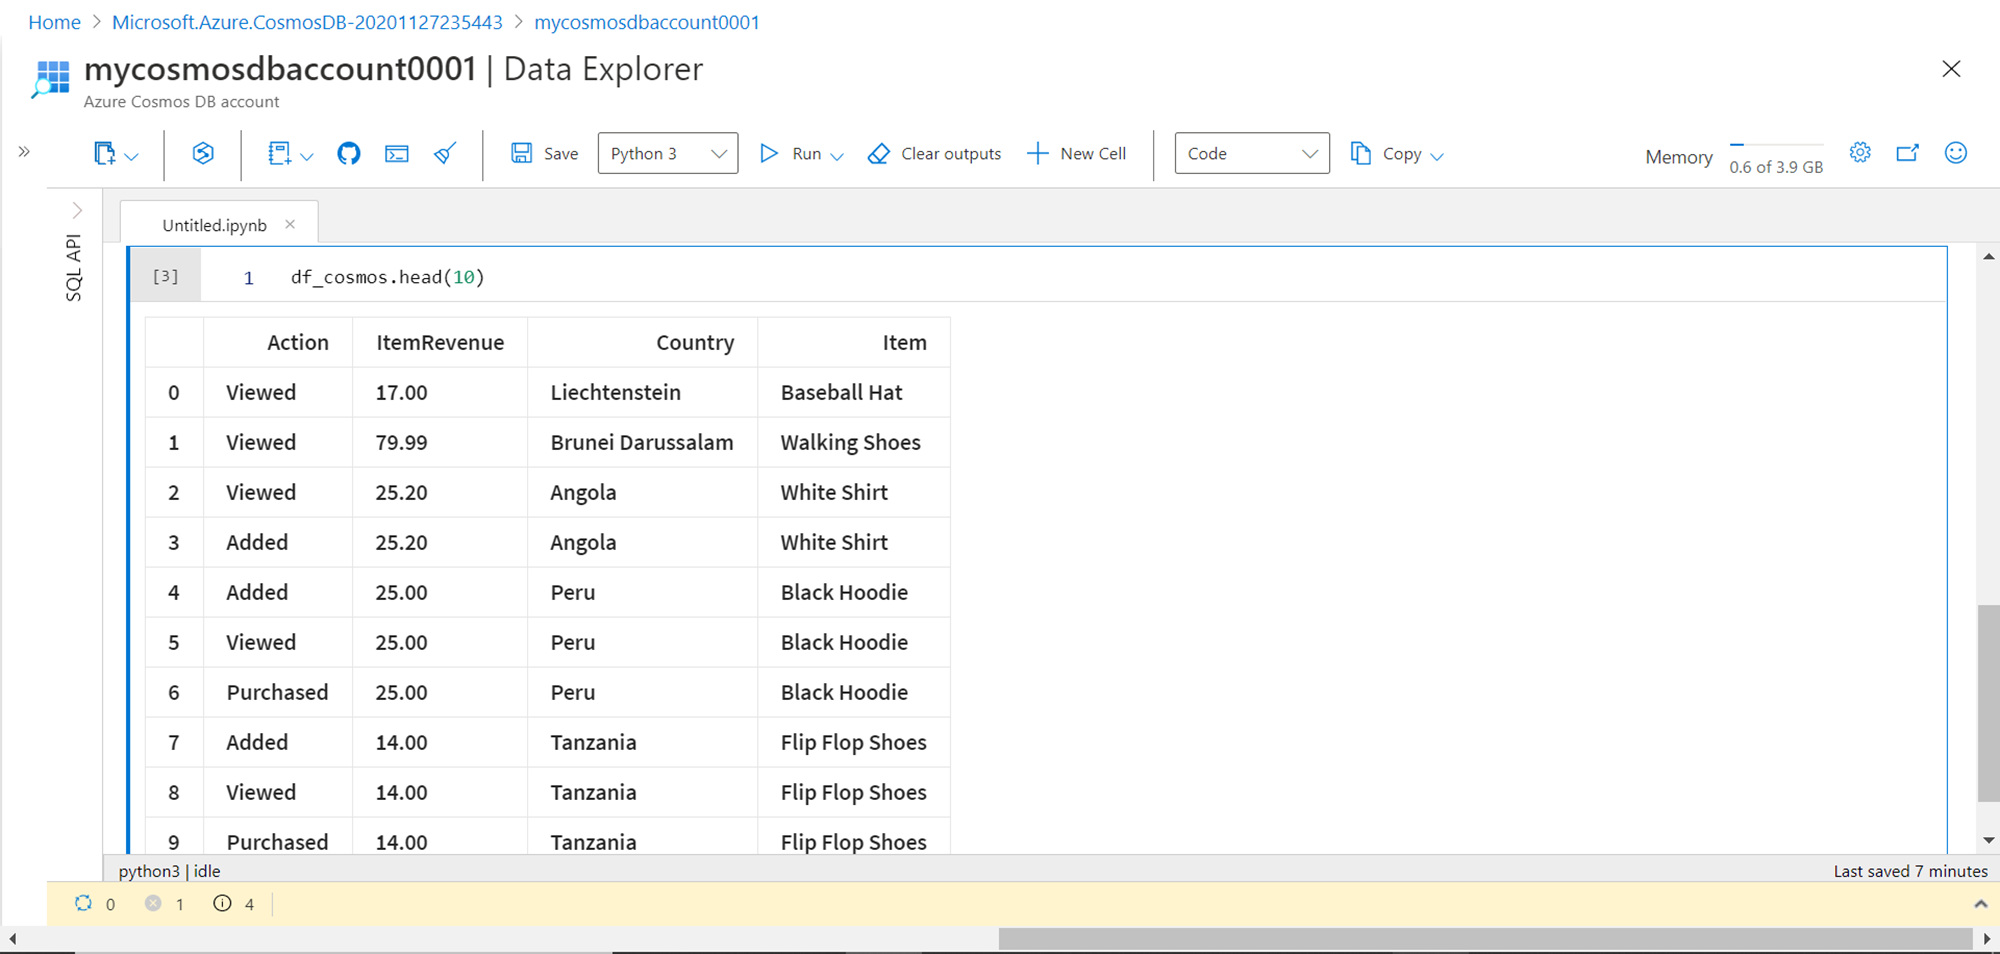
To preview the data, we can view the top ten records from the data frame by using the head function as passing its value of ten as shown below. Here we can see that we have four fields in the data frame.
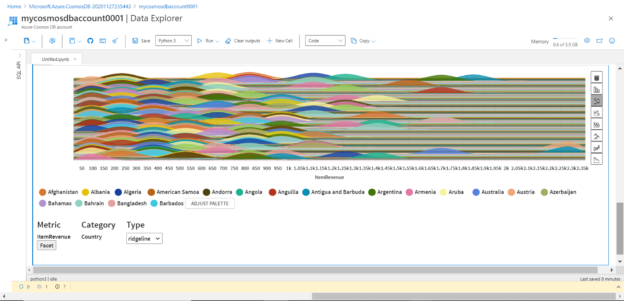
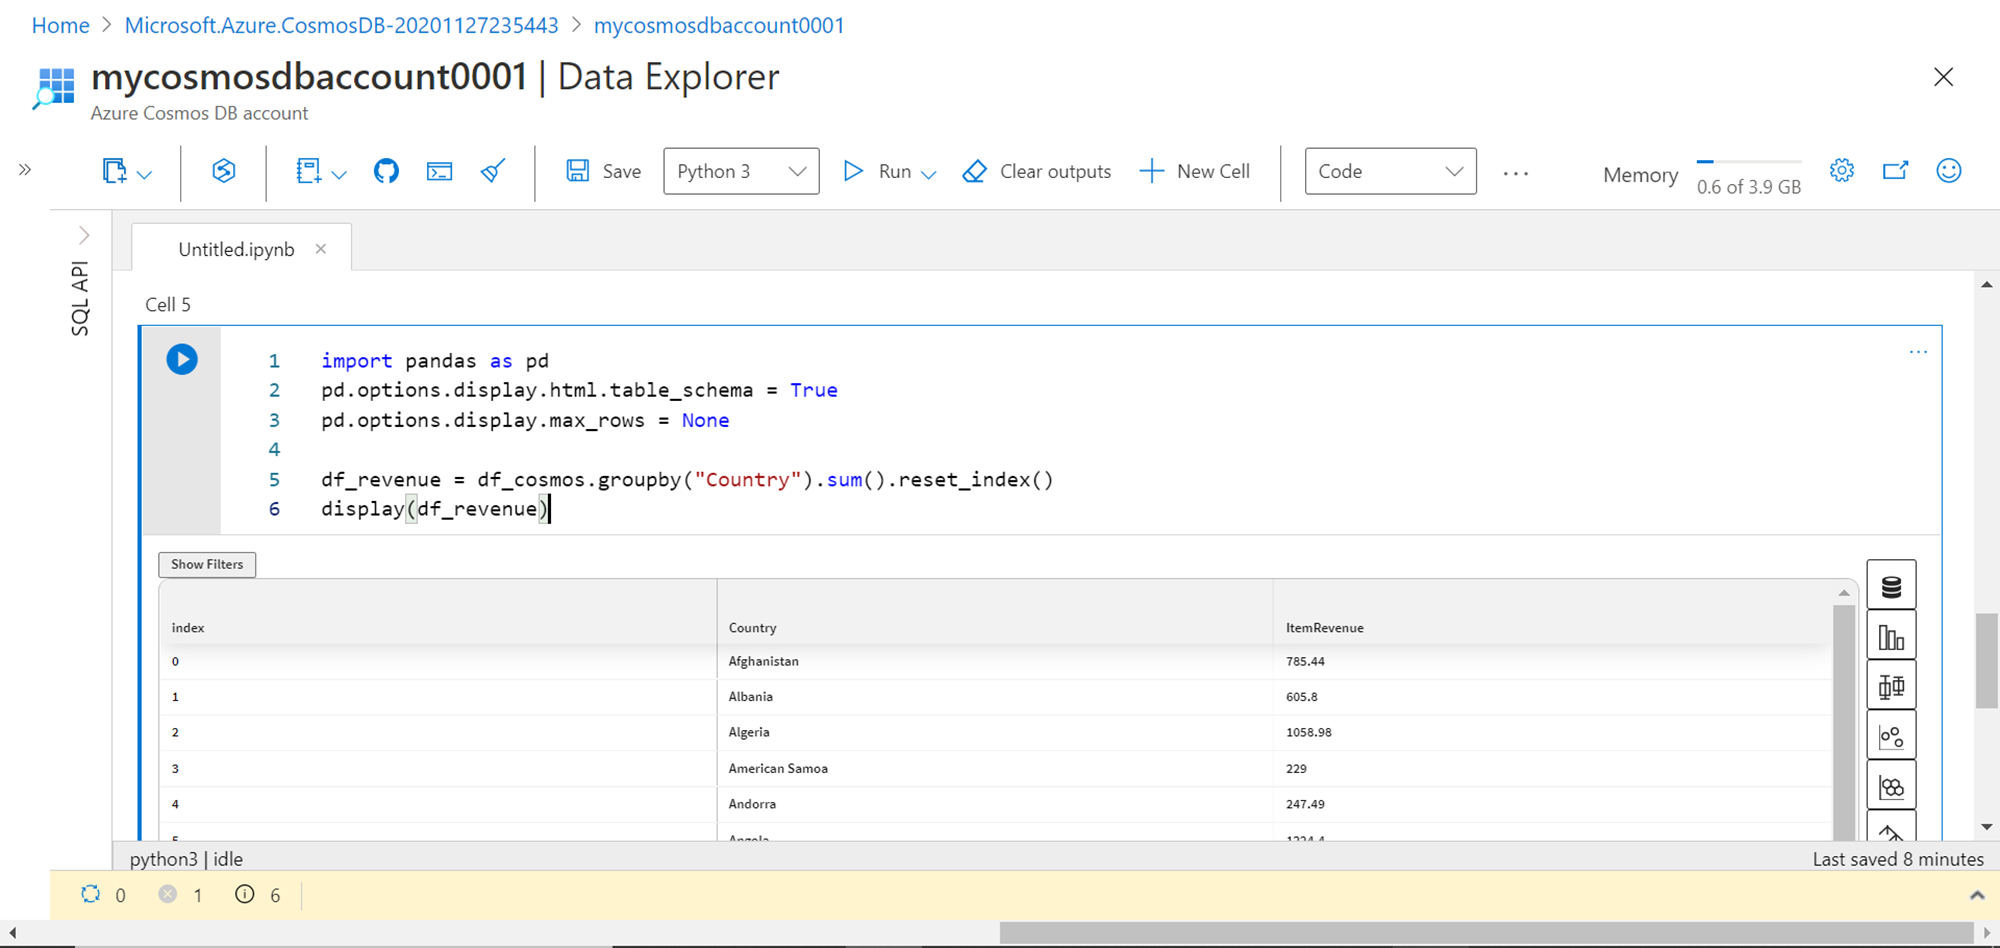
Now we intend to analyze this data using the popular python data processing library – pandas. These libraries are available in the python kernel as we can readily import it using the import directive as shown below. Once the pandas’ library object is created, we can start specifying options to configure it, and start using it on our data frame as shown below. Here we are grouping the data by Country attribute and the ItemRevenue attribute is summed up grouped by country. This processed output is assigned to a new data frame named df_revenue. To display the data in the data frame, the display function is used as shown below. The output is displayed in a tabular format, which provides options to filter the data as well as browse it in a paginated manner. The page numbers are visible at the bottom of the table.
On the right side of the table, it would display different options to analyze data using different graphs like bar-chart, box plot, network graph etc. Shown below is a ridgeline graph created using the box plot option. There are many graph categories and option in those categories which can be used to analyze the data without a lot of code. Python provides several such libraries that can be used in analyzing the data hosted in Azure Cosmos DB.

Conclusion
In this article, we started by creating an Azure Cosmos DB account with the notebooks option enabled. We then learned different options to create sample data. We created a new notebook and created data structures as well as populated it with sample data, and then we analyzed the same using the pandas library available in python.
Table of contents
| Getting started with Azure Cosmos DB Serverless |
| Analyzing data hosted in Azure Cosmos DB with Notebooks |
| Analyze Azure Cosmos DB data using Azure Synapse Analytics |
| Restore dedicated SQL pools in Azure Synapse Analytics |
| Copy data into Azure Synapse Analytics using the COPY command |

He has worked internationally with Fortune 500 clients in various sectors and is a passionate author.
View all posts by Rahul Mehta
- Finding Duplicates in SQL - February 7, 2024
- MySQL substring uses with examples - October 14, 2023
- MySQL group_concat() function overview - March 28, 2023