SQL Server is a very powerful tool and wherever I go, I see the tool being way much underutilized. Some people even don’t know about the features which are already in the SQL Server and they have not used it, like SQL Server Extended Events. Though, Extended Events is a way more complex and detailed topic which I cannot cover in just one article I will discuss one of its very good utilities out of the countless.
Here, I would like to give you about a small, simple yet a powerful way of using SQL Server Extended Events and monitoring SQL Server Deadlocks.
As we all are aware of deadlocks and ideally speaking we would never want to hear about it in our production environments but deadlocks do happen and we do want to get in the Root Cause Analyses of the deadlocks.
Before going into the details of my simple script which I will discuss in detail very shortly, I want to let you know about the any prerequisite for the script to run, there are NONE. Yes! If you are using Microsoft SQL Server 2008 or later then you don’t have to do anything else just understand what I will explain here and use the script. That’s all, you have the solution right then and there. It was already inside the SQL Server just out of the box (not the query but the product features I am using).
So let’s start and discuss extended events features which I will be using. Extended events capture a lot of data from the system and you should explore that as well. There have a lot of useful detailed information which is already being captured. Please have a look at this event on MSDN here.
As of now, we are only concerned about the deadlocks. The deadlocks are also captured in the system trace extended event with the object name (a column in the system trace) as “xml_deadlock_report”. So, we will be querying a system view “sys.fn_xe_file_target_read_file” to query the extended event trace “system_health” which is already running by default so you don’t have to setup anything. You can get detailed information about the system view “sys.fn_xe_file_target_read_file” from MSDN here.
This query will give you only the deadlocks captured.The script is pretty simple and also has comments so I won’t go into each and every detail here and will not describe everything but some important points should be mentioned here.
First we mentioned earlier we get the deadlock graph which is by default in an XML Format. After that, we need to parse the XML so that we can read it easily. There is a Microsoft SQL Server Stored Procedure for that and it’s pretty handy, i.e. “sp_xml_preparedocument”. You can get detailed information about the system stored procedure on MSDN here.
We will parse the document using the system stored procedure and will get the following columns from the deadlock graph XML. The columns which we be getting will be under the following node so we start reading XML from that particular node “event/data/value/deadlock/process-list/process”.
Columns read from the XML Deadlock:
Id
The Process ID which is required to uniquely identify each process.Hostname
Hostname is the machine name of the application which is requesting the query.Loginname
Login name is the SQL/Windows authentication login which is authenticated to initiate the session.Clientapp
Client Application like dot net framework application or SQL Server Management studio etc.Inputbuf & executionStack/frame
Above two columns get the actual TSQL executed by the sessions. This is the most important part as it will have all the actual details in it.Lastbatchcompleted
The time of the deadlock is captured in this column. This is also important for logging and analysis purpose.
There is one variable “@GetDeadLocksForLastMinutes”, which you can configure as per your requirements, which is to set as a threshold of time (in minutes) for the deadlock script to watch for events back in history. The script then captures all the information from the XML and puts it into a Temporary Table and loops through all the Deadlocks which might have occurred in the timeframe mentioned. At the end it will just display all the information captured in it using simple columns. All the result set columns are discussed in this article later.
In my client’s production environment, I have added an alert for the deadlocks captured. I run this script every hour to get an alert with all the detailed information. This can be configured according to your needs and client’s requirements.
Here is my script to get all the deadlocks data!
|
1 2 3 4 5 6 7 8 9 10 11 12 13 14 15 16 17 18 19 20 21 22 23 24 25 26 27 28 29 30 31 32 33 34 35 36 37 38 39 40 41 42 43 44 45 46 47 48 49 50 51 52 53 54 55 56 57 58 59 60 61 62 63 64 65 66 67 68 69 70 71 72 73 74 75 76 77 78 79 80 81 82 83 84 85 86 87 88 89 90 91 92 93 94 95 96 97 |
/* Declaration of the variables #DeadLockXMLData to store each Dead lock XML from the extended Event #DeadLockDetails to store deadlock process, victim and application information @GetDeadLocksForLastMinutes For how many number of Minutes to watch for */ SET NOCOUNT ON; CREATE TABLE #DeadLockXMLData(DeadLockXMLData XML,DeadLockNumber INT) CREATE TABLE #DeadLockDetails(ProcessID nVARCHAR(50),HostName nVARCHAR(50),LoginName nVARCHAR(100) ,ClientApp nVARCHAR(100), Frame nVARCHAR(MAX),TSQLString nVARCHAR(MAX),DeadLockDateTime DATETIME,IsVictim TINYINT,DeadLockNumber INT) DECLARE @DeadLockXMLData AS XML,@DeadLockNumber INT,@getInputBuffer CURSOR,@Document AS INT, @SQLString NVARCHAR (MAX),@GetDeadLocksForLastMinutes INT; SET @GetDeadLocksForLastMinutes = 5; /*INSERT THE DEADLOCKS FROM EXTENDED EVENTS TO TEMP TABLES & FILTER ONLY DEADLOCKS*/ INSERT INTO #DeadLockXMLData(DeadLockXMLData,DeadLockNumber) SELECT CONVERT(XML, event_data) DeadLockXMLData,ROW_NUMBER() OVER (ORDER BY Object_name) DeadLockNumber FROM sys.fn_xe_file_target_read_file(N'system_health*.xel', NULL, NULL, NULL) WHERE OBJECT_NAME = 'xml_deadlock_report' /*START A CURSOR TO LOOP THROUGH ALL THE DEADLOCKS AS YOU MIGHT GET MUTLTIPLE DEADLOCK IN PRODUCTION AND YOU WOULD WANT ALL OF THEM*/ SET @getInputBuffer = CURSOR FOR SELECT DeadLockXMLData,DeadLockNumber FROM #DeadLockXMLData OPEN @getInputBuffer FETCH NEXT FROM @getInputBuffer INTO @DeadLockXMLData,@DeadLockNumber WHILE @@FETCH_STATUS = 0 BEGIN SET @Document = 0 SET @SQLString = '' EXEC sp_xml_preparedocument @Document OUTPUT, @DeadLockXMLData /*INSERT PARSED DOCUMENT'S DATA FROM XML TO TEMP TABLE FOR READABILITY*/ INSERT INTO #DeadLockDetails(ProcessID,HostName,LoginName,ClientApp,Frame,TSQLString,DeadLockDateTime,DeadLockNumber) SELECT ProcessID, HostName,LoginName,ClientApp, Frame,TSQL AS TSQLString,LastBatchCompleted,@DeadLockNumber FROM OPENXML(@Document, 'event/data/value/deadlock/process-list/process') WITH ( ProcessID [varchar](50) '@id', HostName [varchar](50) '@hostname', LoginName [varchar](50) '@loginname', ClientApp [varchar](50) '@clientapp', CustomerName [varchar](100) '@clientapp', TSQL [nvarchar](4000) 'inputbuf', Frame nVARCHAR(4000) 'executionStack/frame', LastBatchCompleted nVARCHAR(50) '@lastbatchcompleted' ) /*UPDATE THE VICTIM SPID TO HIGHLIGHT TWO QUERIES SEPARETELY, THE PROCESS (WHO CREATED THE DEADLOCK) AND THE VICTIM*/ UPDATE #DeadLockDetails SET IsVictim = 1 WHERE ProcessID IN ( SELECT ProcessID FROM OPENXML(@Document, 'event/data/value/deadlock/victim-list/victimProcess') WITH ( ProcessID [varchar](50) '@id', HostName [varchar](50) '@hostname', LoginName [varchar](50) '@loginname', ClientApp [varchar](50) '@clientapp', CustomerName [varchar](100) '@clientapp', TSQL [nvarchar](4000) 'inputbuf', Frame nVARCHAR(4000) 'executionStack/frame', LastBatchCompleted nVARCHAR(50) '@lastbatchcompleted' ) ) EXEC sp_xml_removedocument @Document FETCH NEXT FROM @getInputBuffer INTO @DeadLockXMLData,@DeadLockNumber END CLOSE @getInputBuffer DEALLOCATE @getInputBuffer /*GET ALL THE DEADLOCKS AS A RESULT IN EASY READABLE TABLE FORMAT AND ANALYZE IT FOR FURTHER OPTIMIZATION */ SELECT DeadLockDateTime,HostName,LoginName,ClientApp,ISNULL(Frame,'')+' **'+ISNULL(TSQLString,'')+'**' VictimTSQL ,(SELECT ISNULL(Frame,'')+' **'+ISNULL(TSQLString,'')+'**' AS TSQLString FROM #DeadLockDetails WHERE DeadLockNumber = D.DeadLockNumber AND ISNULL(IsVictim,0) = 0) ProcessTSQL FROM #DeadLockDetails D WHERE DATEDIFF(MINUTE,DeadLockDateTime,GETDATE()) <= @GetDeadLocksForLastMinutes AND IsVictim = 1 ORDER BY DeadLockNumber DROP TABLE #DeadLockXMLData,#DeadLockDetails |
For a demo I will create a deadlock and SQL Server Extended Events will capture it. We will then run the script to get that in a simple readable format for further analysis.
So, let’s start to create a deadlock (if you are lucky like me you will not be having deadlocks in your production so you have to create one).

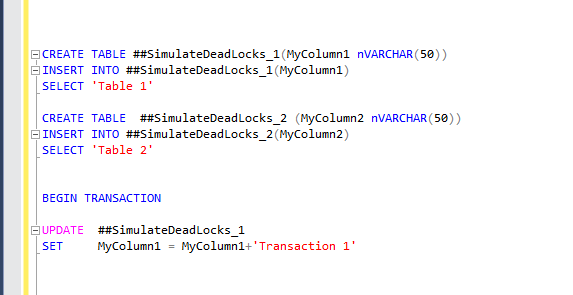
First, create two tables and start an UPDATE on the first table as shown below in the figure:
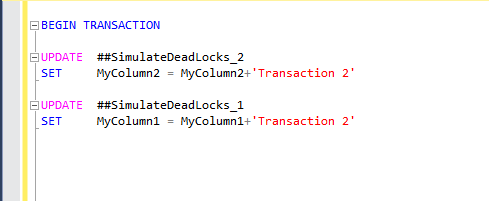
After the first transaction has been completed (keep in mind it’s NOT committed yet). You need to start another transaction and update both the tables so that the second transaction should be waiting for the first, as shown in the figure below:

So, now the last step to create a deadlock is update the second table again in the first session so that both the sessions should try to grab each other’s resources (which are already waiting for other) and thus creating a deadlock.

So, there you go. Congratulations you have a deadlock!
Now, grab my script and just run it. The Extended Event might take couple of minutes to write the current deadlock to the file so be patient it will give you the results. One you run the query it will give you the deadlocks occurred in last 5 minutes.
So, now you will have a result set and this is the detailed information about the deadlock captured. I have captured the most important yet basic columns from the deadlock graphs but this is not end of the world. You can get more and more details from the deadlock graph and customize this script as well.
The columns of the table are mentioned below for your reference and explanation:
DeadLockDateTime
This is the time when the actual deadlock happened. The trace might take couple of minutes to populate the deadlock but the time will be accurate.HostName
The machine name which is accessing the data. This is the application server or the client application machine name. This is important to identify the system which is trying to access the data.LoginName
The SQL/Windows authenticated login name which is used to access the database. This is critical to identify which login is being used to access the data.ClientApp
The client application name will be provided in this column. It will be like SQL Server Management Studio or the dot net framework application or whichever application you are using to get the data to the user.VictimTSQL
This is the TSQL for the session which was chosen as the deadlock victim and didn’t complete its processing.ProcessTSQL
This is the TSQL for the process which was executed successfully but caused the deadlock to happen.
In the table above the most important columns are the Victim and Process TSQL along with the Application name. After executing and getting all the information about the deadlock, now you can do further analysis and fix the problem. I cannot provide a solution for deadlocking as its way more complicated than just identifying the TSQL involved in the deadlock. But this is a good start to remove the deadlocks from the systems.
- How to identify slow running queries in SQL Server - May 31, 2017
- Adaptive Query Processing in SQL Server 2017 - April 28, 2017
- What is the SQL Server Virtual Log file and how to monitor it - April 26, 2017


