

In this article, we will talk about the deadlocks in SQL Server, and then we will analyze a real deadlock scenario and discover the troubleshooting steps.
In general, we can find out various theoretical advice and examples about the deadlock problems on the web but, in this article, we will tackle a true deadlock story and learn the solution steps so that we’ll get a chance to work on a case based problem.
First of all, let’s explain the deadlock concept. A deadlock problem occurs when two (or more than two) operations already want to access resources locked by the other one. In this circumstance, database resources are affected negatively because both processes are constantly waiting for each other. This contention issue is terminated by the SQL Server intervention. It chooses a victim from the transactions who are involved in the deadlock, forces it to rollback all actions.
As can be seen from this explanation, deadlock in SQL Server is a special contention problem; also, each deadlock has a unique characteristic, so the solution has different approaches according to problem characteristics. Now, let’s take a glance at the problem scenario.
The problem sceneraio
In this real scenario, an in-house application returns an error to the users, and users notify the development team about this error.
The development team realizes that it is a deadlock issue, but they could not find the main reason for the problem. Under these circumstances, the team decides to receive consultancy service from an experienced database administrator. In the next sections, we will learn how database administrators analyze and resolve this deadlock problem.
Prerequisites
The development team was using the following table to store the order numbers, and the following query was used to create the first row of the day.
|
1 2 3 4 5 6 7 8 9 10 11 12 13 14 15 |
CREATE TABLE [TestTblCounter]( [Id] [int] IDENTITY(1,1) NOT NULL PRIMARY KEY, [SerialNumber] [int] NULL, [LogDate] [datetime] NULL) GO IF NOT EXISTS(SELECT Id FROM TestTblCounter WHERE LogDate = CONVERT(VARCHAR(100), GETDATE(), 112)) BEGIN INSERT INTO TestTblCounter VALUES ('1', CONVERT(VARCHAR(100), GETDATE(), 112) ) END |
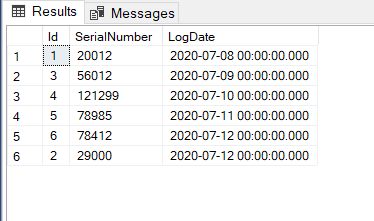
The data structure of the table below is similar to the below illustration; namely, there is only one row per day.
I am using the following stored procedure to create a new order number.
|
1 2 3 4 5 6 7 8 9 10 11 12 13 14 |
CREATE PROCEDURE CreateLogNo AS DECLARE @LogNo AS VARCHAR(50), @LogCounter AS INT= 0; BEGIN TRAN; UPDATE TestTblCounter SET SerialNumber = SerialNumber + 1 WHERE LogDate = CONVERT(VARCHAR(100), GETDATE(), 112); SELECT @LogCounter = SerialNumber FROM TestTblCounter WITH(TABLOCKX) WHERE LogDate = CONVERT(VARCHAR(100), GETDATE(), 112); SELECT @LogCounter AS LogNumber; COMMIT TRAN |
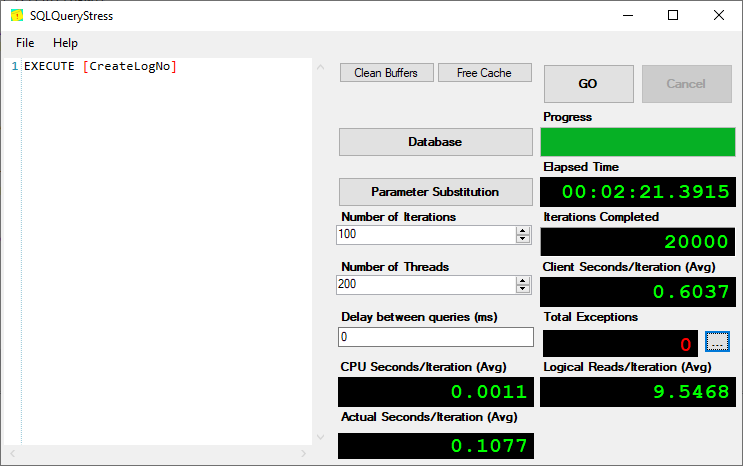
We will also use the SQLQueryStress tool to generate a similar workload of the production system.
Monitoring the deadlocks in SQL Server with system_health session
The database administrator decided to research the deadlocks problems because of the error message. The error message obviously was indicating a deadlock problem. As a first step, he decided to check the system_health session for the deadlocks.
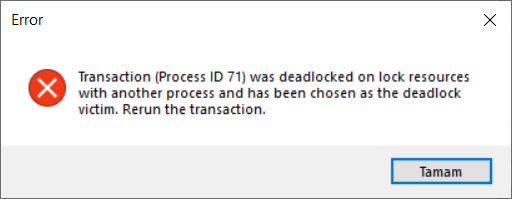
Transaction (Process ID XX) was deadlocked on lock resources with another process and has been chosen as the deadlock victim. Rerun the transaction.
The system_health is the default extended event session of the SQL Server, and it started automatically when the database engine starts. The system_health session collects various system data, and one of them is deadlock information. The following query reads the .xel file of the system_health session and gives information about the deadlock problems which were occurred. The system_health session can be a good starting point to figure out the deadlock problems. The below query helps to find out the deadlock problems which is captured by the system_health session.
|
1 2 3 4 5 6 7 8 9 10 11 12 13 14 |
DECLARE @xelfilepath NVARCHAR(260) SELECT @xelfilepath = dosdlc.path FROM sys.dm_os_server_diagnostics_log_configurations AS dosdlc; SELECT @xelfilepath = @xelfilepath + N'system_health_*.xel' DROP TABLE IF EXISTS #TempTable SELECT CONVERT(XML, event_data) AS EventData INTO #TempTable FROM sys.fn_xe_file_target_read_file(@xelfilepath, NULL, NULL, NULL) WHERE object_name = 'xml_deadlock_report' SELECT EventData.value('(event/@timestamp)[1]', 'datetime2(7)') AS UtcTime, CONVERT(DATETIME, SWITCHOFFSET(CONVERT(DATETIMEOFFSET, EventData.value('(event/@timestamp)[1]', 'VARCHAR(50)')), DATENAME(TzOffset, SYSDATETIMEOFFSET()))) AS LocalTime, EventData.query('event/data/value/deadlock') AS XmlDeadlockReport FROM #TempTable ORDER BY UtcTime DESC; |
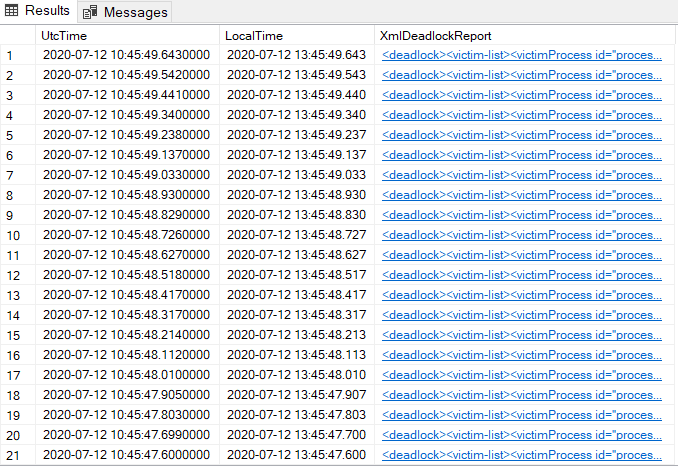
When we click any row of the XmlDeadlockReport column, the deadlock report will appear.
Monitoring the deadlocks in SQL Server using Extended Events
The database administrator found some clues about the deadlock problem through the captured data by the system_health session. However, he thought that the system_health session shows the more recent events because of the file size limitations, so it cannot be reliable to detect all deadlocks in SQL Server. So, he decided to create a new extended event session that can capture all the deadlocks.
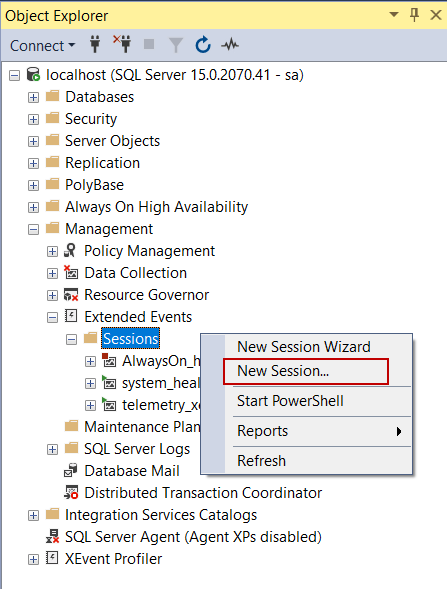
Extended Event is a system monitoring tool that helps to collect events and system information from SQL Server. With the help of the XEvent, we can also capture deadlock information from SQL Server. Firstly, we will launch SQL Server Management Studio and navigate to Session, which is placed under the Management folder. Right-click on the Sessions folder and select New Session.
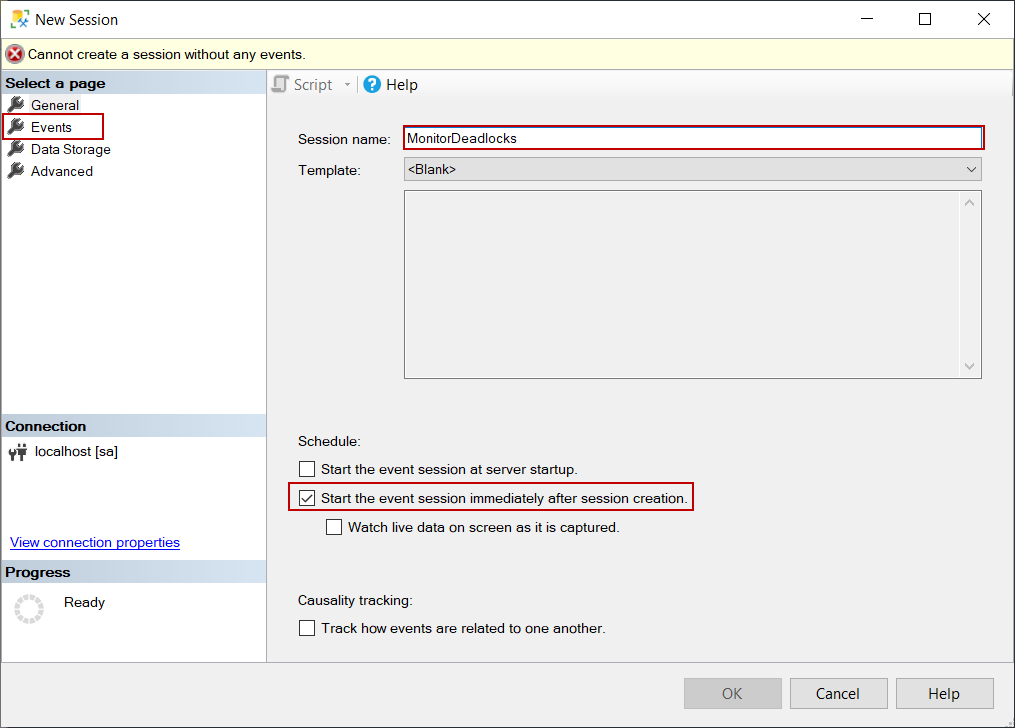
In the New Session screen, we will give a name to the session and check the Start the event session immediately after the session creation checkbox; thus, the session will be started after the completion of the creating process.
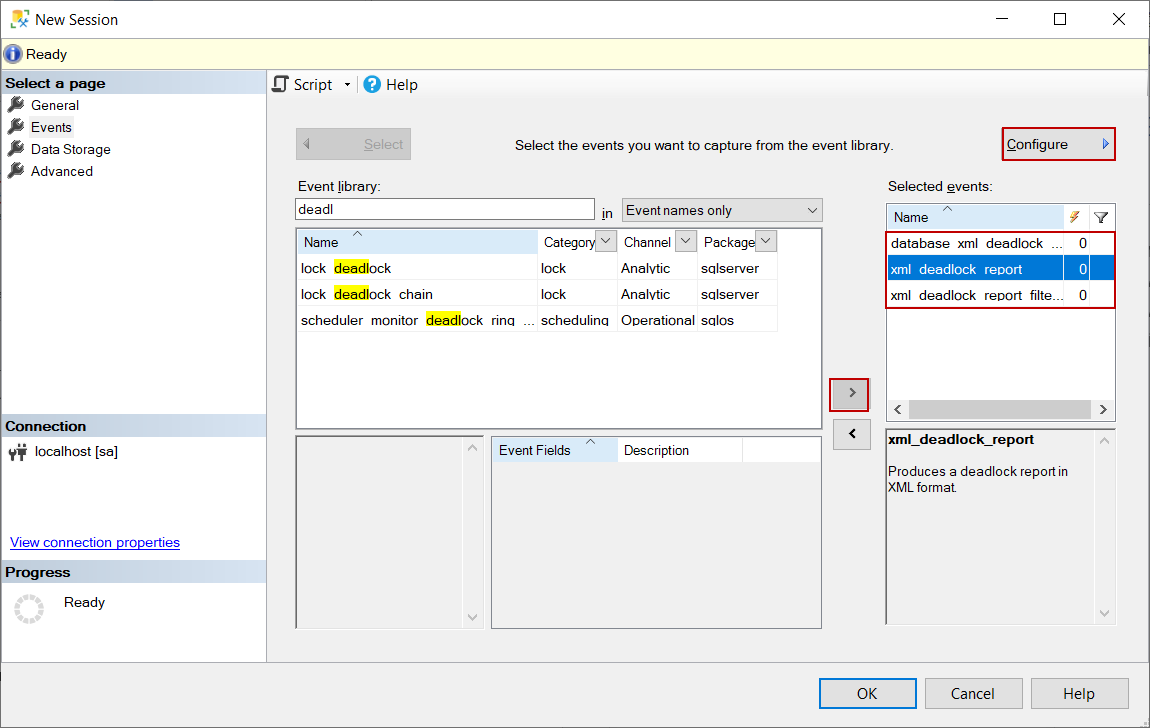
On the Event tab, we select the events which we want to capture. For this session, we will select the following events:
- database_xml_deadlock_report
- xml_deadlock_report
- xml_deadlock_report_filtered
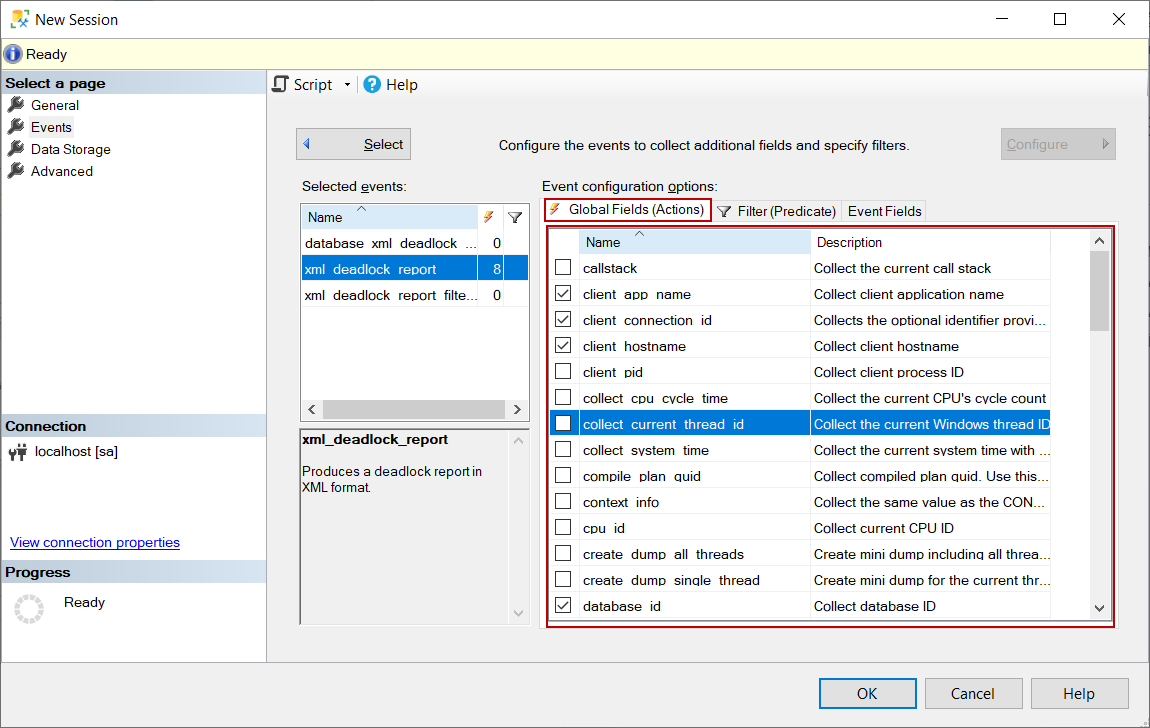
We will click the Configure button and select global events that will be captured with the events:
- client app name
- client connection id
- client hostname
- database id
- database name
- nt username
- username
- sql text
- username
On the Data Storage tab, we will select the event_file type to store the captured data and click the OK button.
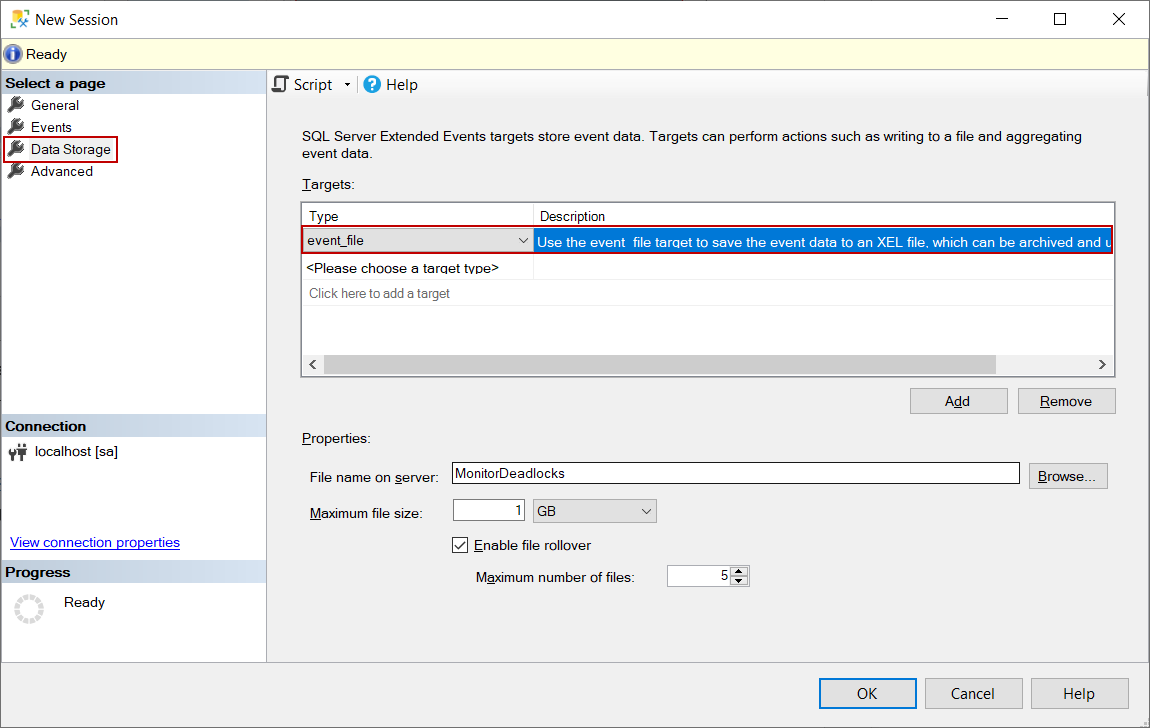
The session will be created and then started automatically to capture the deadlock events.
Analyzing and resolving deadlocks in SQL Server
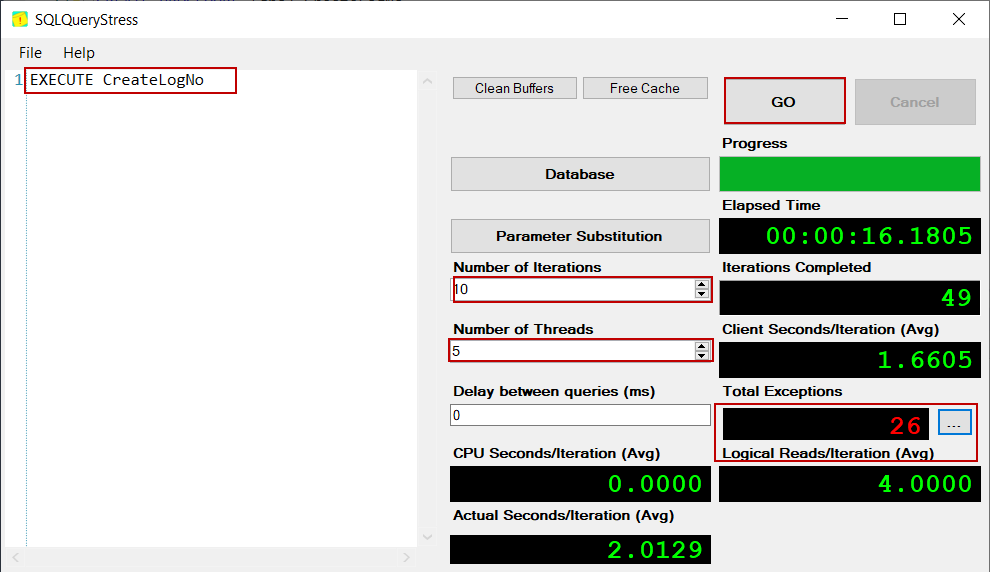
In this section, firstly, we will simulate the deadlock problem and then try to find out the main reason for the deadlock issue. We start the SQLQueryStress with the following parameters and wait for the completion of the query execution process.
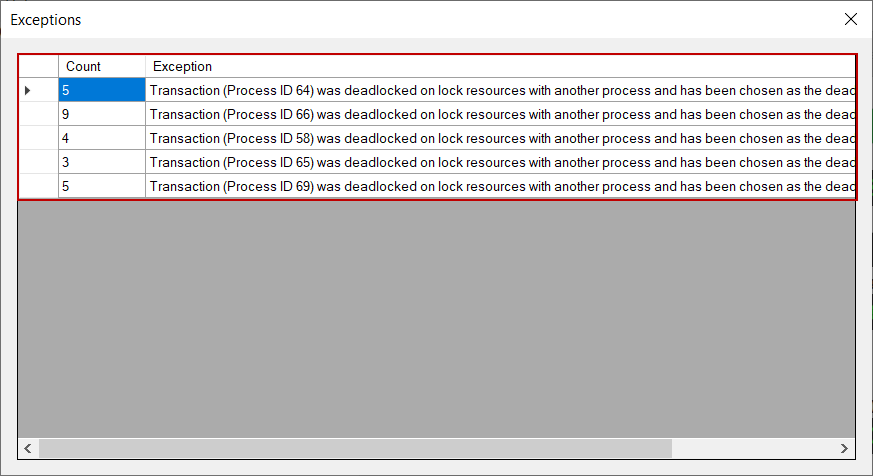
When we open the details of the exception, it shows exceptions message.
To find out more details about the deadlock issue, we need to check out the extended event session, which was created to capture the deadlock events. We expand the MonitorDeadlock session and right-click on the target node then select the View Target Data. The captured deadlocks will be shown in the right pane.
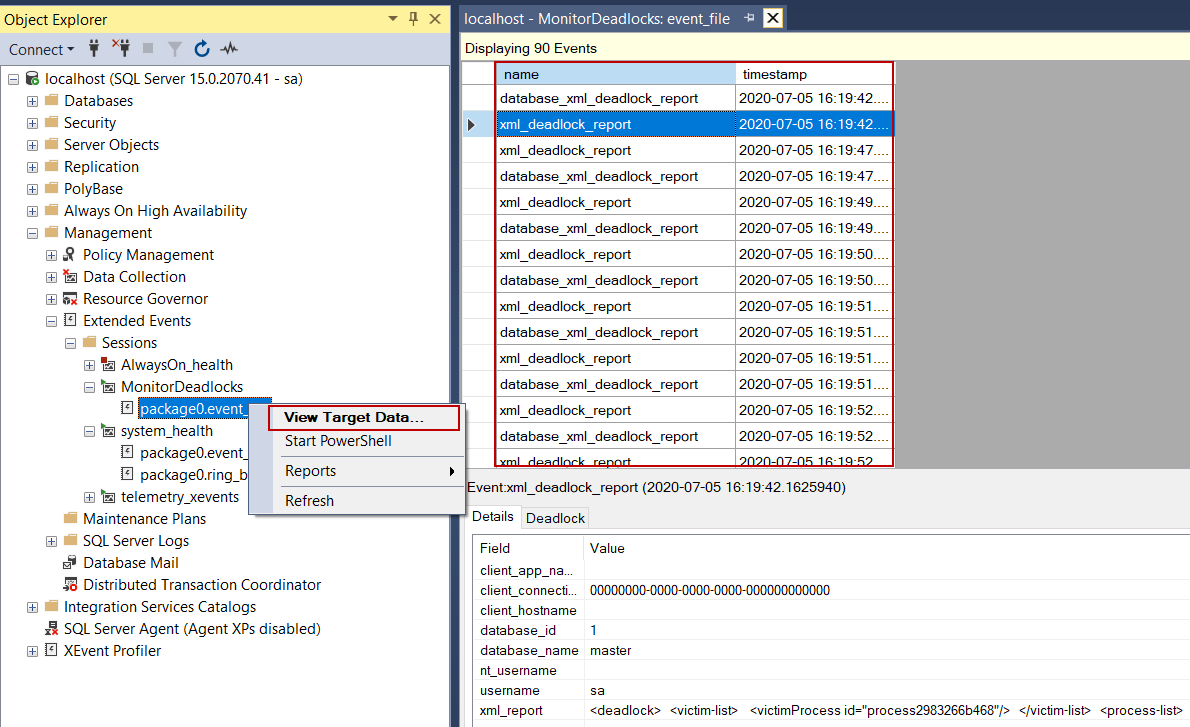
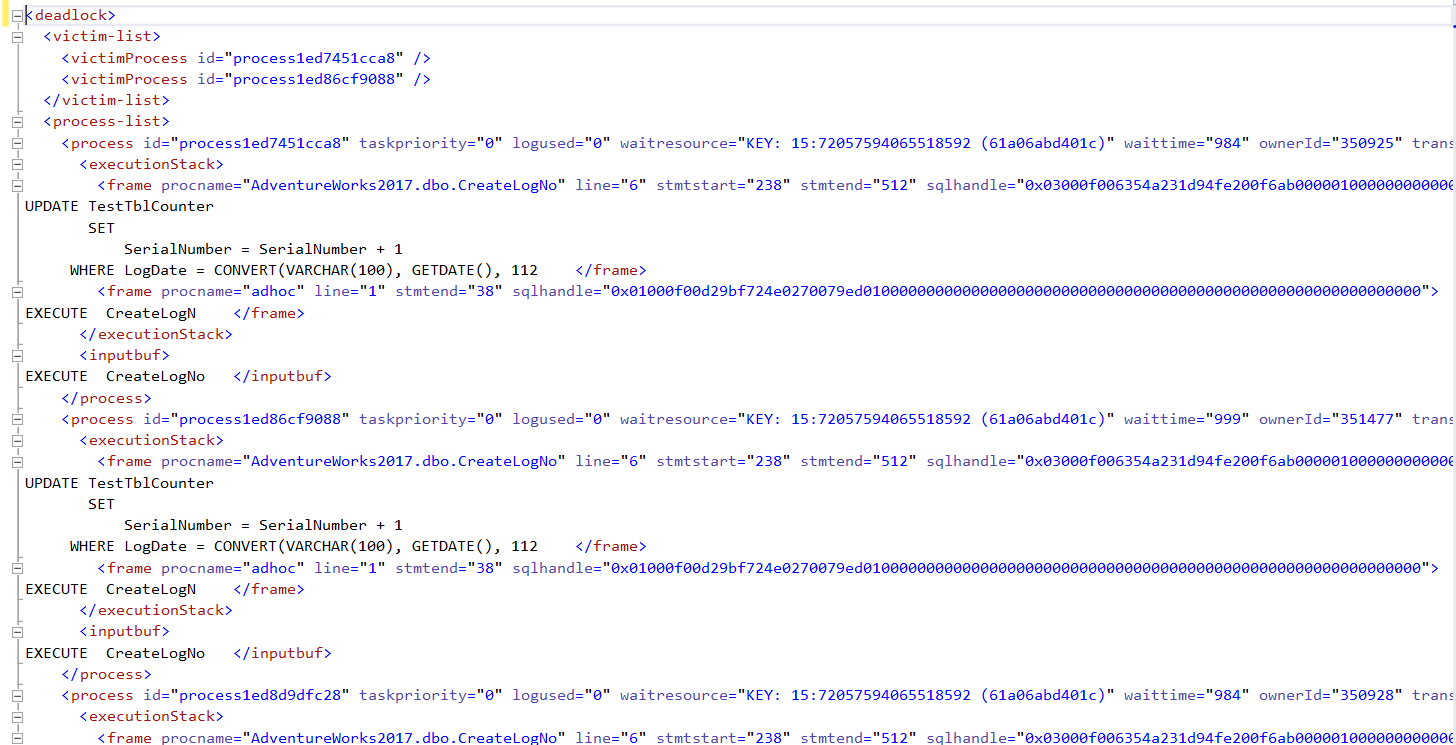
The xml_deadllock_report event includes more details about the deadlock, and we can also find the deadlock graph.
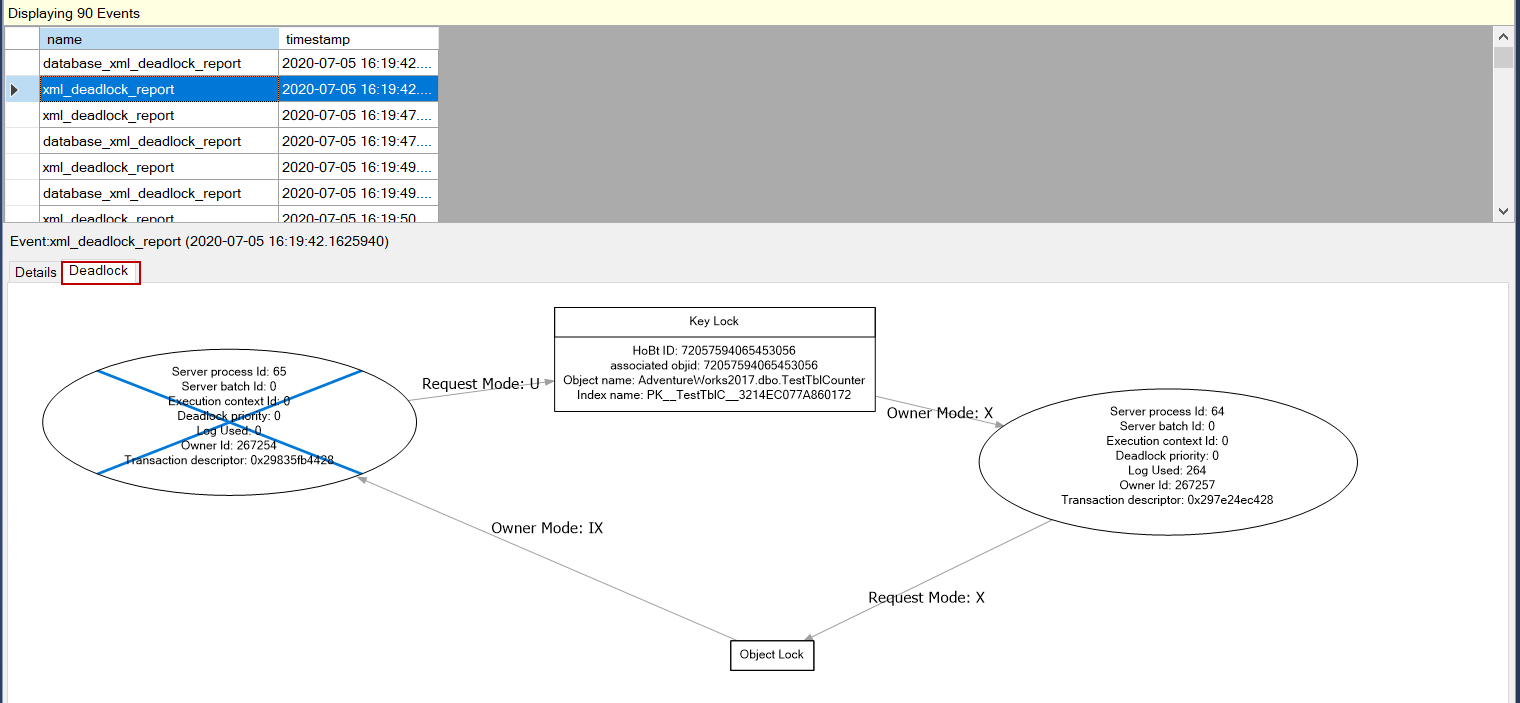
When we interpret the deadlock graph, the SPID 65 (victim) has acquired an intent exclusive lock and wants to place an update lock to the TestTblCounter table. The SPID 64 has acquired an exclusive lock to the TestTblCounter and wants to place an exclusive lock to the same table because of the TABLOCKX hint.
TABLOCKX hint helps to place an exclusive lock to the table until the select statement will be completed or the transaction will be completed. The disadvantage of the TABLOCKX hint is to reducing the concurrency, so it increases the locking time. When we decided to use it, we need to take account of the lock and contention problems. Particularly for this scenario, this hint usage logic is improper. When we reconsider the query, the update statement modifies some rows, and then the select statement fetches the same modified rows, but it placed an exclusive lock to the whole table until it completed because of the TABLOCKX hint. The most pointless part of this query is the line at which the value is assigned to the variable because the data assignment to the variable is performed randomly.
Why do we need to place an exclusive lock to all rows of the table if we want to obtain the last updated or inserted row? As a result, we can remove the TABLOCKX hint, which causes deadlocks in the query. At the same time, when we get the last inserted or updated row value, we can use the OUTPUT clause.
|
1 2 3 4 5 6 7 8 9 10 11 12 13 14 15 16 17 18 19 20 21 22 23 24 25 26 27 28 29 30 31 32 |
ALTER PROCEDURE [dbo].[CreateLogNo] AS DECLARE @LogNo AS VARCHAR(50), @LogCounter AS INT= 0; DECLARE @UptTable AS TABLE(SerNumber VARCHAR(50)); BEGIN TRAN; IF NOT EXISTS(SELECT ID FROM TestTblCounter WHERE LogDate = CONVERT(VARCHAR(100), GETDATE(), 112)) BEGIN INSERT INTO TestTblCounter OUTPUT INSERTED.SerialNumber INTO @UptTable VALUES (1, CONVERT(VARCHAR(100), GETDATE(), 112) ); END; ELSE BEGIN UPDATE TestTblCounter SET SerialNumber = SerialNumber + 1 OUTPUT INSERTED.SerialNumber INTO @UptTable WHERE LogDate = CONVERT(VARCHAR(100), GETDATE(), 112); END SELECT @LogCounter = SerNumber FROM @UptTable ORDER BY SerNumber DESC SELECT @LogCounter AS LogNumber; COMMIT TRAN |
When we simulate a new workload with the help of the SQLQueryStress for the 200 concurrent users for the changed stored procedure, we will not face any deadlock issues.
Conclusion
In this article, we explained deadlocks in SQL Server and then analyze a true story that was experienced by a development team. The significant point to generate a solution is properly understanding and interpreting the deadlock report and graph. Otherwise, it will be very difficult to find the main cause of the problem.
Recap the solution steps:
- Check the system_health session for deadlocks
- Create an extended event session to capture the deadlocks
- Analyze the deadlock reports and graphs to figure out the problem
- If it is possible to make improvements or changing the queries involved in the deadlock

Most of his career has been focused on SQL Server Database Administration and Development. His current interests are in database administration and Business Intelligence. You can find him on LinkedIn.
View all posts by Esat Erkec
- SQL Performance Tuning tips for newbies - April 15, 2024
- SQL Unit Testing reference guide for beginners - August 11, 2023
- SQL Cheat Sheet for Newbies - February 21, 2023