
This article will show the SQL standard deviation function with several examples.
Mean, Range, Variance, and Standard deviation: A reminder
Before explaining how to use the SQL standard deviation function, we will briefly introduce the need for this value in this section. Assuming that we have two sets, each representing the monthly salaries of employees within a company:
- Company A: 550 $, 700 $, 750 $, 1000 $, 2000 $, 11000 $
- Company B: 1000 $, 1500 $, 2500 $, 3000 $, 3500 $, 4500 $
Mean
As we know, the most common way to represent the overall value of a population is by calculating the mean of the existing values. A mean is an arithmetic function that is calculated by dividing the sum of values by the number of values, as illustrated in the image below:
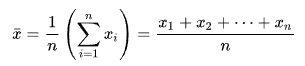
Figure 1 – Arithmetic mean formula (Source: Wikipedia)
If we apply this formula to both populations we provided, it will result in the following values:
- Company A: 2666.667 $
- Company B: 2666.667 $
While both companies have the same average monthly salary, it is clear from the employees’ salaries that this value is not representative of the whole population. The salaries in Company A are more dispersed than salaries in Company B. This will be more clear if those values are plotted as shown in the image below; Company B’s salaries are very close to the average values, while this is not true for Company A.
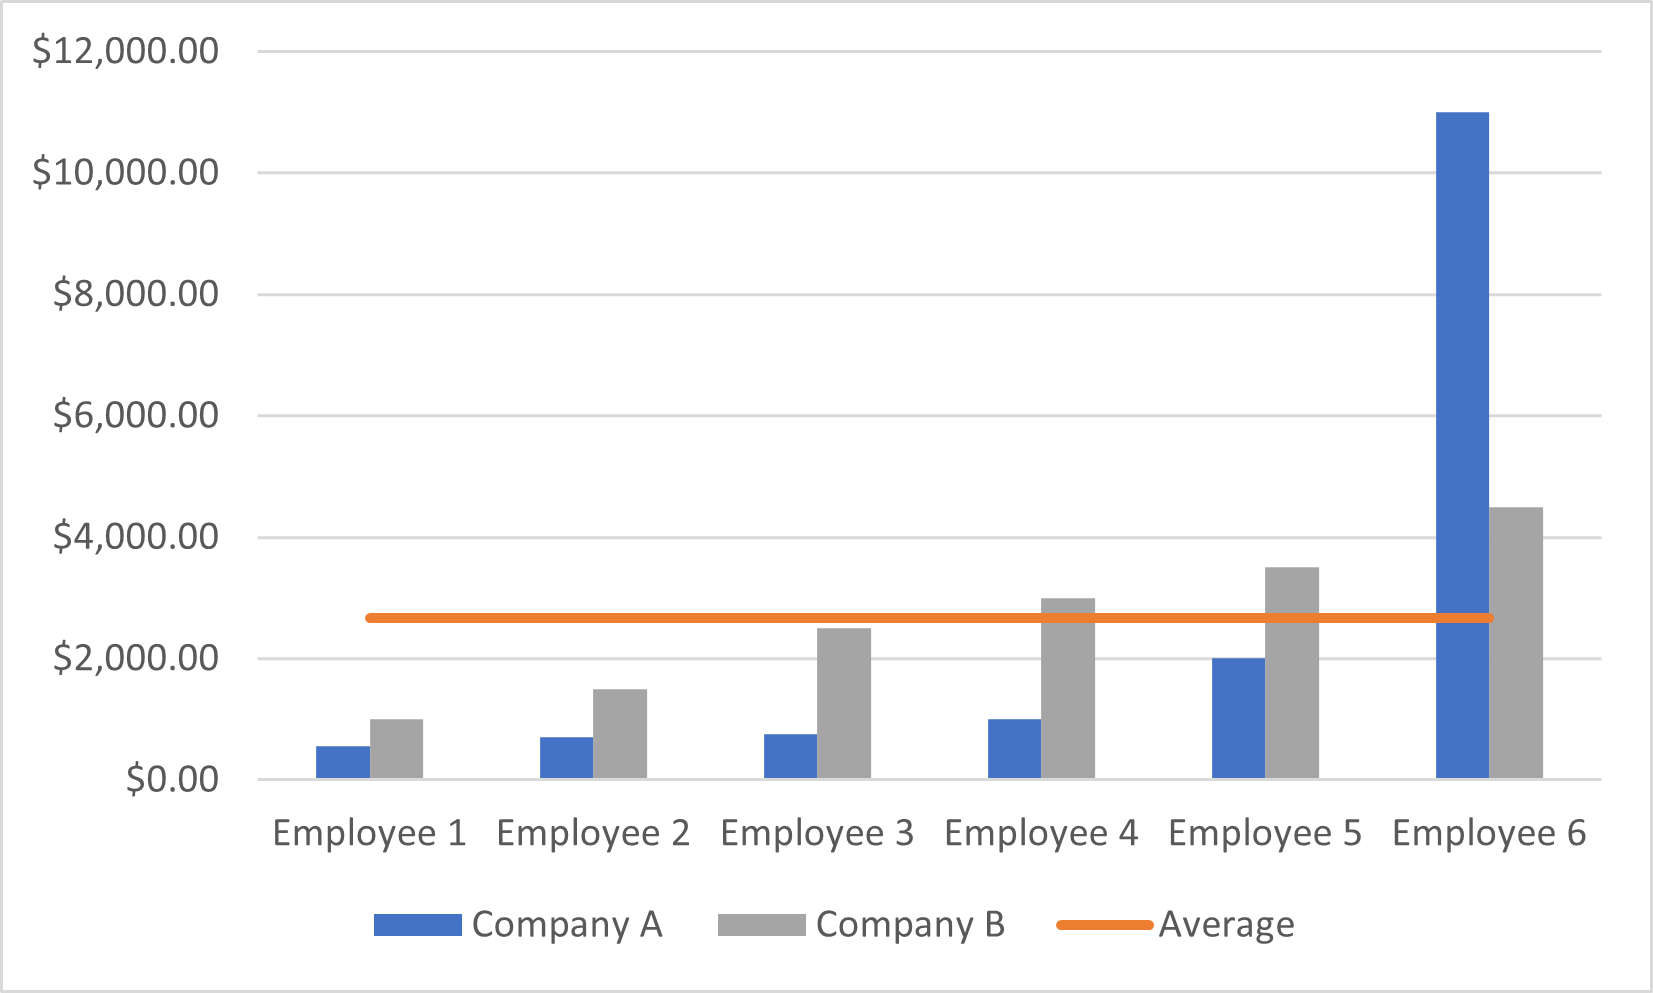
Figure 2 – Employees’ salaries distribution compared to the mean value
Range
One classic method to calculate the level of dispersion of the salaries is to subtract the maximum and minimum values, which is known as the “Range” (Figure 3).
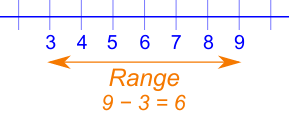
Figure 3 – Range value
If we apply this formula to both populations we provided, it will result in the following values:
- Company A: 10450 $
- Company B: 3500 $
We can note that the values above imply a considerable gap between the minimum and maximum salary in Company A, while this is not true in Company B. However, this value is still greatly affected by extreme values since it only uses them.
Hence, the need for a new value that calculates the deviation between each value in the population and the mean.
Variance
The variance can be described as a measure of variability. It tells you the degree of spread in your data set; compared to the mean, the variance increases as the spread of the data increases.
A deviation from two values is calculated by subtracting one value from the other. The variance is calculated by averaging the squared deviations for all values presented in a population from the mean, as shown in the image below.
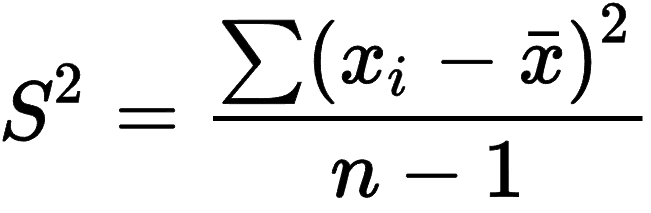
Figure 4 – Variance formula (Image Source)
If we apply this formula to both populations we provided, it will result in the following values:
- Company A: 14114722.22
- Company B: 1388888.889
The values presented above show that the salaries in Company A are more spread (compared to the mean) than in Company B.
Even if a variance value helps us know how much a mean value represents the overall population. Because the data is squared and not the same as the original data, its usefulness is limited. For instance, if we try to plot the salaries and the variance value on the same graph, the salary values are mostly unseen since the values of the Y-axis are way bigger than the data points’ values.
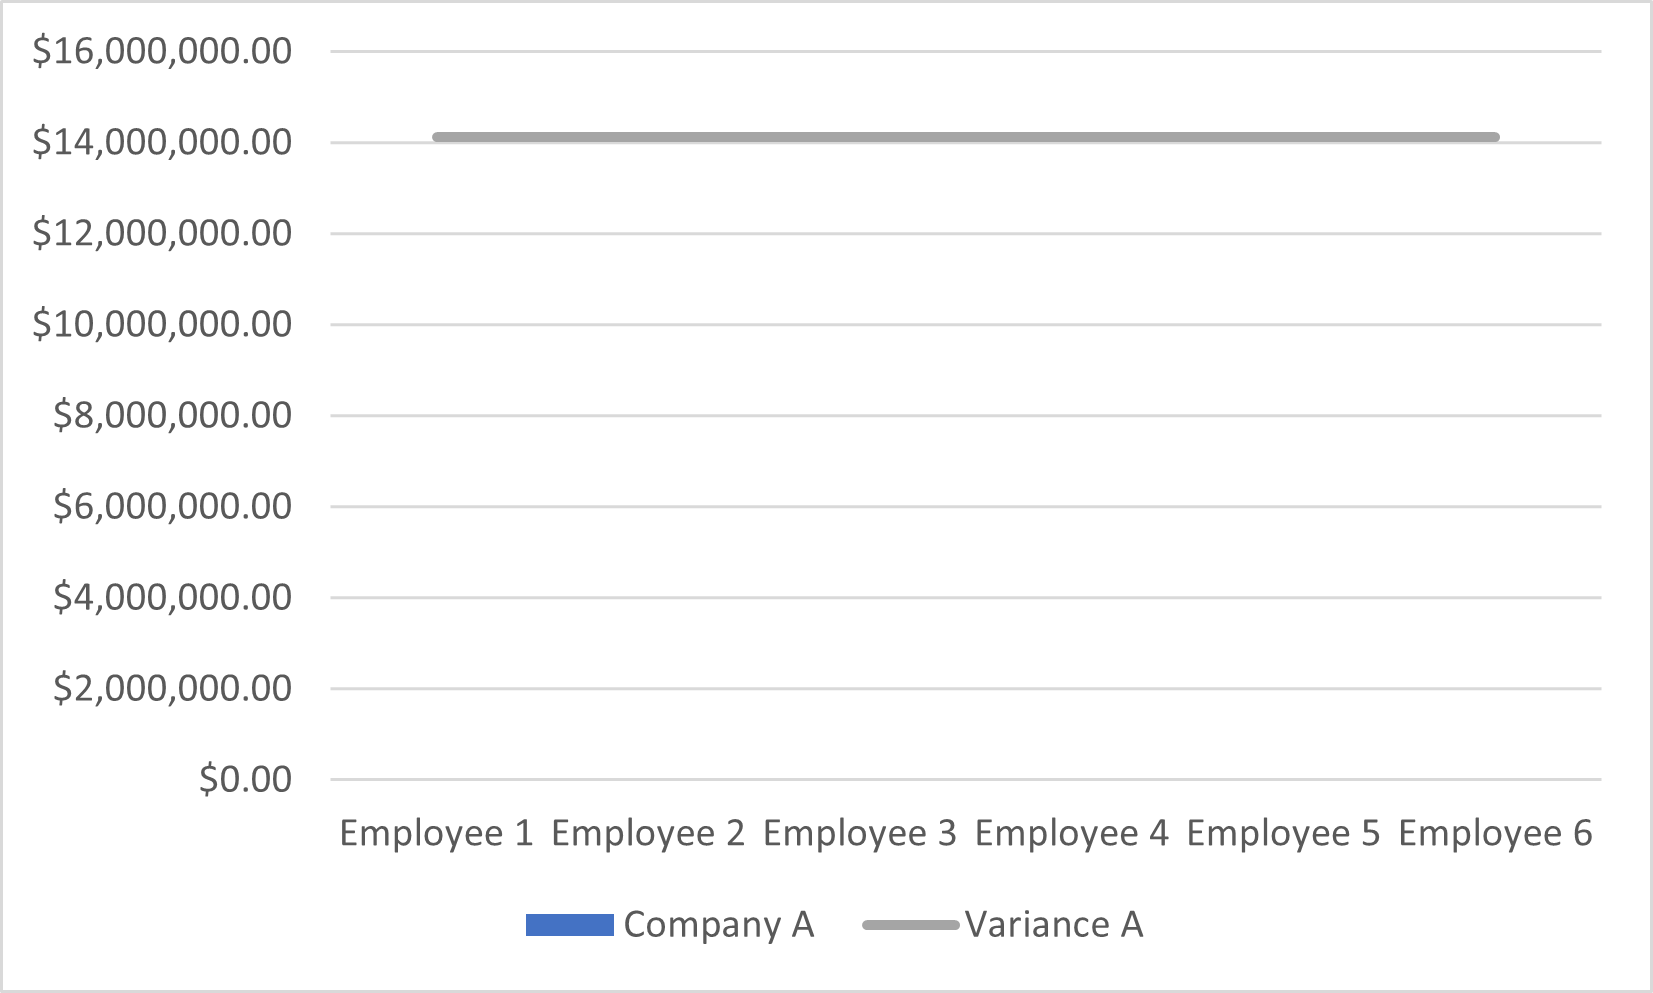
Figure 5 – Data points are not shown in the plot since the Y-axis unit is increased to fit the variance
Hence, the need for a new value that is more relevant to the values presented in a population.
Standard Deviation
As Wikipedia defines, “In statistics, the standard deviation is a measure of the amount of variation or dispersion of a set of values. A low standard deviation indicates that the values tend to be close to the mean (also called the expected value) of the set, while a high standard deviation indicates that the values are spread out over a wider range.”
Briefly, the standard deviation of a population is the square root of its variance, as shown in the image below.
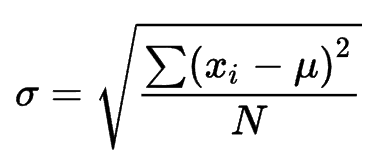
Figure 6 – Standard deviation formula (Image Source)
If we apply this formula to both populations we provided, it will result in the following values:
- Company A: 3756.956
- Company B: 1178.511
The standard deviation value has the same significance as the variance. In addition, it is more relevant to the values presented in a population, as shown in the image below.
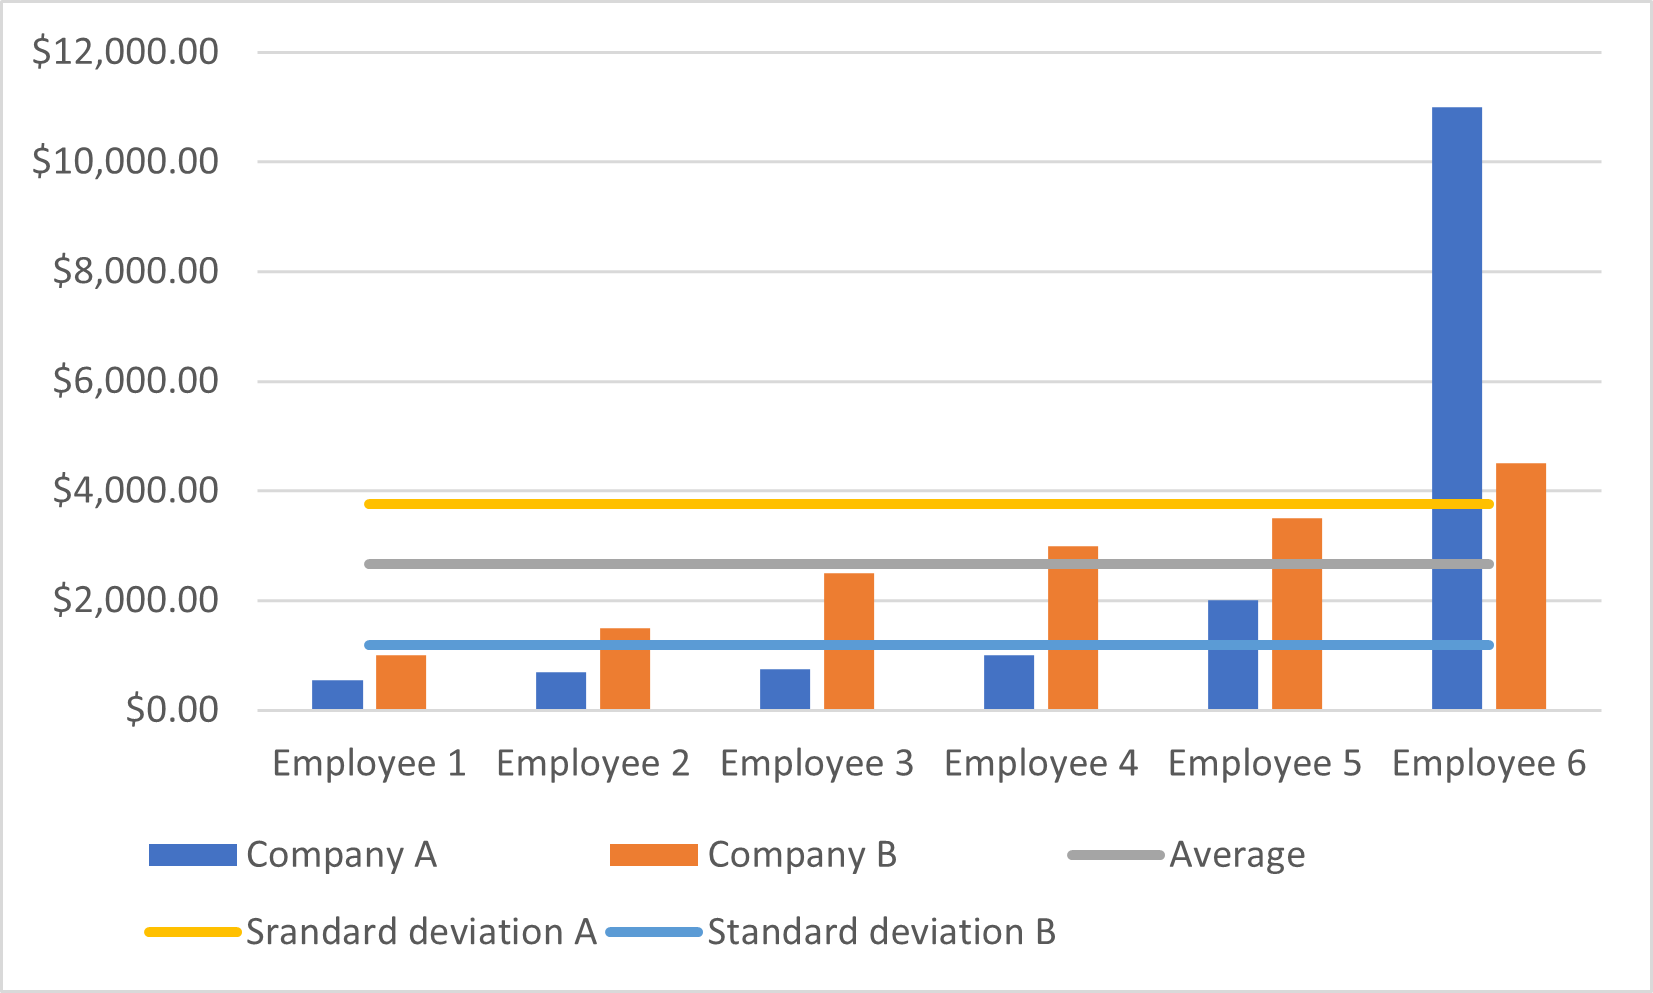
Figure 7 – Standard deviation values plotted with the original data values
In the next section, we will explain the SQL standard deviation function and how it could be used.
SQL standard deviation function
In this section, we will cover three ways to calculate standard deviation in SQL:
- Using the SQL standard deviation STDEV() built-in function (two approaches)
- Calculating standard deviation manually
SQL standard deviation built-in function
The most straightforward approach to calculating a standard deviation is using the STDEV() built-in function. This function takes a column name or expression as input and returns the statistical standard deviation of all specified values. STDEV() can be used with numeric columns only. Null values are ignored.
As defined in the official documentation, the STDEV() function has two syntaxes:
Aggregate function syntax
|
1 2 3 |
STDEV ( [ ALL | DISTINCT ] expression ) |
The first approach to use the built-in SQL standard deviation function is within a SELECT statement. If the DISTINCT keyword is specified before the input expression/column, duplicate values are ignored while calculating the standard deviation.
For example, let us calculate the standard deviation of the employees’ rates stored within the [HumanResources].[EmployeePayHistory] in the AdventureWorks2017 database.
As shown in the image below, adding the distinct keyword increased the returned value of the STDEV() function from 12.276 to 20.505. In other words, removing duplicates made the rate values more spread.
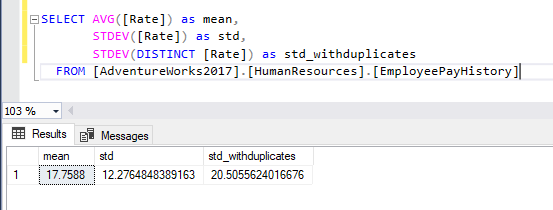
Figure 8 – Calculating standard deviation using STDEV() function
Analytic function syntax
|
1 2 3 |
STDEV ([ ALL ] expression) OVER ( [ partition_by_clause ] order_by_clause) |
The second approach to using the built-in SQL standard deviation function is adding the OVER clause.
Similar to other SQL windowing functions, the partition_by_clause (optional) divides the result set produced by the FROM clause into partitions to which the function is applied. If not specified, the function treats all rows of the query result set as a single group. The order_by_clause (required) determines the logical order in which the operation is performed.
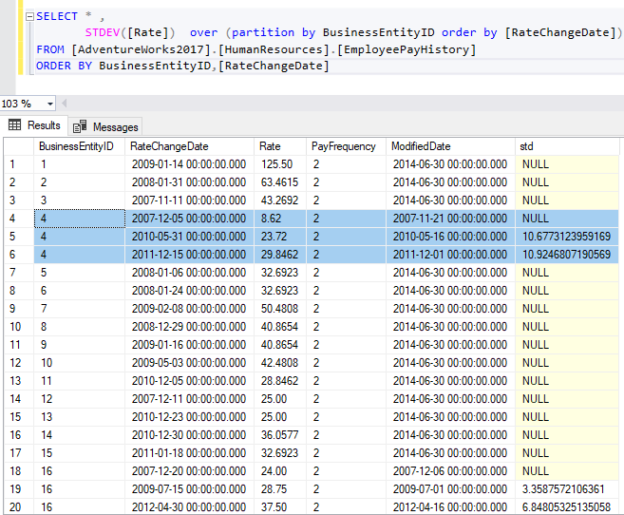
As shown in the image below, using the STDEV() as a windowing function allows calculating a cumulative standard deviation value based on the specified order criteria in the OVER clause.
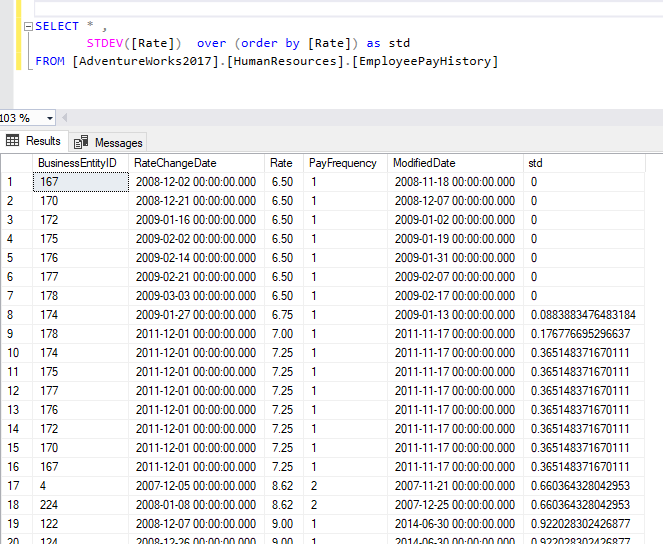
Figure 9 – Using the STDEV() function with the OVER clause
Now, let’s try to specify a partitioning expression in the OVER clause. As we can note in the image below, the standard deviation is calculated for each group. If only one value is present within a group, the SQL standard deviation function returns NULL.
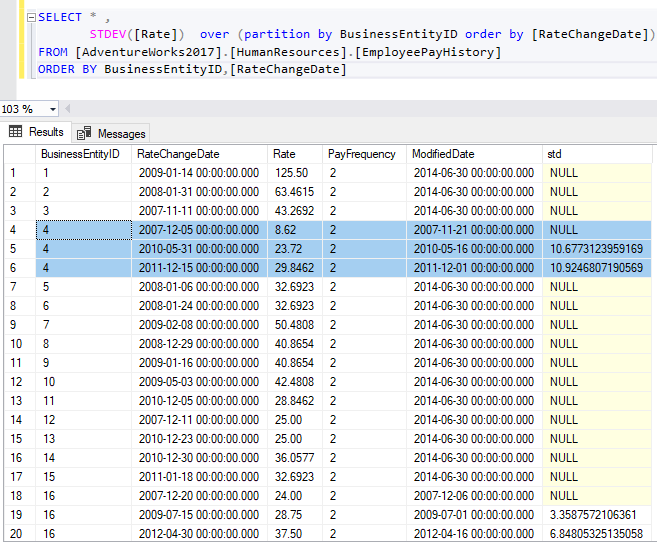
Figure 10 – Using STDEV() function over partitions
Calculating the SQL standard deviation manually
An alternative for using the SQL standard deviation built-in function is manually writing the standard deviation formula. This is not popular, but it may be required in some cases.
Since the standard deviation formula contains the values mean and count aggregate values, we should calculate those values and store them in SQL variables, or we can calculate them in a subquery.
Using SQL Variables
The following SQL Command can be used to calculate SQL standard deviation manually using variables:
|
1 2 3 4 5 6 7 8 9 10 11 12 |
DECLARE @mean as FLOAT DECLARE @count as INT SELECT @mean = AVG([Rate]), @count = COUNT([Rate]) FROM [AdventureWorks2017].[HumanResources].[EmployeePayHistory] SELECT STDEV([Rate]) as BuiltIn_std, Sqrt(Sum(Power(((cast([Rate] as float)- @mean)),2) / @count)) as Manual_std FROM [AdventureWorks2017].[HumanResources].[EmployeePayHistory] |
As shown in the image below, the values returned by the built-in and manual functions are very close.
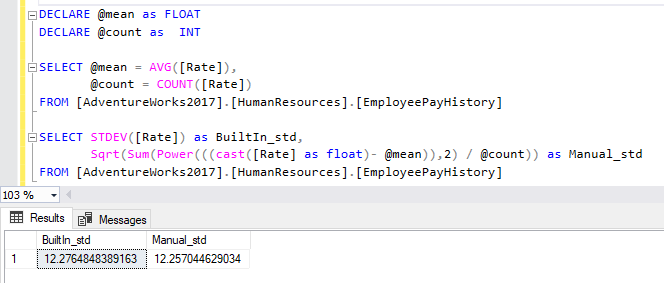
Figure 11 – Calculating standard deviation manually using SQL variables
Using a Subquery
The following SQL Command can be used to calculate SQL standard deviation manually using a subquery:
|
1 2 3 4 5 6 7 8 |
SELECT STDEV([Rate]) as BuiltIn_std, Sqrt(Sum(Power(((cast([Rate] as float)- agg.mean)),2) / agg.ct)) as Manual_std FROM [AdventureWorks2017].[HumanResources].[EmployeePayHistory], (SELECT AVG([Rate]) as mean, COUNT([Rate]) as ct FROM [AdventureWorks2017].[HumanResources].[EmployeePayHistory]) as agg |
Same as SQL variables, the manual approach returns a value very close to the one returned by the built-in SQL standard deviation function.
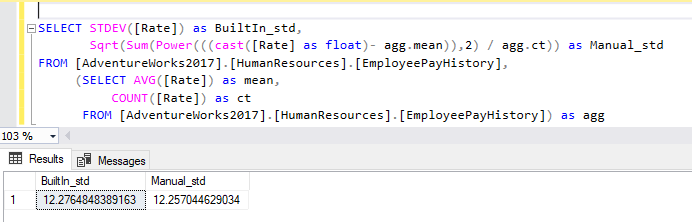
Figure 12 – Calculating standard deviation manually using a subquery
Summary
This article walked us through the standard deviation and the related statistical functions. Then, we explained how to calculate this measure using SQL. It is worth checking other SQL Shack articles talking about other aggregate functions in SQL:

Besides working with SQL Server, he worked with different data technologies such as NoSQL databases, Hadoop, Apache Spark. He is a MongoDB, Neo4j, and ArangoDB certified professional.
On the academic level, Hadi holds two master's degrees in computer science and business computing. Currently, he is a Ph.D. candidate in data science focusing on Big Data quality assessment techniques.
Hadi really enjoys learning new things everyday and sharing his knowledge. You can reach him on his personal website.
View all posts by Hadi Fadlallah
- An overview of SQL Server monitoring tools - December 12, 2023
- Different methods for monitoring MongoDB databases - June 14, 2023
- Learn SQL: Insert multiple rows commands - March 6, 2023