

In this article, we will learn how to perform Process Mining with Power BI.
Introduction
Data granularity can be categorized majorly into two categories – transactional data and analytical data. Transactional data is usually at the lowest level of granularity while analytical data is generally rolled-up or aggregated which brings it to a higher level of granularity. Aggregated or analytical data can be useful for dashboards, drill-down, or drill-through types of analysis for performing root cause analysis, monitoring key performance indicators and other similar purposes. For analytics like data mining, machine learning or artificial intelligence, generally, data is drawn from transactional repositories for sampling or drawing inference with mining. The challenge with these two factions of data comes when one wants to employ data mining and dashboarding in the same system, as generally the systems that process or consume different granularities of data are quite different. Enabling data consumers to perform data mining as well as dashboarding can be a very challenging task if two different types of systems are employed to enable each type of data processing. A modern trend in data engineering is to enable end-users to perform various data processing related tasks using data frameworks like R and Python as well as a variety of native and 3rd party smart visualizations that embed the required functionality for data analysis and expose standard interfaces for the end-user to operate them.
One of the largest categories of data that is continuously generated as well as collected are logs. Logs come in a huge variety depending upon the source that is generating the logs. Operational logs like tickets or incident-related logs form a large component of data logs. A specific branch of data science that is dedicated to analyzing the operational logs and generating operational intelligence out of this data is called process mining. Organizations employ sophisticated systems to build process mining systems at scale. To perform initial process mining exploration in a self-service manner for an end-user, reporting tools can be one of the best avenues as a starting point. Power BI Desktop can be used to perform process mining as a starting point and depending upon the complexity and depth of the process mining requirements, one can choose to continue with Power BI or employ additional systems
Process Mining
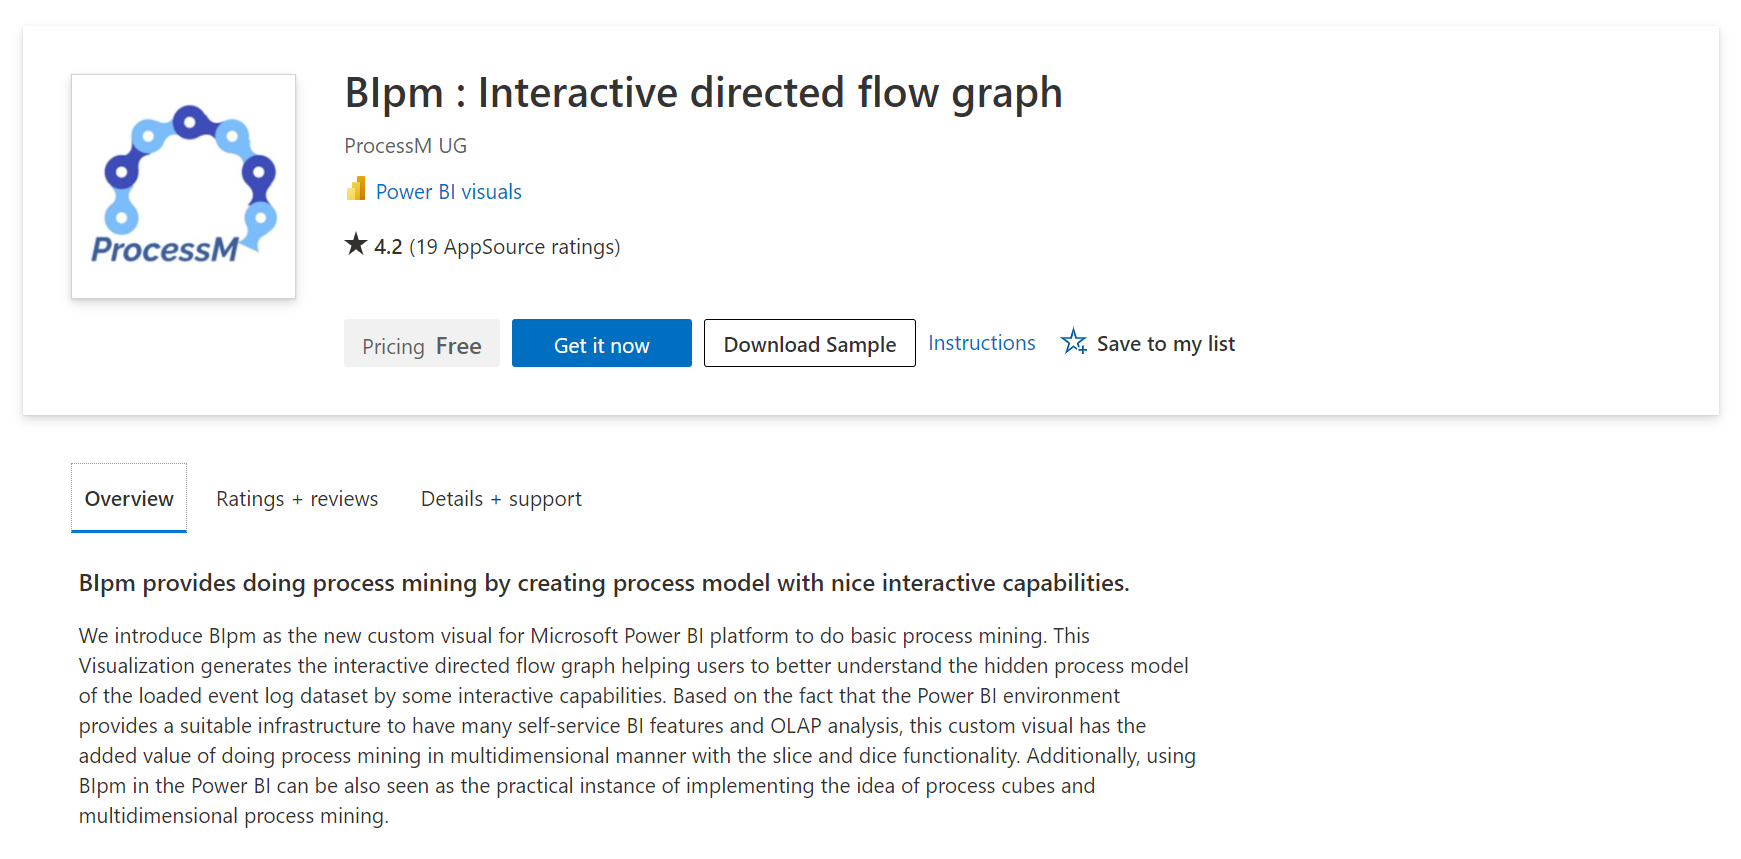
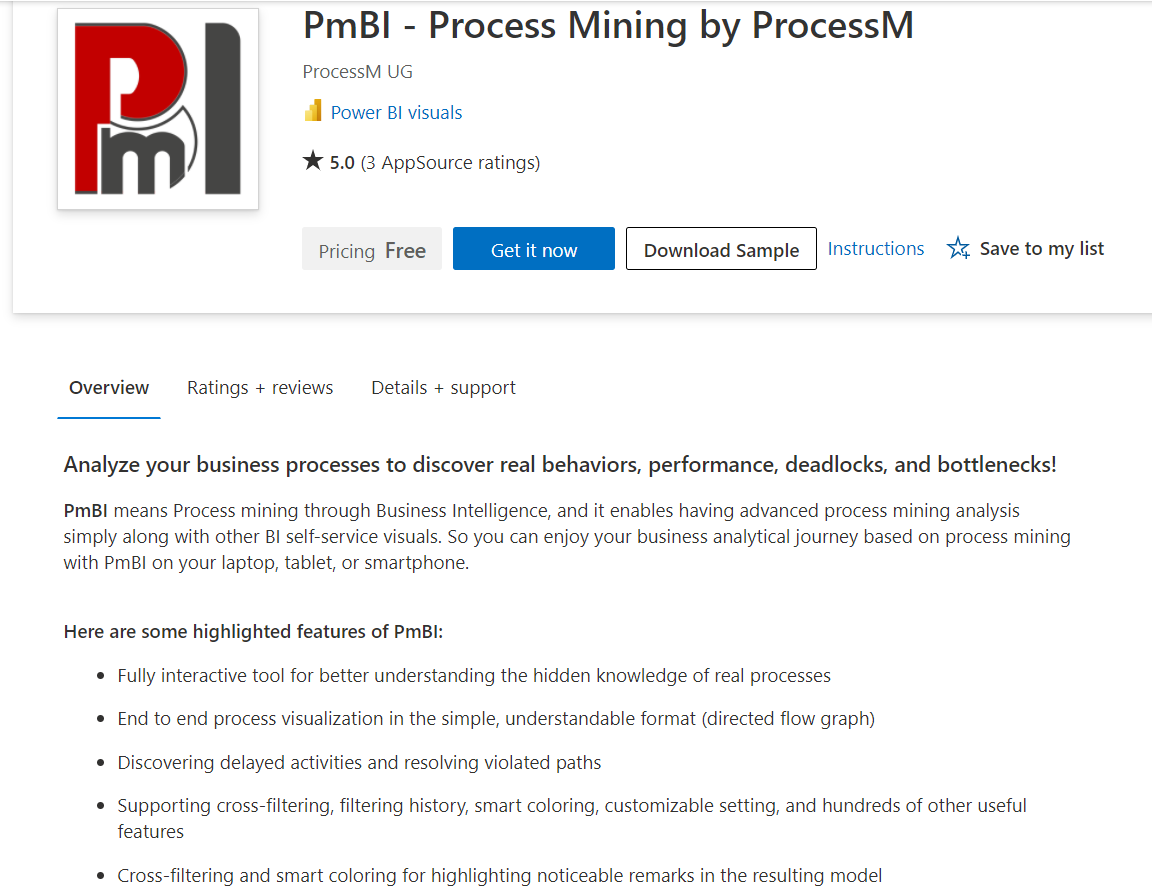
As we are going to be using Power BI for process mining, it is assumed that one has already installed Power BI Desktop on his/her own machine. Power BI provides out-of-box native visualizations as well as supports the import of third-party visualizations. While one way of performing process visualization is by analyzing and preparing data outside of Power BI and using it just to report pre-processed data, another way of performing process mining is by using intelligent visualizations in Power BI itself that can perform the required data analysis for process mining to some degree. In this article, we will be using the second approach where we will use a third-party visualization that is available for free from the Power BI visuals gallery. The name of this visualization provider is ProcessM and the visualization names are Blpm and PmBI both of which stand for Process Mining Business Intelligence. There are probably many other vendors and such visualizations out there that can be used for process mining, we will be using this specific visualization for the sake of discussion to understand practically what process mining would look like for those who are new to process mining. One can navigate to the Blpm visualization from here. The first step towards using this visualization is downloading the visual control itself and optionally downloading the sample file that comes along with it. As mentioned in the description of the visual, this visualization internally creates a structure that may resemble a typical Online Analytical Processing (OLAP) cube, and then using this data it presents the intelligence that is mined out of the data in the form of a force director flow graph.
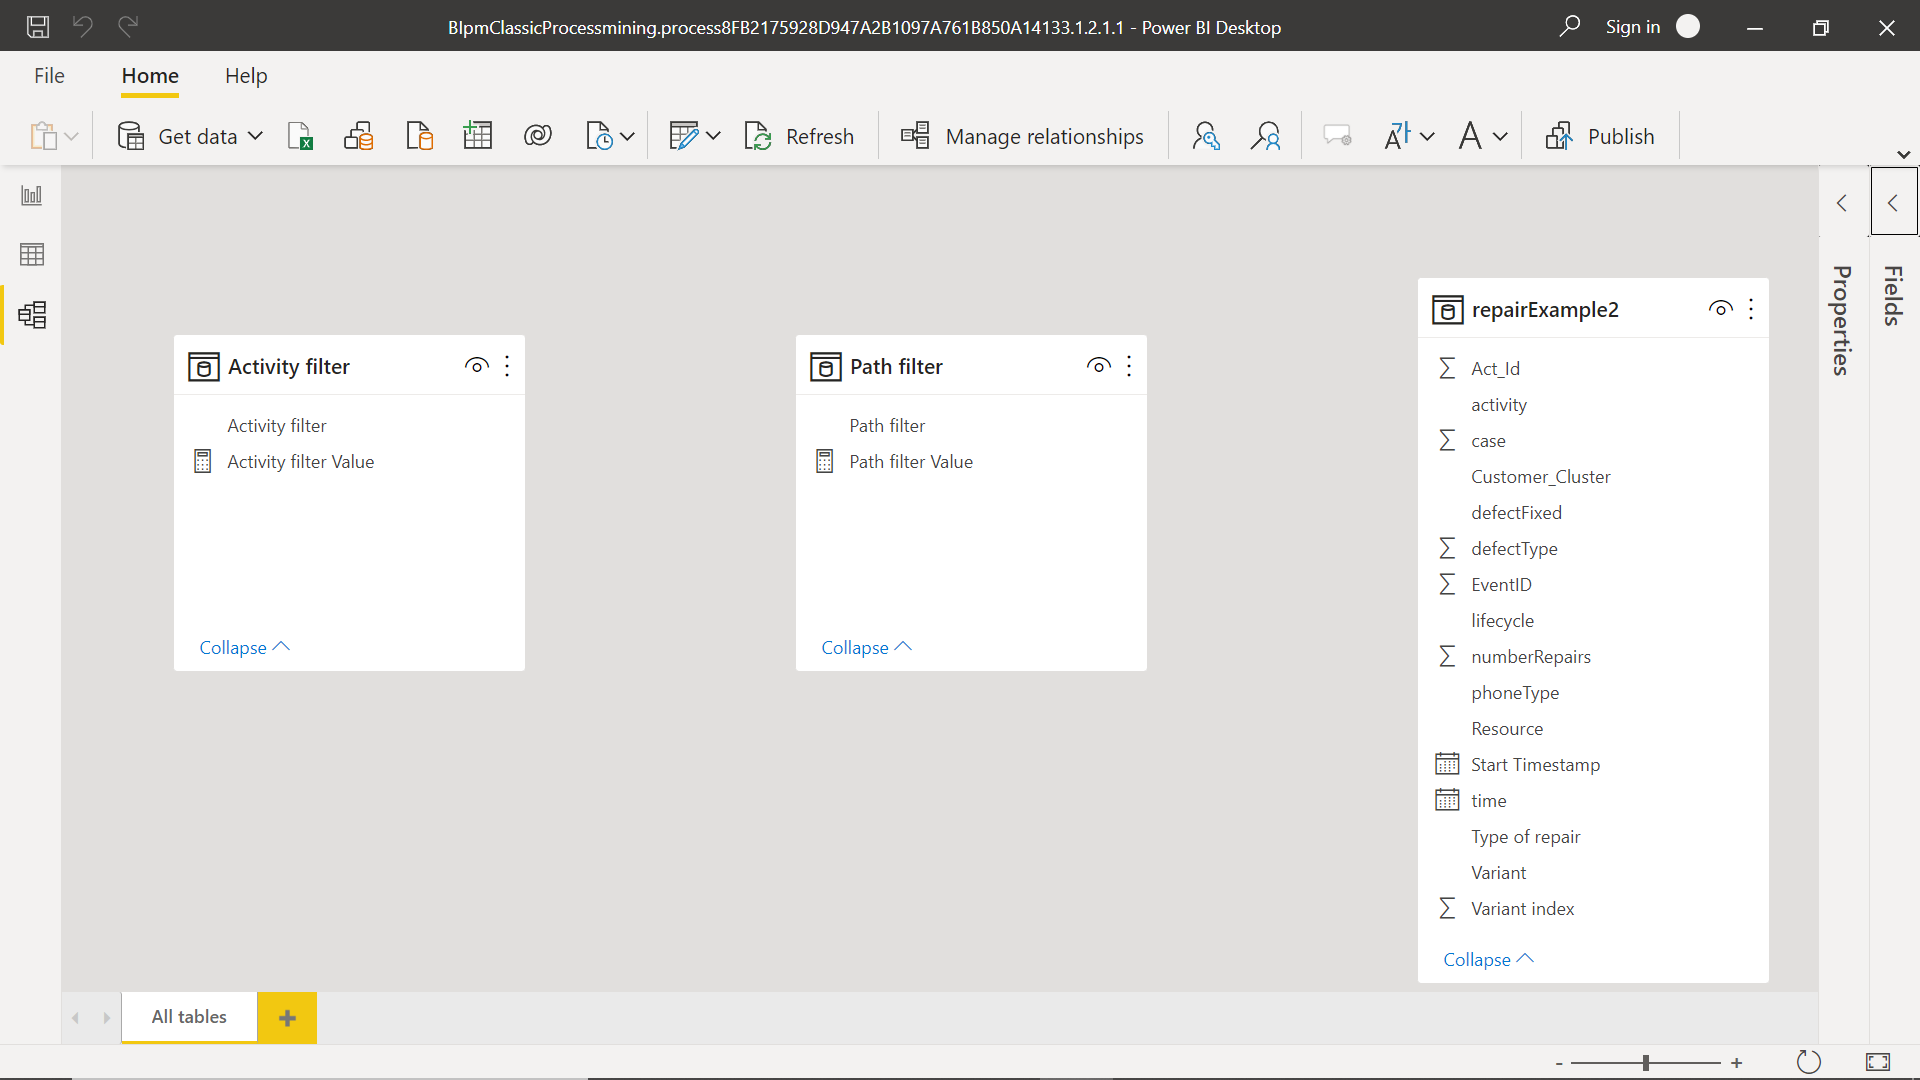
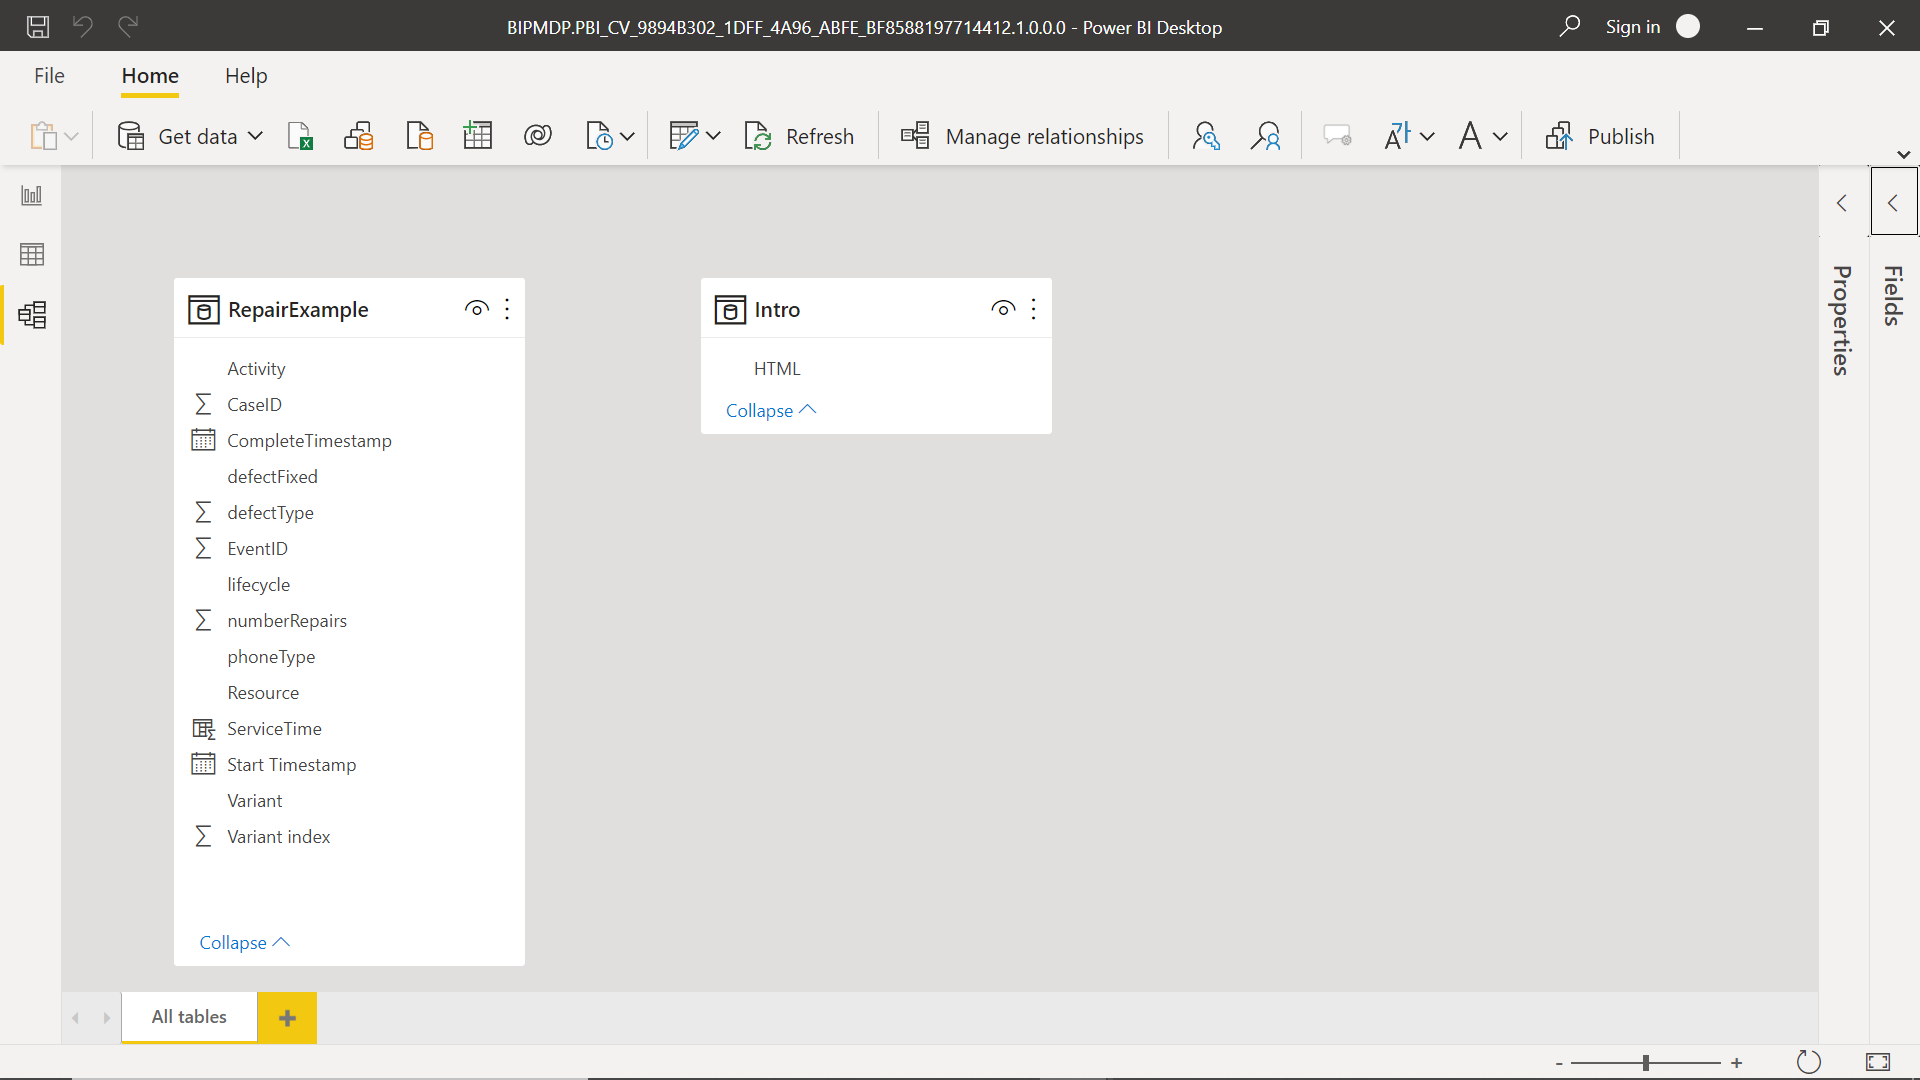
Open the sample report file that we downloaded from the product page of this visualization. Navigate to the model view of the report and it would look as shown below. The two smaller tables are just for filters, the core table is the Repair Example table. The field in this table gives us a clue about the typical fields that may go into mining process structure out of the ticket data that this table holds.
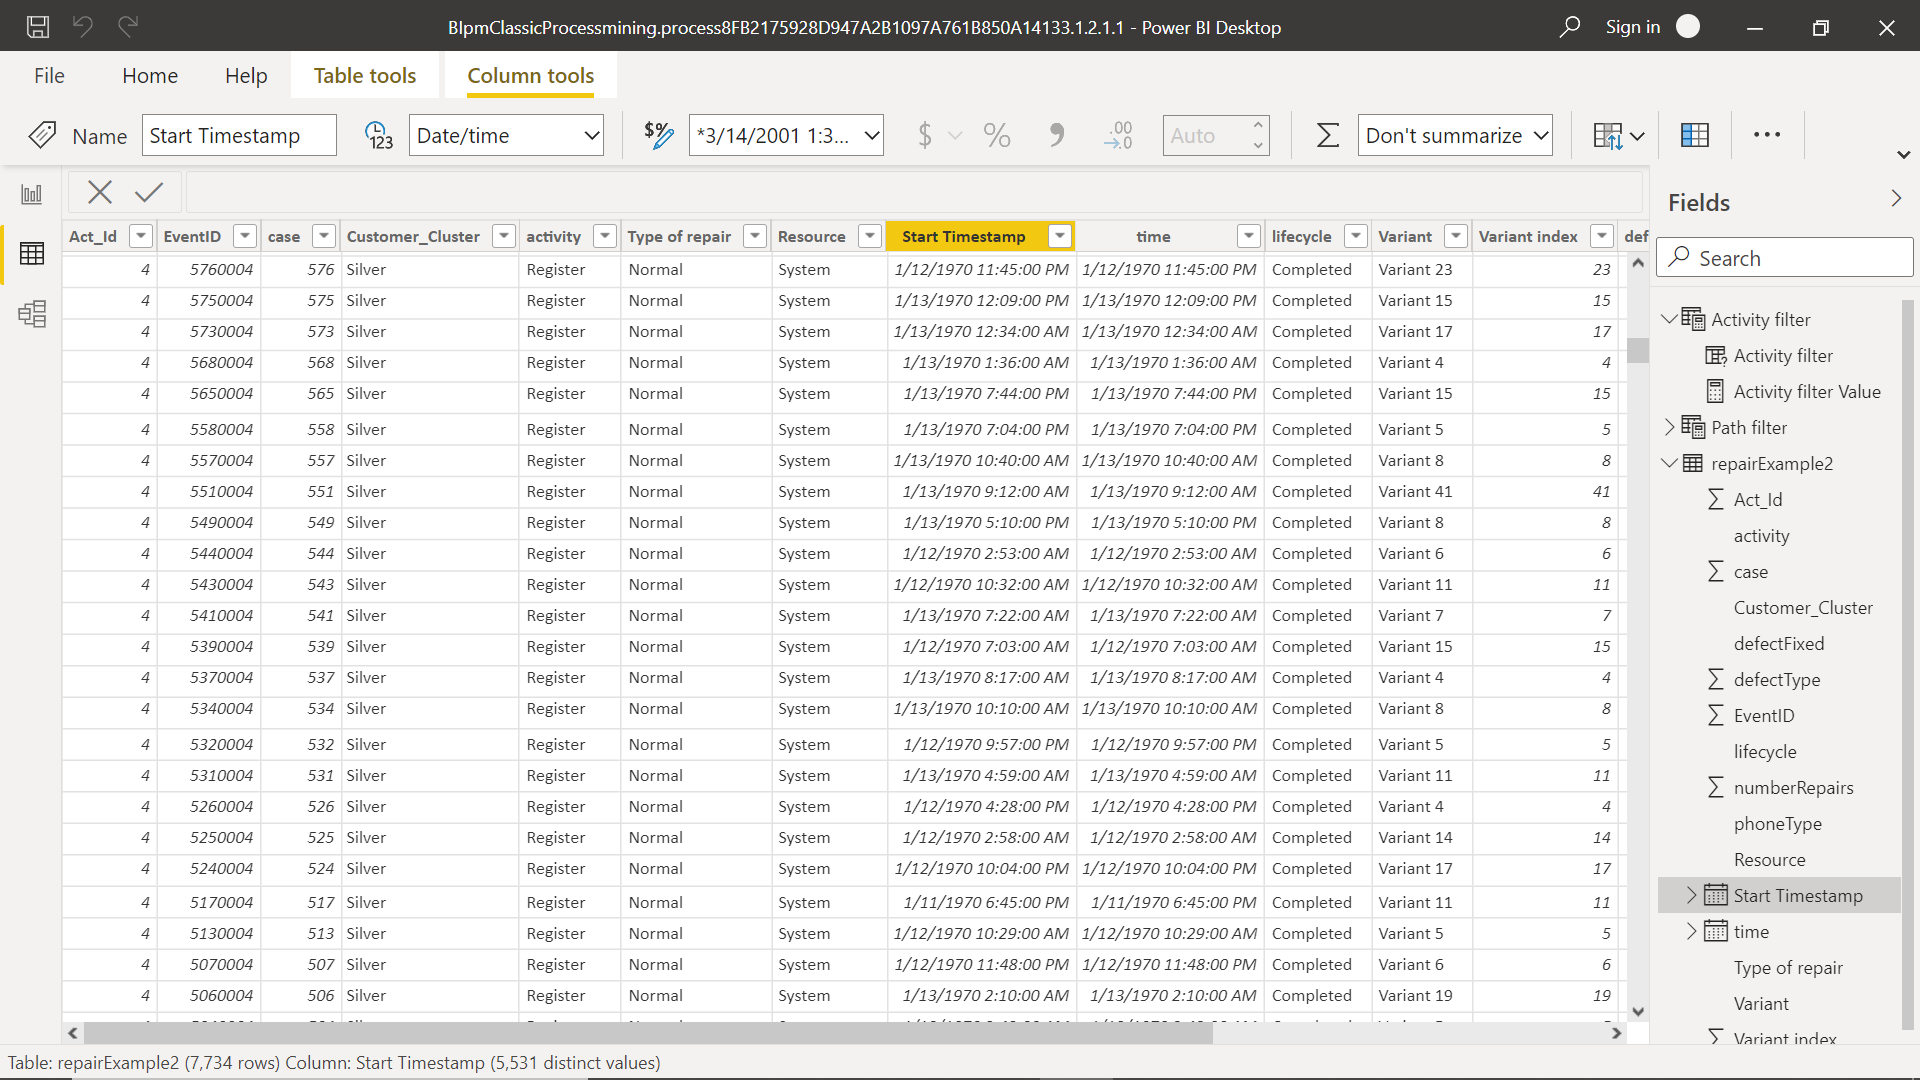
Switch to the data view and it would show the actual data of this table. Glance and scroll through the records of this table and we would be able to find that this table has a lot of events i.e., tickets related data. The customers who raised the tickets are categorized by the field titled Customer_Cluster. The lifecycle field captures the stage of the incident.
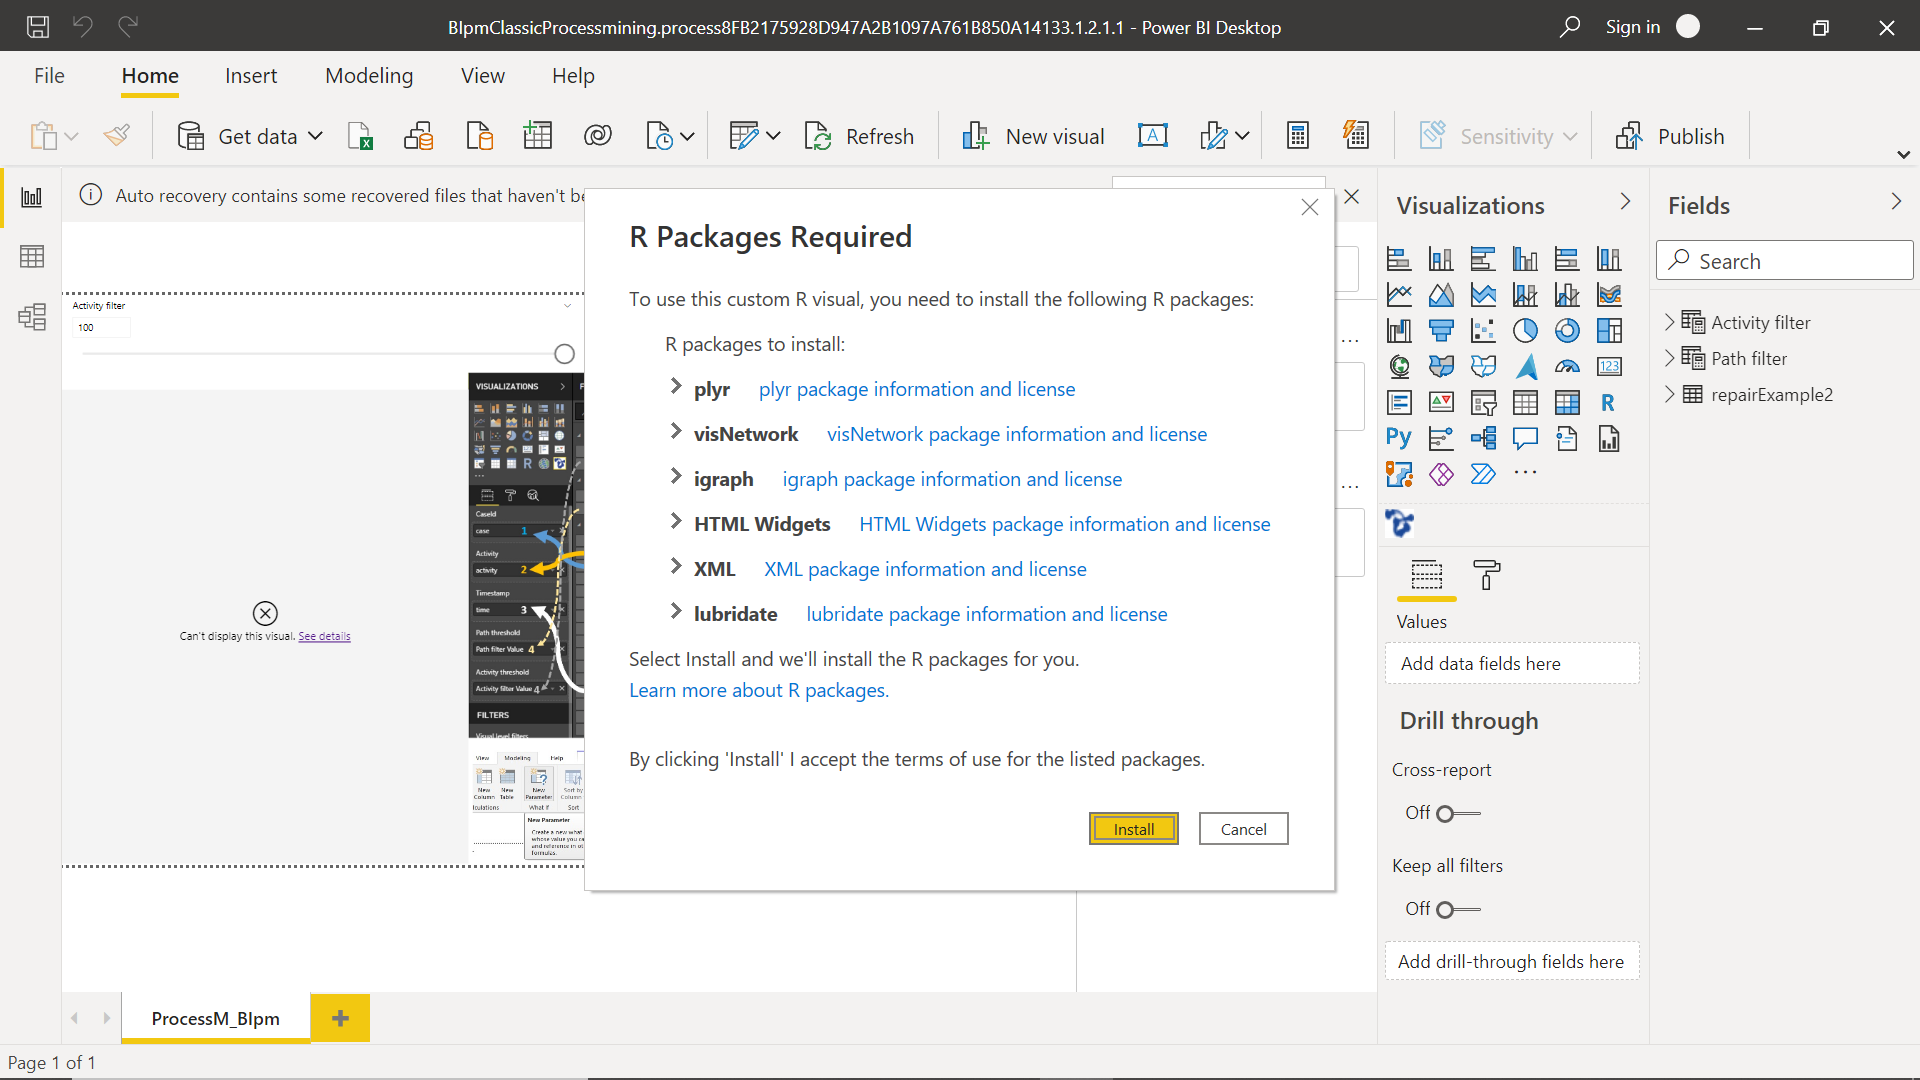
While the organization has a stipulated process in place, but in a multi-party environment, where one would want to analyze or understand the process being followed based on the operational data, one must perform process mining. To visualize the intelligence that this visualization has inferred, we can now navigate to the report view of this sample report. This visualization has a dependency on R being installed on the system and accessible to Power BI. Assuming R is already installed, when we open the report view, it would prompt us to install a certain R package and enable scripts for this report. Review the pre-requisites of the visualization and click on the Install button to allow the installation of packages.
Once the packages are installed, we would be able to view the force-directed graph of the process created from the operational data that we saw earlier. Each entity shown on the graph shows the stage of a process along with the number of incidents found at that stage of the process. The association of one entity with another along with the weight of association shown in the weight of arrows that connects two entities is the actual inference that this visualization made easier for us, which would have been time-consuming if done manually. To understand how this visualization inferred the entities and paths that connect them, consider looking at the fields being used to render this visualization and it would provide more insight into the factors that drive the rending of this process visual.

At a basic level for a very high-level exploration purpose, this visual can be considered as a good starting point for process mining. In actual real-world scenarios, one may need more sophisticated capabilities where the visual would derive more intelligence and explain the factors that lead to the process graph or flow extracted from the operational data. The same vendor offers another visualization for process mining known as PmBI as shown below. From the description of this visual, we can easily make out that this is a more feature rich visual than the previous one.
If we explore the data used for this visual in the sample Power BI report file that ships with this visualization, we will find that it used the same data that we used in the previous visualization as shown below.
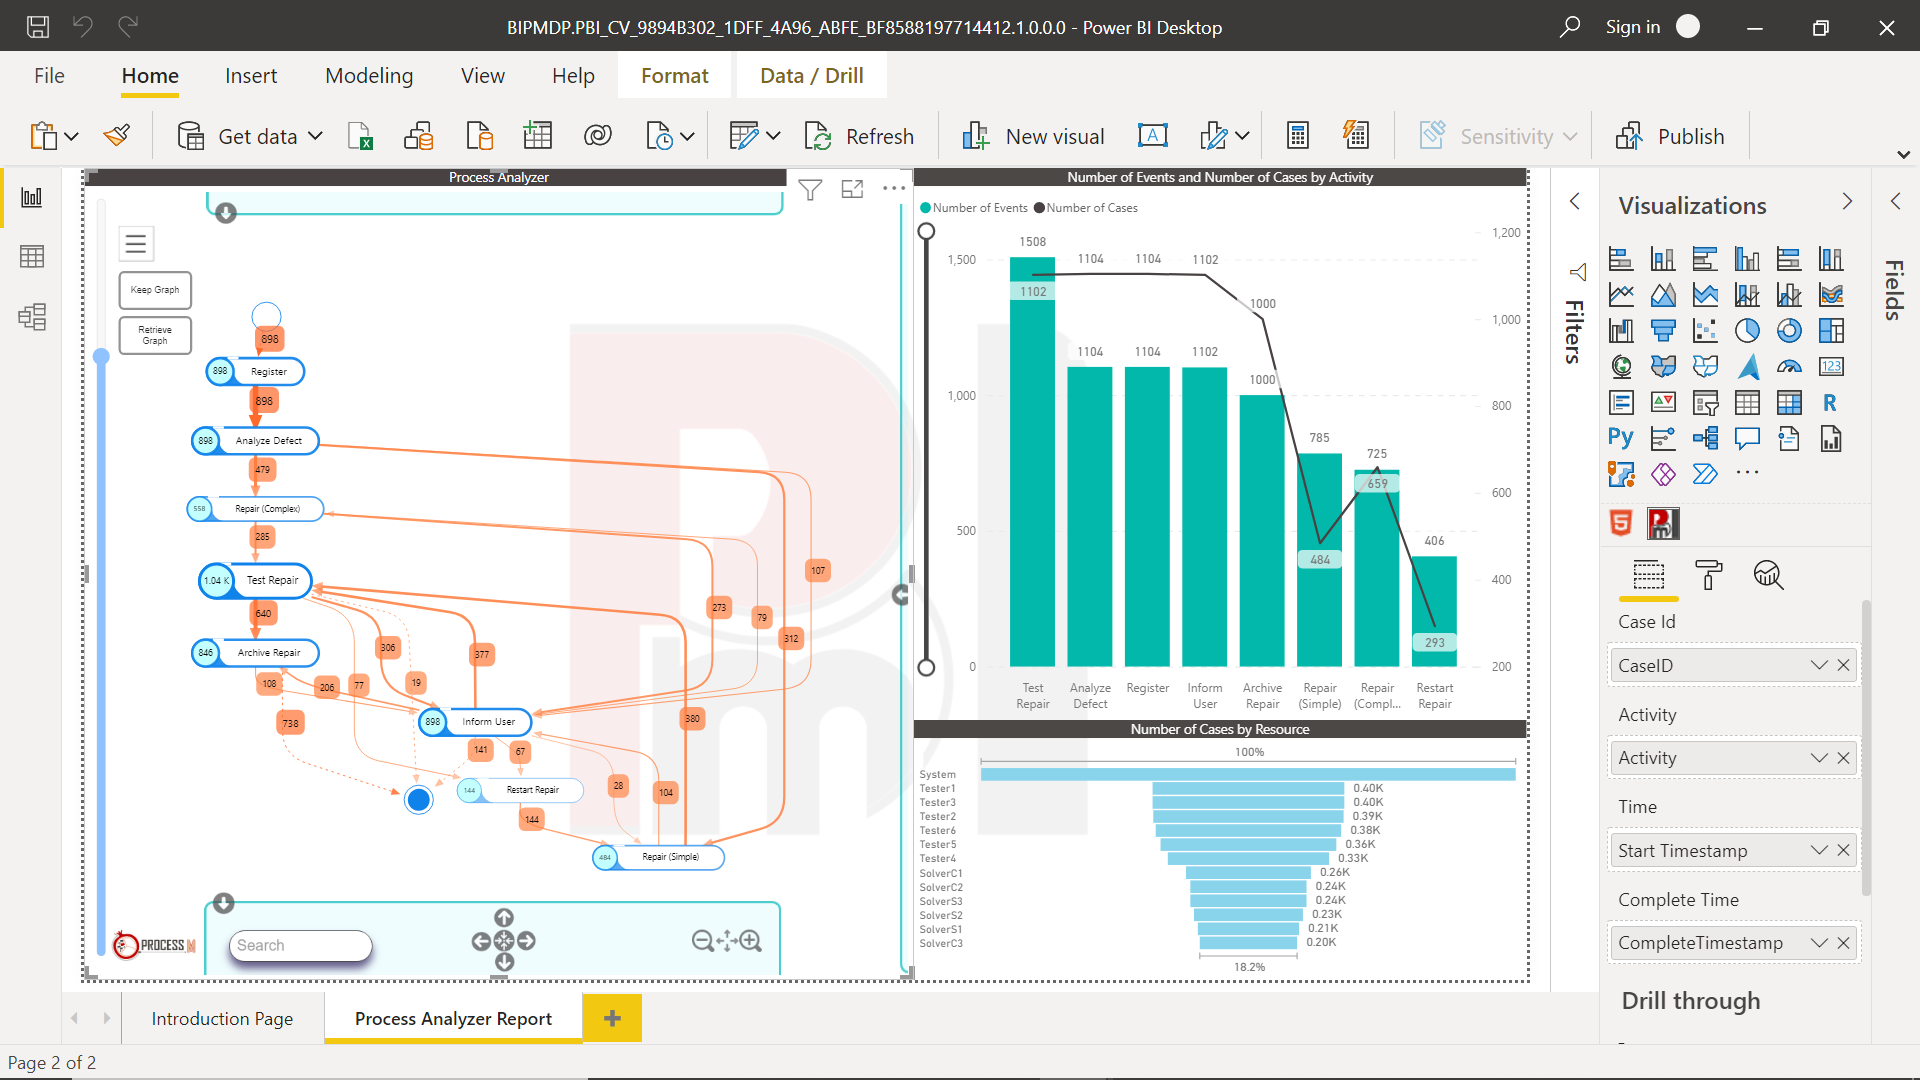
Here we can see the dashboard created by using this visualization, a bar chart and a funnel chart as shown below. Here the data is shown in a more organized manner and the visualization offers many features for customization.
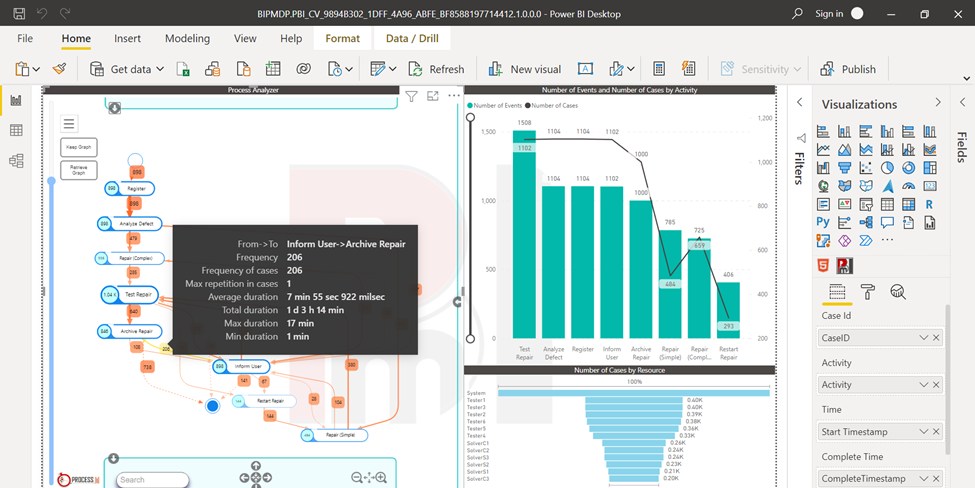
If we hover the mouse pointer over any of the edges that connect the different steps of the process, we would be able to see the information in greater detail as shown below.
Consider exploring this visualization’s features by clicking on the menu option on this visual as well as the formatting options of this visual to exploit the full potential of the capabilities offered by this visualization for process mining.
Conclusion
In this article, we learned some of the basics of process mining and the use-cases where process mining can be used in Power BI. We learned about one of the visualizations in the process mining category and learned a simple way to learn about such visualizations by downloading the visual as well as the sample report file, analyzing the data and the output rendered by such visualizations.

She has a deep experience in designing data and analytics solutions and ensuring its stability, reliability, and performance. She is also certified in SQL Server and have passed certifications like 70-463: Implementing Data Warehouses with Microsoft SQL Server.
View all posts by Gauri Mahajan
- Oracle Substring function overview with examples - June 19, 2024
- Introduction to the SQL Standard Deviation function - April 21, 2023
- A quick overview of MySQL foreign key with examples - February 7, 2023