

We’re facing a challenge with several of our data flows that use more time than they have in the past and we’re not sure when this trend started. We know in the past month, our reports have been delayed by over a day from the start to the finish. For some of our data flows we use SQL Server Agent that calls SSIS packages or procedures, while some of them use a custom data import and reporting application we’ve created. How can we track the length of time for these data flows, since we’re using a combination of tools for importing data?
The Challenge
Since we have a multi-step process, we want to identify which of these steps may be the issue of delay. In this tip, we’ll assume that this “process” is an ETL flow with 3 steps – importing data, validating the data, and comparing the data to a base set. We could apply the same logic if we’re dealing with another process that has a different arrangement in its flow, such as validating first, importing the data, then comparing the data. While the steps may differ, how we determine what is causing delay and where can optimize (or change) will not change.
Measure the Speed
We’ll use an example of an ETL flow that uses a SQL Server Job with three steps:
- An import step, where data are imported into a staging table
- A cleaning step, where the data are cleaned before entering into a destination table
- A verification step, which for the SQL Server Job Agent comes last
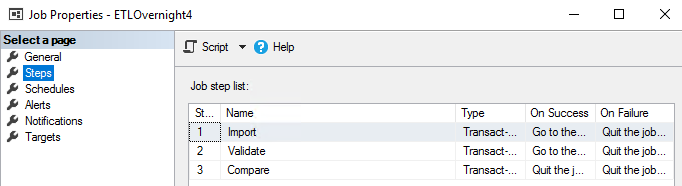
We see the three steps in the example SQL Server Job which imports, cleans and verifies data.
We can query the msdb database to get the time information about the steps in the job, which will help us determine where we can work on improving performance. In the below query, we query three system tables from the msdb database – sysjobs, sysjobsteps and sysjobhistory. To get the date and time information formatted using a year, month, day and time format, we’ll use the system scalar value function dbo.agent_datetime – a function which Microsoft does not provide information on, but which we can see accepts two parameters – a date and time (the below image shows this).
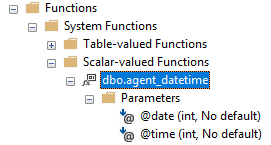
The system scalar value function dbo.agent_datetime in the msdb database.
|
1 2 3 4 5 6 7 8 9 10 11 12 13 |
USE [msdb] GO SELECT t2.step_name CompareStepName , t3.run_date CompareRunDate , t3.run_duration CompareRunTotalTime , dbo.agent_datetime(t3.run_date,t3.run_time) FROM dbo.sysjobs t INNER JOIN dbo.sysjobsteps t2 ON t.job_id = t2.job_id INNER JOIN dbo.sysjobhistory t3 ON t2.job_id = t3.job_id AND t2.step_id = t3.step_id WHERE t.[name] = 'ETLOvernight4' |
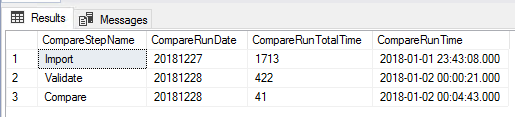
Example result from our query showing the run times of each job step of ETLOvernight4.
Our output shows the run time of each step with the total duration (according to Microsoft, run_duration reports in the HHMMSS format). In some cases, msdb is treated like most system databases – restricted. Rather than query msdb for time information, we’ll create our own tracking table and insert times when our ETL steps pass. Either msdb or our own tracking table will function for getting time information, however, the latter will be more useful if we enter an environment where we’re not allowed to access higher level databases.
In the below code, we create our table along with the steps for this ETL job – ETLOvernight4. We could create a fourth step that only inserts a start time for the job, but instead we’ll add the start time of the job to step 1 with a step of 0 and then at the end of every step with an incrementing value, add a finish time for the step. The below image shows this for the first step – the second and third step also match with the below ending times shown in the code:
|
1 2 3 4 5 6 7 8 9 10 11 12 13 14 15 16 17 18 19 20 21 22 23 24 25 |
CREATE TABLE etlJobTracking( JobName VARCHAR(100) NOT NULL, JobStepNumber TINYINT NOT NULL, JobTime DATETIME DEFAULT GETDATE(), JobNotes VARCHAR(25) NULL ) -- Step 1 - start: INSERT INTO etlJobTracking (JobName,JobStepNumber,JobNotes) VALUES ('ETLOvernight4',0,'Start') -- Step 1 - end: INSERT INTO etlJobTracking (JobName,JobStepNumber) VALUES ('ETLOvernight4',1) -- Step 2 - end: INSERT INTO etlJobTracking (JobName,JobStepNumber) VALUES ('ETLOvernight4',2) -- Step 3 - end: INSERT INTO etlJobTracking (JobName,JobStepNumber) VALUES ('ETLOvernight4',3) |
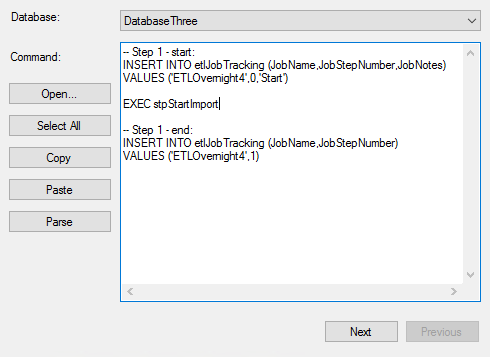
Example of us adding our code to step 1 – this step will have both the start of the job and end of the step, while other steps will have the end.
We can now query this table with the job name and the below result shows an example of what we’d see.
|
1 2 3 4 |
SELECT * FROM etlJobTracking WHERE JobName = 'ETLOverNight4' ORDER BY JobTime DESC |
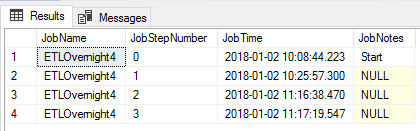
Output of query on the second run from the next day using timestamps at the end of each completed step.
Relative to the ETL or data flow tools we’re using, we can use the above within the tool – from a PowerShell Invoke-SqlCmd line to an Execute SQL Task in SSIS throughout our SSIS flow wherever the context is appropriate. The reason we look at the above method for measuring a flow’s time is because SQL Server Agent isn’t used in all environments.
One final development technique we may use is a timestamp on the changing tables throughout the data flow. If our first step involves a staging table during the import, our second step involves a final table for the validation and comparison, both of these tables would have a timestamp tracking on their schema, which is either created or updated as a step in our process finishes. In the below image, we see the result of a query from the final table that returns the date and time information of each step.
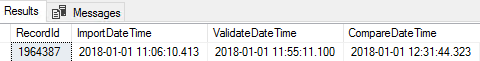
For the record id of 1964387, we see the import time, validation time and compare time.
From a storage perspective, the data type DATETIME use 8 bytes, which can add costs. However, we don’t have to keep these columns in our final presentation, so once the data have been recorded on these columns, we can save the aggregate and remove them (or in the presentation table structure, avoid keeping them). This technique is a popular approach to storing timestamp information in ETL processes because we can compare the time on the row level, if we need granular information. The downside is that it does add costs – though we can optimize this by saving a summary of the information.
Compare the Speed’s Growth (If Applicable)
After we have a measure of the speed of our process (in this case, an ETL job), we can identify the following:
- Which step uses the most time? Can this step be optimized without vertical or horizontal scale, such as data cleaning and query optimization?
- Is the time for each step execution growing along with the data size? If so, this predicts a future scaling problem. The below query shows us a comparison of average times based on the month for this job using the etlJobTracking table we created in the previous step – though we could apply similar logic to other time tracking techniques
|
1 2 3 4 5 6 7 8 9 10 11 12 13 14 15 16 17 18 19 20 21 22 23 24 |
DECLARE @jobname VARCHAR(100) = 'ETLOverNight4' ;WITH MeasureGrowth AS( SELECT ROW_NUMBER() OVER (ORDER BY JobName, JobTime ASC) OrderId , CAST(JobTime AS DATE) JobIdDate , * FROM etlJobTracking WHERE JobName = @jobname AND JobTime BETWEEN '2018-01-01' AND '2018-02-28' ), GroupAll AS( SELECT t2.JobStepNumber , t.JobIdDate , DATEDIFF(MINUTE,t.JobTime,t2.JobTime) StepMinutes FROM MeasureGrowth t INNER JOIN MeasureGrowth t2 ON t.JobIdDate = t2.JobIdDate AND t.OrderId = (t2.OrderId - 1) ) SELECT MONTH(JobIdDate) JobMonth , JobStepNumber , AVG(StepMinutes) JobMonthAvgMinutes FROM GroupAll GROUP BY MONTH(JobIdDate), JobStepNumber |
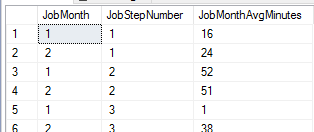
We see growth in the length of time from January to February of the first and third step.
The second point is one to consider from our measurements: as an example, if we see that our cleaning data step grows each month (especially geometric growth), scaling our design will be the only long-term solution – whether we scale the resources, such as more memory, CPU, etc or scaling out data horizontally where we clean batches of data at a time. One of the major reasons why scale becomes a problem for many companies is because they’re not measuring, comparing, and seeing the predicted growth patterns: they tend to do something only when something fails.
As our example in the above image shows, in two months, we’ve seen growth in two steps – the third step which grew from an average of one minute to an average of 38 minutes. This is an example of a problem sign and the earlier we scale, the faster we can avoid a major problem in the future. Scaling will cost, but scaling early costs less than scaling later, if our data volume is growing (we’ll have to scale more than less). It’s also possible that our data volume isn’t growing and we’re only seeing issues because of other processes that may be running in parallel that could be disrupting our job. The above query helps us measure the job side of our challenge – our data side and parallel queries and processes may indicate another challenge that doesn’t involve scale.
We should also consider that we may be able to combine steps. For an example, if we have to compare data to a data set range and we have another step for validating our data, can we combine these steps? Also, should be doing both with T-SQL or .NET? For an example, if we have a step that uses .NET which works with validating a row-based object, it may be most efficient to add all validation at that point, rather than do the validation in steps. The same applies to T-SQL: if we have to read a set of data for validation, can we combine all the validation into one SELECT statement versus several validation steps (think of multiple SELECT statements and the reads cost versus one on the same set of data). With the information about the growth, we can take the next steps of possibly combining, changing or scaling our design.
Summary
Anytime we have a multi-step process, such as an ETL or application flow, we want to monitor the time of each step and use what we know about our time to prepare for our future design, scale, or change that it may require. We’ve look at how to get this information from the SQL Server Job Agent, if we’re using it, or how we can construct our own custom design, if we use other tools from SSIS to a custom application.

He has spent a decade working in FinTech, along with a few years in BioTech and Energy Tech.He hosts the West Texas SQL Server Users' Group, as well as teaches courses and writes articles on SQL Server, ETL, and PowerShell.
In his free time, he is a contributor to the decentralized financial industry.
View all posts by Timothy Smith
- Data Masking or Altering Behavioral Information - June 26, 2020
- Security Testing with extreme data volume ranges - June 19, 2020
- SQL Server performance tuning – RESOURCE_SEMAPHORE waits - June 16, 2020