
In SQL server processor performance metrics – Part 1 – The most important cpu metrics, we described the Processor Queue Length and two most important processor time counters – Processor % Processor Time and Process % Processor time
In this part, we will continue describing important time processor countersProcessor: % User Time
There are two modes for all processes executed on a Windows operating system: a user mode and privileged (kernel) mode. The operations that require direct access to memory and machine hardware are executed in the privileged mode (I/O operations, disk access, system services, etc.). All user applications and processes (this is where SQL Server belongs) are executed in the user mode
The Processor: % User Time value “Corresponds to the percentage of time that the processor spends on executing user processes such as SQL Server.” [1]
In other words, this is the percentage of processor non-idle time spent on user processes
If the Processor:% User Time high values are caused by SQL Server, the reason can be non-optimal SQL Server configuration, excessive querying, schema issues, etc. Further troubleshooting requires finding the process or batch that uses so much processor time
The Processor:% User Time values close to 100% are a clear indication of processor bottlenecks. It means that user processes are using the processor all the time. To troubleshoot the issue, the first step is to determine the user application that causes the bottleneck
In an environment with multiple SQL Server instances running, it’s important to monitor each instance performance individually, to be able to easier troubleshoot excessive processor usage
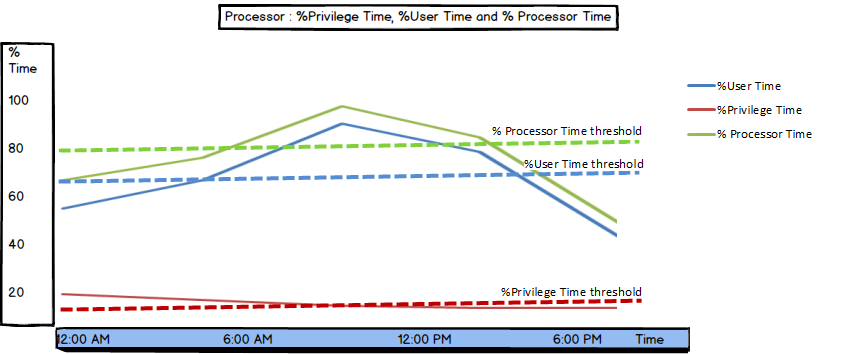
There is no specific value for this counter, you should monitor its value for a while and set a baseline. However, as the recommended Processor: % Processor Time value is 80% and the recommended Processor: % Privilege Time is maximum 10%, this leads to the conclusion that the recommended Processor: % User Time is below 70%
It’s expected that complex operations use more processor time. The value graph goes up then, but it should fall down to the baseline value afterwards. The Processor: % User Time value can oscillate around the baseline approximately 10% during the normal operation. If the peaks appear without an obvious reason, the user processes executed on the machine should be investigated
Processor: % Privilege Time
The Processor: % Privilege Time counter shows how much time the processor spends on executing non-user processes, i.e. privilege (kernel) mode operations
“If the processor is very busy and this mode is high, it is usually an indication of some type of NT service having difficulty, although user mode programs can make calls to the Kernel mode NT components to occasionally cause this type of performance issue.” [1]
This is another important counter that helps determining whether the processor problems originate from internal Windows processes, or are caused by a user application
The sum of Processor: % Privilege Time and Processor: % User Time gives Processor: % Processor Time There’s no need to monitor Processor: % Privilege Time, Processor: % User Time, and Processor: % Processor Time, as the third value can be calculated using other two. Monitoring any two of these will be sufficient
“the proportion of % Privileged Time to % User Time will depend on the system’s workload. A couple of common misconceptions are that there will be a balance between these two areas, and that each system will look the same. That having been said, a system performing the same workload over time should show little change in the ratio of Privileged to User time” [2]
If the Processor: % Privilege Time value is high, kernel mode processes are using a lot of processor time, the machine is busy executing basic operating system tasks and cannot run user processes and other applications, such as SQL Server. Using a more powerful processor can help
The recommended values for Processor: %Privilege Time are 5 to 10% , or maximum 30% of the % Total Processor Time (described next)
Total Processor Time
“This counter groups the activity of all the processors together to report the total performance of the entire system. On a single processor machine, this value will equal the %Processor Time value of the processor object.” [1]
The Total Processor Time counter shows the percentage of time during which the machine processors are busy, i.e. the percentage of time the processors we executing useful operations. The time needed for idle thread processing is excluded
The difference between this counter and Processor: % Processor Time is that Total Processor Time shows a sum of processor time percentages divided by the number of processors, i.e. an average value for all processors, while the latter shows one entry for each processor on the machine
The recommended value for Total Processor Time is up to 80% during normal operation. The remaining 20% are left for complex operations that cause peaks in processor usage, to avoid bottlenecks. If the value is constantly close to 100%, this is an indication of a processor bottleneck. To start troubleshooting, check the Processor: % Processor Time value to determine what processor handles most load
When one of the processors is using much more processor time then the others, the Total Processor Time value might be misleading, so it’s better to monitor both total and per processor values

% Total User Time
“This is the total user time of all the processors on the system.” [1]
The Processor: % User Time counter shows the user time on a single processor
% Total Privilege Time
“This is the total privilege time for all processors on the system collectively”
Similar as above, the Processor : %Privilege Time shows the privilege time on a single processor
Monitoring these total time counters is not very useful, as for any further analysis, it’s necessary to find out the processor where the bottleneck occurs
Thread: % Processor Time
This counter is required for a deeper analysis. It shows an entity for each thread on the processor. On a single processor machine that supports two threads, two entities are shown. To distinguish the specific thread among others, use the ThreadID value. The thread processor usage can be modified by adjusting the thread priority
Other metrics that can be monitored per thread are: Thread State, Priority Base, Current Priority, Context Switches/sec, % Privileged Time, and % User Time. These metrics are rarely used, as other metrics described in this and the previous part of the SQL Server performance series provide more useful information for processor performance analysis and troubleshooting

She has been working with SQL Server since 2005 and has experience with SQL 2000 through SQL 2014.
Her favorite SQL Server topics are SQL Server disaster recovery, auditing, and performance monitoring.
View all posts by Milena "Millie" Petrovic
- Using custom reports to improve performance reporting in SQL Server 2014 – running and modifying the reports - September 12, 2014
- Using custom reports to improve performance reporting in SQL Server 2014 – the basics - September 8, 2014
- Performance Dashboard Reports in SQL Server 2014 - July 29, 2014