
What is SQL Server Data Collector
SQL Server Data Collector is a feature for performance monitoring and tuning available in SQL Server Management Studio. It was introduced in SQL Server 2008 and is available in the Enterprise, Standard, Business Intelligence, and Web editionsWhat information can it gather?
Data Collector can gather performance information from multiple SQL Server instances and store it in a single repository. It has three built-in data collecting specifications (data collectors) designed to collect the most important performance metrics. The information collected by default is about disk usage, query statistics, and server activity. You can also create additional data collectors and monitor more metrics
How does Data Collector work?
Data Collector can run constantly, or on a pre-defined schedule
“The data collector also uses a data warehouse, a relational database that enables you to manage the data that you collect by setting different retention periods for your data.” [1]
It is recommended for the Management Data Warehouse (MDW) database to be stored in a non-production SQL Server instance. The best solution is to use a SQL Server instance designated only for the MDW, as the feature doesn’t have an option to exclude a specific database from data collecting. Keep in mind that the MDW can grow fast and make sure you have enough free disk space available. The MDW growth rate depends on the number of transactions, and for high-transaction databases, this can be a couple of hundred MBs a day
One DMW database can be used as a central database repository for all monitored SQL Server instances
The data it captures is not only displayed in real-time graphs, like with Activity Monitor, but also saved for later analysis
Besides Data Warehousing, Data Collector uses SQL Server Agent and Integration Services
Once Data Collector is enabled, it creates a number of scheduled jobs necessary for automatic data collection and data upload into the MDW database. They are also used to purge stored. The feature also adds tables to the msdb database, to store the configuration, auditing and collection history information, job information and SSIS packages
Integration Services packages transform and load the collected data into the MDW database
“Collection sets are defined and deployed on a server instance and can be run independently of each other. Each collection set can be applied to a target that matches the target types of all the collector types that are part of a collection set. The collection set is run by a SQL Server Agent job or jobs, and data is uploaded to the management data warehouse on a predefined schedule.” [1]
Predefined data collection sets
The Disk Usage data collection set collects information about disk space used by both data and log files for all databases on the SQL Server instance, growth trends, and average day growth
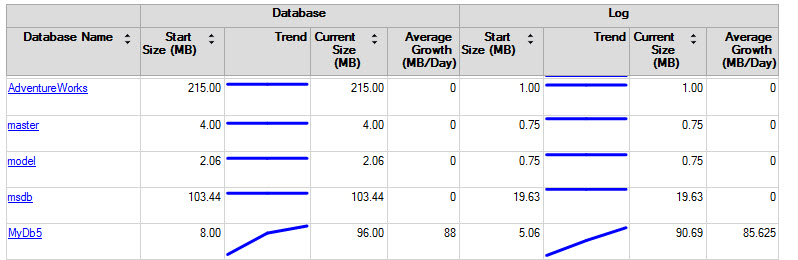
By default, the Disk Usage data collection set collects data every 60 seconds and uploads data into the MDW database every 6 hours in non-cached mode
“In non-cached mode, collection and upload are on the same schedule. The packages start, collect, and upload data at their configured frequency, and run until they are finished. There is only one job created for collection sets in non-cached mode. Non-cached mode allows for the collection and uploading of data to occur on demand, as well as at the intervals specified in the job.” [2]
The Query Statistics data collection set collects information about query statistics, activity, execution plans and text on the SQL Server instance. It does not store all executed statements, only 10 worst performing ones
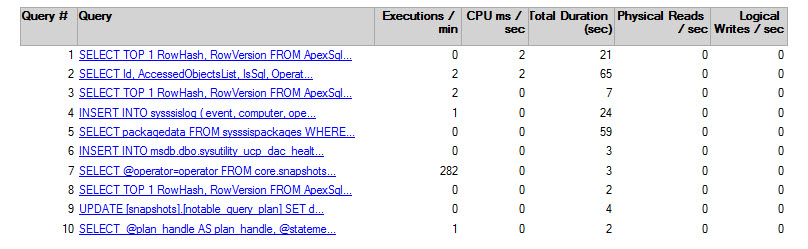
To collect more than top 10 worst performing queries, disable the default Query Statistics Collection Set and create a custom one using T-SQL or its API
The Query Statistics data collection set uploads the collected data in the cached mode
“In cached mode, the data collection and uploading of jobs are on different schedules, so two jobs are created for each collection set. Cached mode supports continuous collection of data, but less frequent uploads. For example, the default Server Activity collection set uploads data by default every 15 minutes. However, the collection items are collected every 60 seconds.” [2]
In the cached more, one SQL Server job is executed every 60 seconds to collect the data. This data is stored (cached) into a local cache folder. Another job is run every 15 minutes to read the cached data and insert it into the MDW database
The cashed mode creates less overhead than non-cached
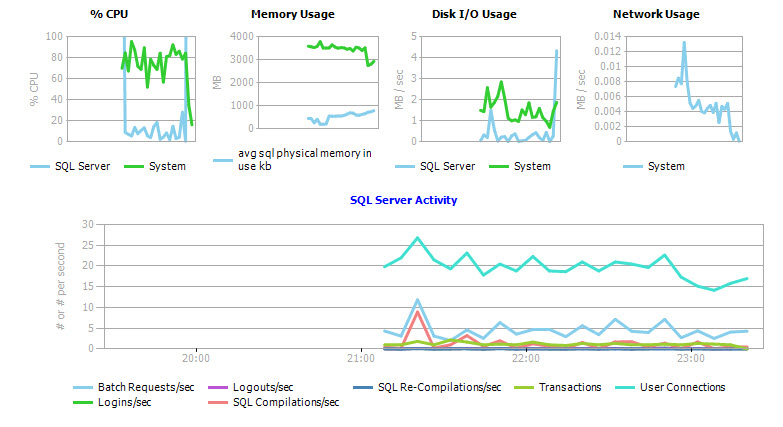
The Server Activity collection set collects information about resource usage (CPU, memory, disk I/O, and network), SQL Server waits, instance activity (batch requests, logouts, SQL compilations and recompilations, transactions, user connections, and logins), and operating system activity. Data is collected every 60 seconds and uploaded in cached mode every 15 minutes
The Data Collector feature is pre-defined to collect the data necessary to identify and troubleshoot most common SQL Server performance problems. It can be set up easily, without coding. If you want to collect more than the pre-defined metrics, you can create custom collection sets, but coding is required. The feature provides comprehensive built-in reports for the default collection sets. In the next part of this series, we will give steps to set up the necessary pre-requests and start data collecting

She has been working with SQL Server since 2005 and has experience with SQL 2000 through SQL 2014.
Her favorite SQL Server topics are SQL Server disaster recovery, auditing, and performance monitoring.
View all posts by Milena "Millie" Petrovic
- Using custom reports to improve performance reporting in SQL Server 2014 – running and modifying the reports - September 12, 2014
- Using custom reports to improve performance reporting in SQL Server 2014 – the basics - September 8, 2014
- Performance Dashboard Reports in SQL Server 2014 - July 29, 2014