
Starting with this article, we will present the most important CPU metrics, describe the information they show, and give recommended values and thresholds
Processor metrics show processor performance and influence of other components on processor
Processor: % Processor Time
The % Processor Time counter shows the percentage of time that “the processor actually spends working on productive threads and how often it was busy servicing requests.” [1]
As soon as the computer is turned on, the processor is executing threads with instructions. The processor is always active, even when there are no user or system threads, it is not completely idle as it executes the “idle thread” then
By design, there can be only one idle thread per processor. It has the lowest priority among all processor threads. The basic priority classes are idle, normal, high, and real. This means that an idle process is running on a processor only when there are no other threads. The idle process isn’t a real process that “eats” processor resources. It only occupies the processor until a real productive thread appears. A high percentage of system idle processes shows that the processor is unused most of the time
The percentage of the processor time counter is calculated as the difference between the total processor time and the time the idle thread was running
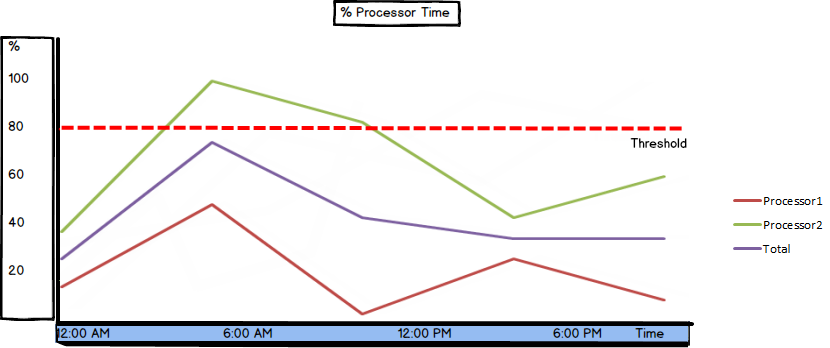
On a multi-processor machine, an instance of the % Processor Time counter is shown for every processor on the server. On a four-processor machine, the % Processor Time instances will be enumerated 0 to 3. Also, an instance is shown for each processor thread
On a virtual machine, % Processor Time shows the value for the virtual, not the physical machine
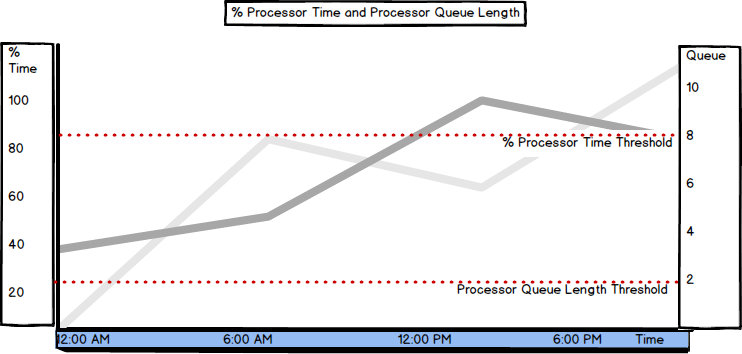
The recommended value for % Processor Time is below 80%. Occasional peaks are acceptable, but it shouldn’t be constantly high. But even high values of the % Processor time counter are not a clear indication of bottlenecks
If the % Processor Time value is constantly high, check the disk and network metrics first. If they are low, the processor might be under stress. To confirm this, check the average and current Processor Queue Length value. If these values are higher than the recommended, it clearly indicates a processor bottleneck. The final solution for this situation is adding more processors, as this will enable more requests to be executed simultaneously. If the Processor Queue Length value is low (the recommendations are given below), consider using more powerful processors
If the disk and network metrics are elevated, start the analysis and troubleshooting with these metrics first
% Processor Time is also shown in Windows Task Manager, but in case of multiple SQL Server instances running on the same machine, this information is not useful for deeper analysis and troubleshooting, as it doesn’t indicate which instance is presented
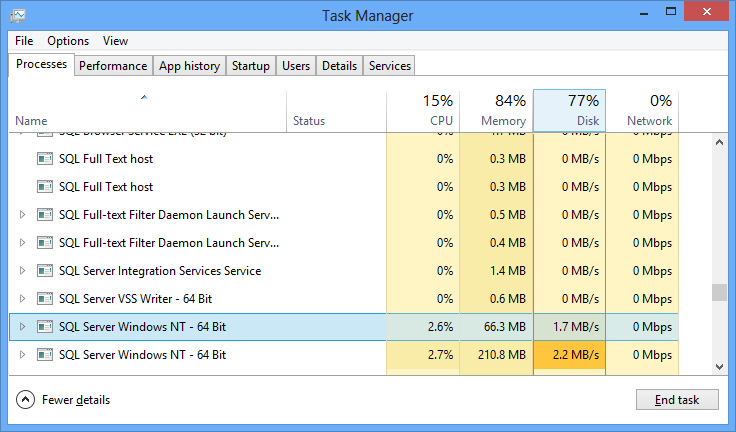
To be able to troubleshoot the processor issues, it’s necessary to know which processor is under stress and what SQL Server instances have issues. You can achieve this by monitoring additional parameters, such as ProcessID and then find the SQL Server instance that had such ProcessID. Another solution is to use a monitoring tool that shows the processor usage per SQL Server instance out-of-the-box
Process: % Processor Time
Windows Performance Monitor offers two counters with similar names Processor: % Processor Time and Process : % Processor Time. It’s important to distinguish between these two metrics and understand the information they show
As described above, % Processor Time shows the percentage of time that the processor works on non-idle threads
The Process: % Processor Time counter splits the processor time percentage per process, so each process is shown as a separate item in the graph. For more useful results, exclude the idle threads and total value
The total value for the processes time can be misleading. If the value is 100%, it can mean that all processes are using an equal share of processor time, or that one is using 90%, while others are struggling. That’s why monitoring the processor time for each process is recommended for troubleshooting
Processor Queue Length
The Processor Queue Length counter shows “a measure of the instantaneous size of the queue for all processors at the moment that the measurement was taken. The resulting value is a measure of how many threads are in the Ready state waiting to be processed.” [1]
Note that the threads currently running in the processor are not included. Even on a multi-processor machine, there is only one queue for all tasks that are waiting to be processed
The typical value for this counter is 0 or 1. The recommended value is under 5 per processor. Some DBAs consider the situation to be alarming even when Processor Queue Length is constantly higher than 2. Along with high % Processor Time, a high Processor Queue Length value is a clear indicator of a busy processor
The Processor Queue Length value can be increased due to activity of the applications other than SQL Server, having more than the optimal number of SQL Server instances on a single machine, high number of compilations and recompilations, etc
A high number of processes waiting to be processed and high CPU usage require immediate attention. Start with checking Compilations/sec and Re-Compilations/sec. There is no specific threshold for these metrics – monitor them for a while and set a baseline for typical behavior. A high number of compilations and recompilations usually indicates poor reuse of the query plans. This can be fixed by optimizing your queries and stored procedures
However, there are some specific actions (such as creating a compressed full database backup) that use a lot of processor resources and cause other tasks to be queued. These actions cause a temporary peak in the Processor Queue Length. Once you identify these actions, these peaks should not be alarming
Having applications other than SQL Server on your production server is a common reason for having high values for Processor Queue Length. The simplest way to determine if this is the case is to open Windows Task Manager, sort descending the processes in the Process tab by the CPU usage and monitor the top ones. If SQL Server is not among them, other applications are using more processor time than SQL Server and affecting its performance. The only solution is to remove them or use a dedicated machine for SQL Server only
The Processor Queue Length counter shows relevant values when monitoring a SQL Server instance on a virtual machine, so it can be used to indicate insufficient processor resources on the virtual machine and SQL Server instances it hosts
The % Processor Time and Processor Queue Length counters are among the most important processor performance metrics. They indicate the intensity of processor usage and whether there are more threads to be processed than the processor can handle. If removing other applications that use processor resources and optimizing SQL queries and stored procedures doesn’t solve the processor bottlenecks indicated by these two counters, consider having more powerful processors, or adding additional ones

She has been working with SQL Server since 2005 and has experience with SQL 2000 through SQL 2014.
Her favorite SQL Server topics are SQL Server disaster recovery, auditing, and performance monitoring.
View all posts by Milena "Millie" Petrovic
- Using custom reports to improve performance reporting in SQL Server 2014 – running and modifying the reports - September 12, 2014
- Using custom reports to improve performance reporting in SQL Server 2014 – the basics - September 8, 2014
- Performance Dashboard Reports in SQL Server 2014 - July 29, 2014