
As discussed in the article All about latches in SQL Server, spinlocks are also a special form of locks that SQL Server uses to protect data. Spinlocks are lightweight objects used by the SQL Server Operating System (SQLOS) to protect data structure access. To understand, properly, the difference between latches and spinlocks and why the spinlock is an important SQL Server’ object type, it is vital to understand the cycle of query execution in SQL Server
The SQL Server Operating System (SQLOS) is solely responsible for SQL Server’s thread scheduling and it is in no way dependent on the Windows operating system scheduler. In modern multi CPU environments, SQLOS will allocate a scheduler to each CPU core for the purpose of thread management. Therefore, all requests issued by users will be run via the SQLOS scheduler. This means, in practical terms, that when a 4 octa-core processors machine hosts SQL Server, the SQLOS will form 32 schedulers. Below is the graphical presentation of a query execution in SQL Server and how the scheduler is working

The SQLOS scheduler (popularly called SOS Scheduler) is made of three components:
Processor – the physical/logical CPU core responsible for processing the thread. It can process only one thread at a time
Runnable queue – it utilizes a stringent First-In-First-Out (FIFO) order of threads that have to be processed. A thread that is in transition from the processor/waiter list into a runnable queue will be positioned last in the queue, and it must wait for all threads previously moved into the runnable queue (when the resource governor is enabled the FIFO order can be overridden as with enabled governor, resource pool priorities can be assigned differently to a workload groups. Use of the resource governor is generally rare)
Waiter list – all the threads that are in a suspended state are stored in the waiter list. Suspended threads are the one that must wait for a resource to become available to them. There are no limitations imposed to a waiter list regarding the time that thread can be contained and there are no options to limit the time a thread can spend in the waiter list. However, when the timeout is specified for the query execution session, it takes precedence and the thread will be canceled as a result of the execution timeout
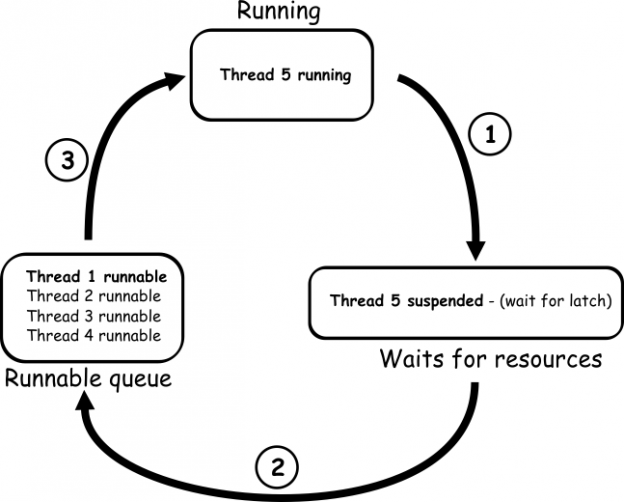
Each thread run by the scheduler can be in one of the three states:
RUNNING – a thread is executing on the processor physical or logical core. One thread at a time can be executed on a single core
SUSPENDED – a thread requests a resource that is not available, so it is pushed into the waiter list. A thread stays in the waiter list as long as the requested resource became available
RUNNABLE – a thread that requests a resource that is available, but moved into the runnable queue to wait for the CPU to became available
There are two scenarios how scheduler can work:
- A thread runs through three states to complete the request issued by the user
- A thread runs through two states to complete the request issued by the user
Since only the first scenario is within the context of this article, the second scenario will not be explained here

In the image above, the running thread, 5, tries to access a needed resource, which is not available at the moment of request. Therefore, the thread, 5, state changes to suspended and it is moved to the wait list. The thread, 5, will remain suspended until the needed resource become available and there is no time limitation for how long a thread stays in the waiter list (the number of threads in waiter list is not limited as well). The moment when the required resource becomes available, thread 5 will be pushed to a runnable queue to wait for the processor to become available. Once the processor becomes available, the thread 5 will complete the request (in case that it requires another unavailable resource that it has to wait for, the sequence will be repeated)
What is the SQL Server spinlock
So now that we have explained the query execution process, let’s see what the difference is between latches and spinlocks and why the spinlock was introduced in SQL Server, in the first place. As it can be seen in the article, All about Latches in SQL Server. it would be overkill for SQLOS to use latches for every shared data structure in order to synchronize the multiple threads access to a shared data structure. When a thread tries to acquire a latch over a shared data structure where another thread has already acquired a latch that is not compatible, the thread will have to wait. It enters the suspend state and is moved in the waiter list. The thread will remain in the suspended state until it is signaled that it can acquire the latch, and then it will be moved to the runnable queue to wait for the CPU resource to become available and it will remain there until the CPU became available for thread execution. As soon as the CPU is available, the thread goes in the running state again and it can now acquire the latch on the shared data structure
As it can be seen, the latch could be a way for synchronizing highly active data structures. To reduce the overhead that latches could impose over the busy data structures, SQL Server has implemented a spinlock as a different form of the synchronization object. While similar to a latch, there is one important difference – the wait for the spinlock is “active” one as the thread will not leave the running state while waiting, which practically means that spinlocks always occur on the CPU.
Spinlocks are used by SQLOS when thread access time, to a commonly accessed data structure, is expected to be very short. If a thread that tries to acquire a spinlock cannot get the access to a target data structure, it executes periodically while in the running state, in the so-called “spin loops” to check for the resource availability, instead of yielding immediately into a suspend state.
A spinlocks’ advantage over latches is that a thread that acquired the SQL Server spinlock will be executed in a loop on a CPU in a running state, while the thread that unsuccessfully tries to acquire a latch will yield immediately in a suspend state. This is an expensive operation as it requires switching the context of a thread to go off the CPU to allow another thread to enter the running state, especially for data resources that are frequently seized for a very short period of time. Conversely, a spinlock waists CPU cycles while waiting, that could be used by the other thread
To explain the mechanism behind SQL Server spinlocks in a simple way, let’s assume that there is a request for the frequently used resource, but used for a very short time. Since this is the resource that is used often and for a very short period of time, when a thread tries to access that resource and cannot gain the access immediately it will be in the so-called “collision” state. In such a situation, the SQLOS will assume that the chances that resource will become available, if the thread waits just a tiny bit longer, are high. In such situations, the SQLOS assumes that the time needed for the resource to become available is much shorter than the time needed for the thread to voluntarily yield to a suspended state and go back to a running state. So, the thread will stay in the running state and it will keep repeating the question to SQLOS “Can I get CPU?… Can I get CPU?” and so on. In most cases, the CPU should become quickly available. A case where thread have to “spin” on CPU longer than expected, will be explained in the rest of the text as well
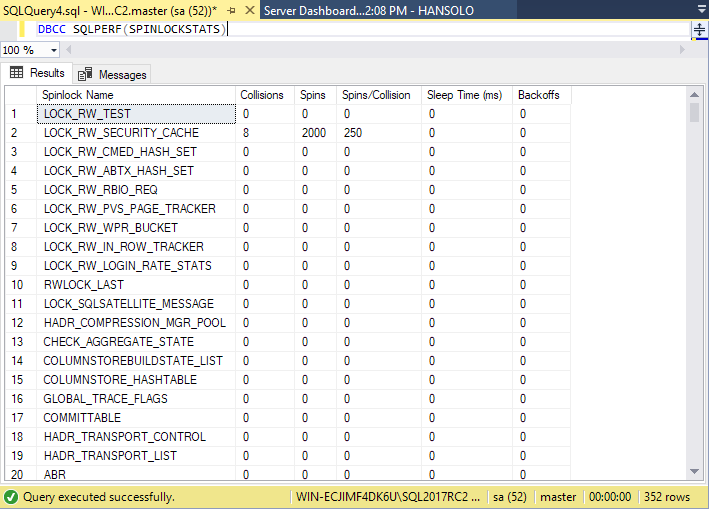
SQL Server is using a lot of different spinlocks and the number of spinlocks increases with each new SQL Server version. To check the spinlock counters there are two commands that could be used:
-
DBCC SQLPERF(SPINLOCKSTATS)
In the latest SQL Server 2017 RC2 version, the number of spinlocks that will be displayed with this command is 352 vs. 324 in SQL Server 2016

-
sys.dm_os_spinlock_stats
The important metrics related to spinlocks are collisions and spins_per_collision. The DMV provides both metrics in the columns with the same name in this DMV. Of course, the name column is equally important as it displays the spinlock type. So, the above query can be used most time in the following form:
12345SELECT name, collisions, spins_per_collisionFROM sys.dm_os_spinlock_statsORDER BY spins_per_collision DESC;
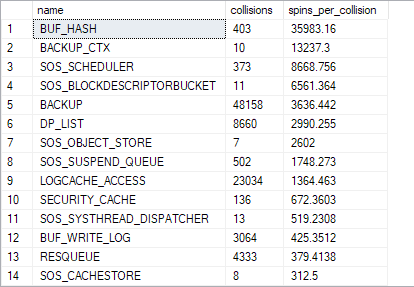
The details about columns that this DMV contains:
- name: the spinlock name
- collisions: shows how many times a thread was blocked by a spinlock when attempting to access a protected resource
- spins: shows how many times a thread loop spun while trying to acquire spinlock on resource
- spins_per_collision: shows the spins/collisions ratio
- sleep_time: shows the sleep time of a thread as a consequence of the backoff mechanism
- backoffs: shows how many times the thread was backed off to grant CPU resource use to other threads
Unfortunately, none of these commands are documented by Microsoft.
Backoff mechanism
To prevent a thread from waiting for too many CPU cycles while attempting to acquire a spinlock, after some time a thread waiting on a SQL Server spinlock will assume a “sleep” state while remaining in the running state, even it hasn’t managed to obtain the resource. In that way, it will allow to another thread to be executed on the same CPU. This “sleep” state is known as a backoff SQLOS mechanism. By default, SQLOS will spin for a constant period of time first before it switches the thread to the sleep state by performing a backoff. Trying to acquire the spinlock again considers that the cash concurrency state is maintained all the time and this is the CPU intensive operation. To avoid that, attempts to acquire a spinlock are performed in a restricted manner and therefore not performed on each thread spin
Starting with SQL Server 2008R2, for some spinlock types, an improved backoff mechanism was implemented that allows an interval between two attempts, by a thread, to acquire the spinlock to be increased in an exponential manner, thus reducing in most cases, the influence on CPU performance. In such situations, SQLOS will intelligently presume that in situation where thread cannot acquire spinlock after he resumed from the sleep state, the next sleep state should be exponentially longer as there is a less chance now that the thread will manage to acquire spinlock if the sleep state time remains the same
The sqlos.spinlock_backoff extended event can be also used for analysis as this event is raised each time when the backoff happens.
SQL Server spinlock contention
The spinlock itself, as a little-documented SQL Server internal, is often overlooked as a potential or real cause of SQL Server performance issues. Not to mention that due to lack of official documentation, it is not easy to diagnose the spinlock as a root cause of SQL Server performance problems.
So, let’s use a simplified version in order to explain the basics of spinlock contention
SQL Server uses scalability to maintain the system performance. Good SQL Server scalability means that the system will grow in relatively predictable and stable way with changes of its capacity in terms of resources that will be used. Since the SQL Server spinlock is CPU related, the following example will use CPU as an example of scalability.
Let’s take the situation where SQL Server has to process 2,000 threads per second, and in a system that consists of 12 CPUs, the CPU usage is at 10%. If the number of tasks that have to be processed doubles, to 4,000 threads per second, optimal scalability would mean that CPU usage goes up to 20-25%. In situations like this, it can be said that a system is “scalable”. As it can be seen, a “scalable” system means that resource usage change should be more or less proportional to the capacity imposed by the system. Doubling the capacity should ideally double the resource usage (in real-world scenario a bit more than expected use of resources is expected)
But if there is a similar situation where CPU usage goes up to 70+% for example, then it is obvious that for some reason SQL Server scalability doesn’t work and it is an indication that system doesn’t have a proper scalability
A situation like this, where a proportional increase of transactions per second is followed by a disproportional increase of the CPU usage % and an excessive increase in spins and possibly backoff events number, is a typical scenario where spinlock contention could be the cause.
What happens, in such a situation, is that spinlock is “spinning” too long which takes up CPU and practically wastes the CPU time, as it will not much CPU left for other threads that are executing. It is obvious that SQLOS was not properly predicted the CPU usage by threads and the acquired spinlock spins too long instead of going into a sleep state.
As previously stated, this is the simplified scenario that serves to illustrate and explain the spinlock contention. The disproportional increase of the CPU usage with an increase of a number of threads per second doesn’t mean automatically that spinlock contention is in effect, and there is a lot of various causes that have to be evaluated and discarded before jumping into conclusion that spinlock contention is the root cause
LOCK_HASH spinlock
The most frequent situation where spinlock contention can occur is related to the LOCK_HASH spinlock type. When large LOCK_HASH spinlock values are followed by the large number of spins, collisions, and backoffs, then it is possible, but not certain, that spinlock contention is the root cause of the performance issues
The high number of LOCK_HASH spins could occur in situations where continuous and very frequent access to a lock manager hash table bucket is present. In such situations, it is highly possible that the excessive number of spins and backoffs will follow this spinlock. There are a couple of ways to mitigate LOCK_HASH spinlock contention:
- Use the shortest possible transactions
- Ensure that application is not using multiple sessions for updating the same data
- Turn off the page level locking
- Closely track lock escalation as the contention on the hash bucket will be higher, as the roughly gained is the SQL Server lock
- Potentially use NOLOCK hint in queries in situations where more than one thread tries to read the same data at the same time
The other frequent SQL Server spinlock types
LOGCACHE_ACCESS – this spinlock could be the bottleneck in situations when an OLTP based application is using SQL Server and it is not optimized to behave in accordance with whether the Hekaton in-memory engine is in use or not
LOGFLUSHQ – this is the spinlock that a thread acquires when a commit operation takes place. The spinlock will be held all the way until the relevant thread logging info has been copied into the write queue
XDESMGR – this spinlock serves for protection of the database engine mechanism that is working with transaction ids. Using multiple DML statements per single transaction can decrease the pressure on this type of spinlock
Hardware and SQL Server spinlocks
When designing the system, there are some tips that should be followed that can help minimize spinlock contention. When choosing the CPU for the system, if possible, select the CPU with the highest clock available as that will allow single threaded transactions to run faster. In systems with multiple CPUs, configuring the system out of the NUMA limits could cause increased latencies that will be caused by spinlock is being forced to move between the NUMA nodes using the quick path interconnect (QPI)

Military aviation devotee and hard core scale aircraft modeler. Extreme sports fan; parachutist and bungee jump instructor. Once serious, now just a free time photographer
View all posts by Nikola Dimitrijevic
- SQL Server trace flags guide; from -1 to 840 - March 4, 2019
- How to handle the SQL Server WRITELOG wait type - June 13, 2018
- SQL Server performance counters (Batch Requests/sec or Transactions/sec): what to monitor and why - June 5, 2018