
In this part, we will present processor performance metrics that indicate performance issues caused by hardware component problems
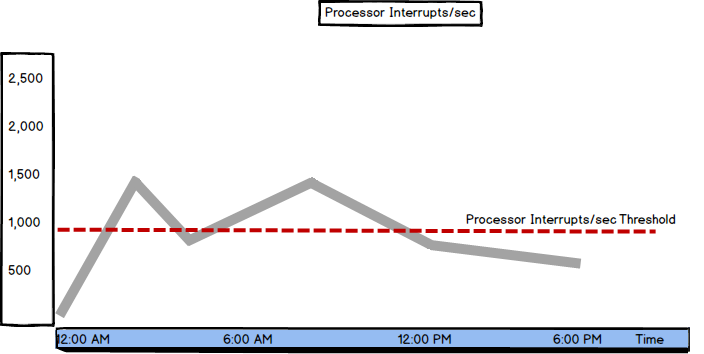
Processor: Interrupts/sec
Hardware interrupts are among the most common performance problem causes. They can induce processor bottlenecks, the same as other, more obvious causes such as insufficient memory
An interrupt is an event generated on a hardware or software component, that sends a signal to the processor requesting immediate attention. When the processor is notified that there is a high priority event, it stops the execution of the currently processed thread, suspends all current activities, saves its state, and executes a specific procedure called the interrupt handler. After the interrupt handler finishes its tasks, the saved state is read and the processor continues where from the point where it was interrupted
Hardware interrupts can be generated on a computer component (such as hard disk or a network controller) or on an external peripheral device. They are usually caused by errors in driver configuration, general hardware failure, or excessive component usage
Interrupts/sec is a processor metric that shows “The numbers of interrupts the processor was asked to respond to.” [1]
An entity is shown for each processor on the machine, e.g. on a four-processor machine, four entities are shown
The only device that is constantly creating interrupts is a processor hardware timer that generates an interrupt every 10 to 15 milliseconds, which results in up to 100 interrupts per second
The recommended value of Interrupts/sec depends on the processor, rate of disk I/O operations, and the number of network packets. However, for modern processors, up to 1,000 interrupts per second can be considered as normal
High values of the metric can be encountered after adding a large number of new applications to the machine and they can indicate hardware problems and conflicts. Before coming to a conclusion, they should be investigated
“A dramatic increase in this counter value without a corresponding increase in system activity indicates a hardware problem. Identify the network adapter or disk controller card causing the interrupts. You might need to install an additional adapter or controller card.” [2]
To check the disk controller and network adapter are working properly, use Windows Device Manager and check the device status for both
Peaks can be encountered and they don’t clearly indicate a serious performance issue. If the peaks are less than 30 percent of the normal values, this is not alarming. If they exceed this value, deeper investigation is needed and the final solution would be upgrading to a faster processor
Another metric that should be checked when troubleshooting high Interrupts/sec values is the Systems Calls/sec (explained below). Higher values are encountered in systems with excessive Windows system activity
Processor: % Interrupt Time
The Processor % Interrupt Time metric also shows the information about the interrupts, but unlike the Processor Interrupts/sec metric that shows the number of the interrupts, this metric shows the time the processor spends processing interrupts. To be precise, it shows the percentage of total processor time spent handling interrupts
The recommended value is less than 50%. According to some DBAs, the maximum values should be up to 30 % per processor. Higher values might indicate hardware problems. The same as with Processor Interrupts/sec, in these situations it’s recommended to check the Systems Calls/sec value. If it’s higher than 20,000, it indicates that the system generates more interrupts than the processor can handle. Upgrading hardware components will most probably solve the issue
“Some components on the computer can force this issue and not really be a problem. For example a programmable I/O card like an old disk controller card, can take up to 40% of the CPU time. A NIC on a busy IIS server can likewise generate a large percentage of processor activity.” [1]
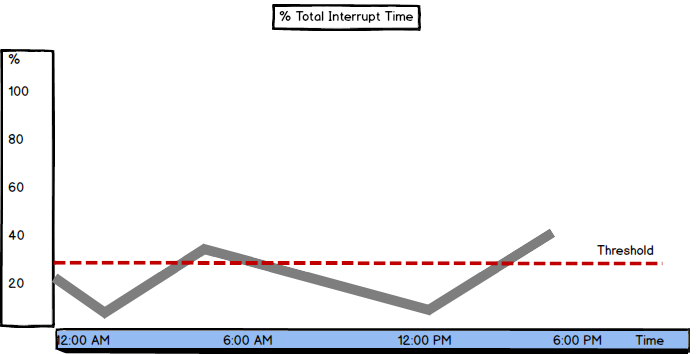
% Total Interrupt Time
In the Part 8, we described several total time metrics – Total Processor Time, % Total User Time, and % Total Privilege Time. The same logic is used when calculating the value for the % Total Interrupt Time metric – a sum of processor interrupt time percentages for each processor (Processor % Interrupt Time) divided by the number of processors
The same as with other total times, for troubleshooting it’s necessary to monitor the interrupt time for each processor
The threshold value for normal operation is the same as for Processor % Interrupt Time, i.e. individual processors, less than 30 %
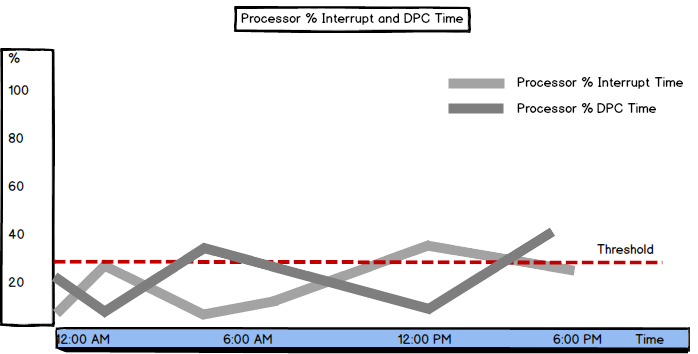
Processor: %DPC Time
The Processor: %DPC Time metric shows the percentage of the time the processor spends on executing Deferred Procedure Calls (DPC). When a hardware interrupt happens, the interrupt handler can chose to put off some of the work for later by using a Deferred Procedure Call. These are also high priority tasks executed in the privileged (kernel) mode, but their priority is lower than the priority of interrupt handlers
The time used by Deferred Procedure Calls therefore is included in the Processor: % Privileged Time metric. If the Processor: % Privileged Time value is high, check the Processor: %DPC Time to determine the cause
Also have in mind that the sum of Process: % Processor Time: Total + Processor: % Interrupt Time + Processor: % DPC Time is equal to 100%. When working, the processor handles productive threads, service requests, or executes instructions (Process: % Processor Time: Total), processes hardware interrupts (Processor: % Interrupt Time), or processes Deferred Procedure Calls (Processor: %DPC Time)
For high values of the Processor: %DPC Time metric, monitor the interrupt rate for each processor
The source of the Deferred Procedure Call requests is usually a network adapter. Disk can also be the source of excessive Deferred Procedure Call requests, but not so often. Replacing these components will solve the problem
The threshold value for the Processor: %DPC Time metric is the same as for Processor: % Interrupt Time – up to 30%
Processor: Interrupts/sec, Processor: % Interrupt Time, % Total Interrupt Time, and Processor: %DPC Time indicate hardware issues that can affect SQL Server performance. All metrics have a clear threshold that signals a problem and usually a need for further investigation and checking other performance parameter values. Replacing the existing hardware components or using more powerful ones is in most cases the right solution

She has been working with SQL Server since 2005 and has experience with SQL 2000 through SQL 2014.
Her favorite SQL Server topics are SQL Server disaster recovery, auditing, and performance monitoring.
View all posts by Milena "Millie" Petrovic
- Using custom reports to improve performance reporting in SQL Server 2014 – running and modifying the reports - September 12, 2014
- Using custom reports to improve performance reporting in SQL Server 2014 – the basics - September 8, 2014
- Performance Dashboard Reports in SQL Server 2014 - July 29, 2014