
In the previous part of this series, we presented the processor metrics that indicate hardware component problems that can affect SQL Server performance
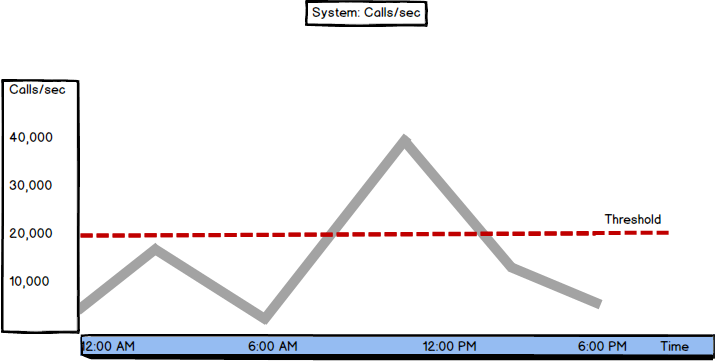
In this part, we will present processor metrics that are not necessary in every performance monitoring scenario, but are useful for deeper investigation and troubleshootingSystem: Calls/sec
“This counter is a measure of the number of calls made to the system components, Kernel mode services. This is a measure of how busy the system is taking care of applications and services—software stuff. When compared to the Interrupts/Sec it will give you an indication of whether processor issues are hardware or software related” [1]
In other words System: Calls/sec metric shows the number of software calls to the operating system service routines per second. As the Processor: Interrupts/Sec shows the number of hardware calls to the processor, these two metrics can determine the source of the performance problems
The normal values for System: Calls/sec are under 20,000. Higher values might indicate excessive operating system activity caused by software applications. In this case, check the Context Switches/sec value (explained later) to identify the process responsible for excessive software calls
It’s expected that the System: Calls/sec values are higher than Processor: Interrupts/sec. However, if the latter is higher, it’s a clear indication of a hardware problem
Thread Object: Priority Base
“The thread gets a base priority from the Process that created it. The priority of the thread can be adjusted by the system or through a program. This priority is used to judge when the thread is going to have access to the process and how many other threads it may jump ahead of in the processor queue of ready threads.” [1]
The idle thread has the lowest priority among all processor threads. Useful processor threads can have the following priority classes: low, below normal, normal, above normal, high, and real time
Monitoring the Thread Object: Priority Base metric will help you determine whether there are threads with higher priority than optimal. We have already recommended using a dedicated machine for SQL Server. Having additional applications, especially resource-intensive ones, can use resources needed by SQL Server and degrade its performance. Assigning these processes higher priority than normal will affect execution and performance of other threads and processes, and even block them. SQL Server will have to wait for the processor to handle other applications first and its performance will suffer
To see the base priority of the thread, you can use the Windows Task Manager
- Open Windows Task Manager (press Ctrl+ Alt + Delete)
- Open the Details tab
- Right-click the header and select Show columns
- Select Base priority. Now the Base priority column is shown in the grid, so you can order the records descending by their priority
- Right-click a process
- Select Set priority and select one of the options offered
To change the thread priority:
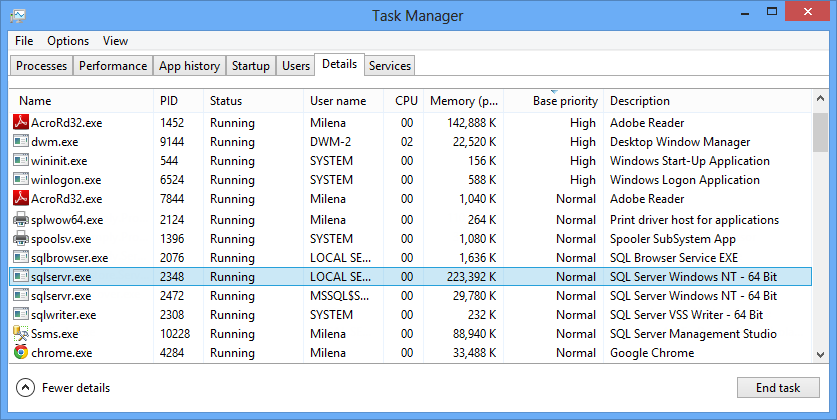
All processes have the normal priority by default, except some system processes
Now, check the priority of the SQL Server process – sqlservr.exe. By default, it should be normal. If there are some non-system and non-essential applications, processes, or services running with priority higher than normal, they can jeopardize the performance of your SQL Server. If there are no obvious or logical reasons for this, reduce their priority to normal and allow SQL Server to use as much processor time it can get
The same metric, but in different presentation is shown in Windows Performance Monitor
- Start Windows Performance Monitor – open Control Panel, Administrative Tools, Performance Monitor
- In the left pane, select Performance Monitor
- Right-click the graph on the right
- Select Add counters
- In the list, select Thread and then Priority Base
- In the lower list, select the processes you want to monitor
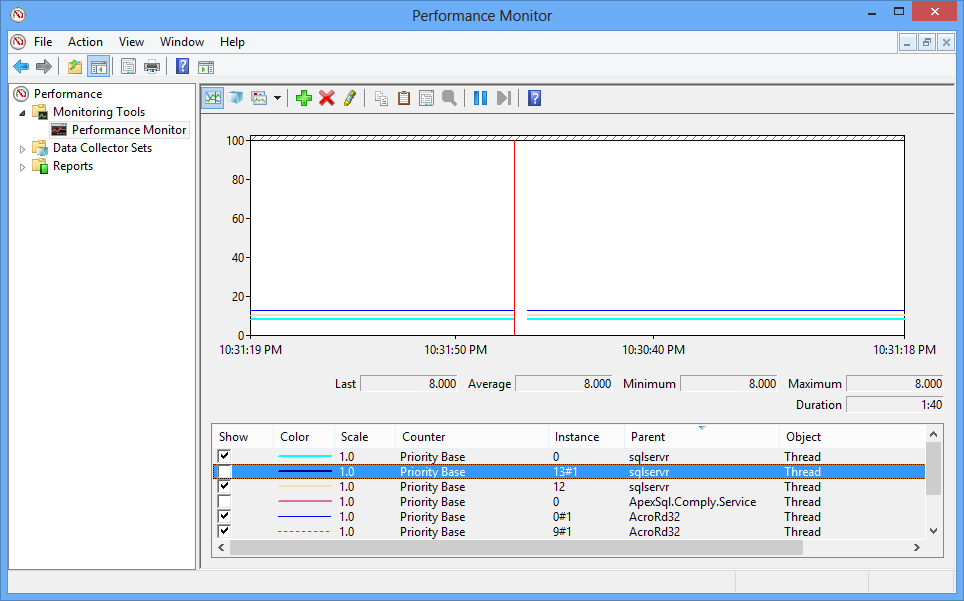
The values shown in the Performance Monitor graph are not descriptive like in Windows Task Manager, but numerical:
| Numerical value | Priority |
| 4 | Low |
| 6 | Below normal |
| 8 | Normal | 10 | Above normal |
| 13 | High |
| 24 | Real time |
Context Switches/sec
The Context Switches/sec metric is used to obtain more in-depth information about processor issues
“A context switch occurs when the kernel switches the processor from one thread to another—for example, when a thread with a higher priority than the running thread becomes ready.” [2]
A thread can be replaced by a thread of a higher-priority, or a thread executed in the user mode can be replaced by a kernel mode thread
It’s important to monitor context switching as it can indicate performance issues. If a specific process is using the processor more than others, not allowing other processes to be processed, the rate of context switching will be low. A high rate of context switching indicates that many processes are using and competing for the processor time, and it is switching from one thread to another frequently. Too frequent switching, the same as too rare, indicates problems
The Context Switches/sec counter shows a rate at which the processor switches from one thread to another. This is a total rate for all processors on the machine, i. e. the sum of the Thread:Context Switches/sec metric for all threads on all processors on the machine
The average Context Switches/sec value should be below 2,000 per processor. Some DBAs consider this limit to be 5,000 per processor. Higher values can be caused by excessive page faults caused by insufficient memory. Also, if hyper-threading is turned on, turn it off and test the performance. It can significantly reduce the threading and solve performance problems
High Context Switches/sec values are more frequent on the machines that besides the database system host other resource-intensive applications. They can also occur on a system with several SQL Server instances
Constantly high values of Context Switches/sec and Processor: % Processor Time are a clear indication of processor bottlenecks. The ultimate solution is changing the processor to a more powerful one, or adding an additional one
Thread Object: ID Thread
Every thread running on the operating system is uniquely identified by its ID. If the same thread is executed again, it will be assigned a new ID
The Thread Object: ID Thread metric shows an ID of the process thread, necessary to differentiate a specific thread among others. This metric is useful if you’re monitoring other metrics that provide details based on the thread ID
Process: Process ID
Every process running on the operating system is uniquely identified by its ID. If the same process is executed again, it will be assigned a new ID
The same as Thread Object: ID Thread, the Process: Process ID metric is usually used for determining the right process when process details are based on the Process ID
The performance of SQL Server can be affected by other applications or by other SQL Server instances hosted on the same machine. Monitor the System: Calls/sec value to identify resource-intensive applications, check Thread Object: Priority Base to find out if any application has been given higher priority and thus eating processor time needed by SQL Server, watch Context Switches/sec to see whether all applications can get the processor time they need

She has been working with SQL Server since 2005 and has experience with SQL 2000 through SQL 2014.
Her favorite SQL Server topics are SQL Server disaster recovery, auditing, and performance monitoring.
View all posts by Milena "Millie" Petrovic
- Using custom reports to improve performance reporting in SQL Server 2014 – running and modifying the reports - September 12, 2014
- Using custom reports to improve performance reporting in SQL Server 2014 – the basics - September 8, 2014
- Performance Dashboard Reports in SQL Server 2014 - July 29, 2014