
In SQL Server performance metrics – part 3, we presented some of the SQL Server Buffer Manager metrics. As the SQL Server buffer pool manages data cache, it’s important to monitor various buffer pool metrics as they help identify and solve memory pressure issues
In this article, we will present 2 more Buffer Manager counters – Buffer Cache Hit Ratio and Page Life Expectancy.
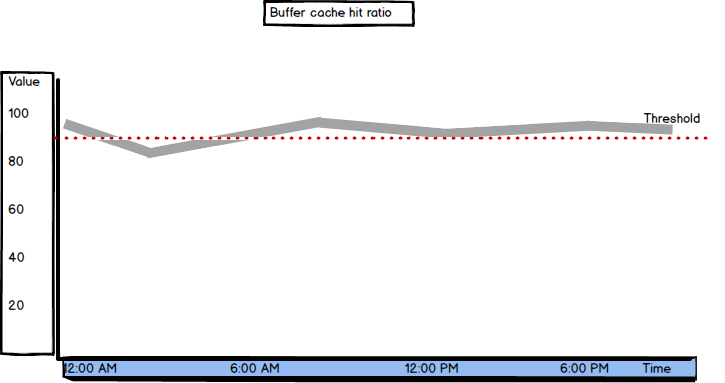
Buffer Cache Hit Ratio
Buffer Cache Hit Ratio shows how SQL Server utilizes buffer cache
“Percent of page requests satisfied by data pages from the buffer pool” [1]
It gives the ratio of the data pages found and read from the SQL Server buffer cache and all data page requests. The pages that are not found in the buffer cache are read from the disk, which is significantly slower and affects performance
Ideally, SQL Server would read all pages from the buffer cache and there will be no need to read any from disk. In this case, the Buffer Cache Hit Ratio value would be 100. The recommended value for Buffer Cache Hit Ratio is over 90. When better performance is needed, the minimal acceptable value is 95. A lower value indicates a memory problem
The fact that “after a long period of time, the ratio moves very little” [2] explains the biggest disadvantage of this metric. In situations when performance is changing significantly, Buffer Cache Hit Ratio shows little variations, so you cannot be aware of the significance of the change. That’s why other metrics, such as Page Life Expectancy are suggested. Their values can quickly drop or raise, which clearly indicates significant changes that require attention
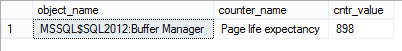
The same as with other Buffer Manager metrics, it’s value can be obtained from the sys.dm_os_performance_counters view
|
1 2 3 4 5 6 |
SELECTobject_name, counter_name, cntr_value FROM sys.dm_os_performance_counters WHERE [object_name] LIKE '%Buffer Manager%' AND [counter_name] = 'Buffer cache hit ratio' |

Due to inert behavior of Buffer Cache Hit Ratio, the values it shows can be misleading and it’s recommended to check values of other SQL Server Buffer Manager counters, such as Page Life Expectancy, Free list stalls/sec, Page reads/sec, etc.
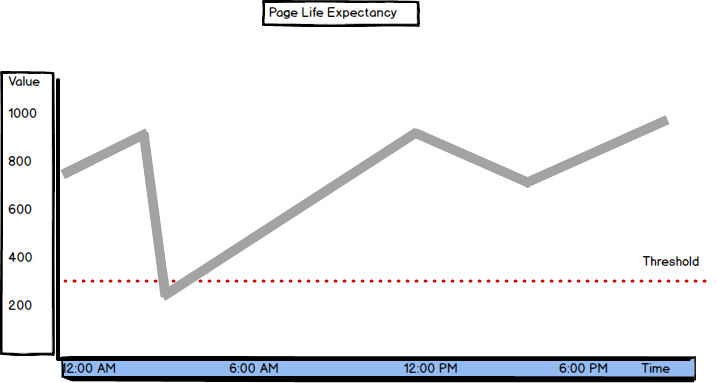
Page Life Expectancy
“Duration, in seconds, that a page resides in the buffer pool” [2]
SQL Server has more chances to find the pages in the buffer pool if they stay there longer. If the page is not in the buffer pool, it will be read from disk, which affects performance. If there’s insufficient memory, data pages are flushed from buffer cache more frequently, to free up the space for the new pages
When there’s sufficient memory on the server, pages have a high life expectancy. The normal values are above 300 seconds (5 minutes) and the trend line should be stable. It’s recommended to monitor the values over time, as frequent quick drops indicate memory issues. Also, a value drop of more than 50% is a sign for deeper investigation
As typical hardware configurations used currently provide more resources, the normal values are often high above 300. If there’s enough memory on the machine, the Page Life Expectancy value will be over 1,000. If the value is below 300, it’s a clear indication that something is wrong
“For example, a server with 230GB RAM allocated to the SQL Server buffer pool and a Page Life Expectancy of 300 would equate roughly to 785MB/sec of I/O activity to maintain the page churn inside of the buffer pool. While it might be possible for the I/O subsystem to keep up with this demand, this represents a significant amount of page churn in the buffer pool” [3]
|
1 2 3 4 5 6 |
SELECT object_name, counter_name, cntr_value FROM sys.dm_os_performance_counters WHERE [object_name] LIKE '%Buffer Manager%' AND [counter_name] = 'Page life expectancy' |
The cause for Page Life Expectancy values below 300 can be poor index design, missing indexes, mismatched data types, insufficient memory, etc.

She has been working with SQL Server since 2005 and has experience with SQL 2000 through SQL 2014.
Her favorite SQL Server topics are SQL Server disaster recovery, auditing, and performance monitoring.
View all posts by Milena "Millie" Petrovic
- Using custom reports to improve performance reporting in SQL Server 2014 – running and modifying the reports - September 12, 2014
- Using custom reports to improve performance reporting in SQL Server 2014 – the basics - September 8, 2014
- Performance Dashboard Reports in SQL Server 2014 - July 29, 2014