
Description
Indexing is key to efficient query execution. Knowing what indexes are unneeded, incorrectly used, or unused can allow us to reduce disk usage and improve write performance at little cost to your organization.
This is the first part in a series that will culminate in an automated index analysis solution, allowing you to understand index usage proactively, rather than waiting for things to break in order to resolve them.
Introduction
Adding indexes to our important tables is likely a regular part of our performance tuning regimen. When we identify a frequently executed query that is scanning a table or causing an expensive key lookup, one of our first considerations is if an index can solve the problem.
While indexes can improve query execution speed, the price we pay is on index maintenance. Update and insert operations need to update the index with new data whenever columns in the index are included. This means that writes will slow down slightly with each index we add to a table. For example, if we were to insert a row into Production.Product (in AdventureWorks), the resulting execution plan for the insert would look like this:
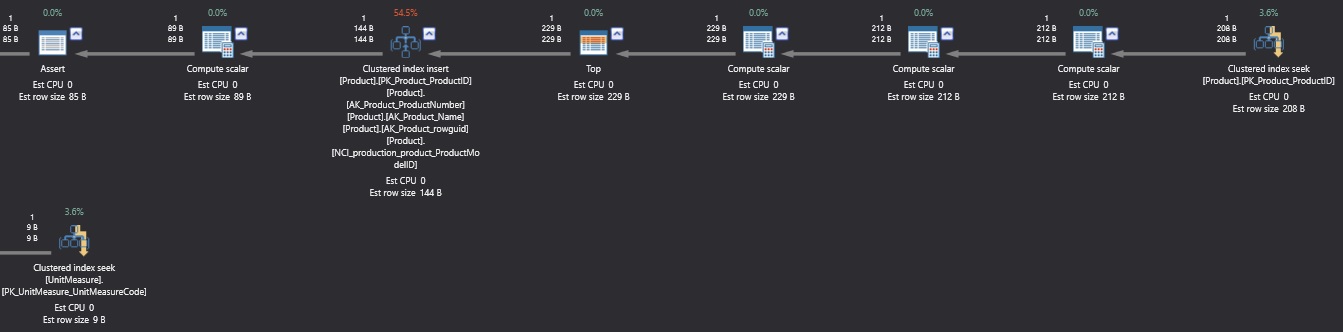
Note the step “Clustered Index Insert” and the note that 4 non-clustered indexes were also inserted into, in addition to the clustered index. Any indexes we add would subsequently add to the write operations necessary to complete the overall operation.
To offset the frequent need to add or update indexes, we need to monitor index usage and identify when an existing index is no longer needed. This allows us to keep our indexing relevant and trim enough to ensure that we don’t waste disk space and IO on write operations to any unnecessary indexes.
Index Utilization Metrics Collection
The first step towards monitoring and intelligently responding to index usage needs is to collect and maintain a simple and easy-to-use data set of index usage metrics. This data set should allow us to quickly search for common scenarios in which we might consider removing or altering an index:
- Unused indexes.
- Minimally used indexes.
- Indexes that are written to significantly more than they are read.
- Indexes that are scanned often, but rarely the target of seeks.
- Indexes that are very similar and can be combined.
SQL Server provides a dynamic management view that tracks all index usage: sys.dm_db_index_usage_stats. This view is a cumulative total of operations against indexes and is reset when SQL Server services are restarted. There was also a bug in previous versions of SQL Server in which an index rebuild would trigger a reset to these stats. Details on this bug and its resolution can be found in the references at the end of this article.
Since this data is not maintained by SQL Server indefinitely, we need to create our own storage mechanism to ensure it is persisted through server restarts, allowing us to make smart decisions with a long-term data set.
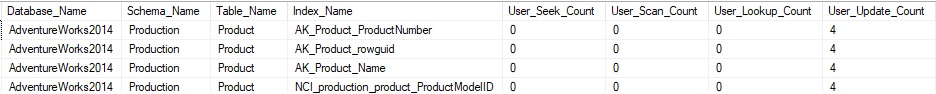
A SELECT against this view returns the following data on my local server:
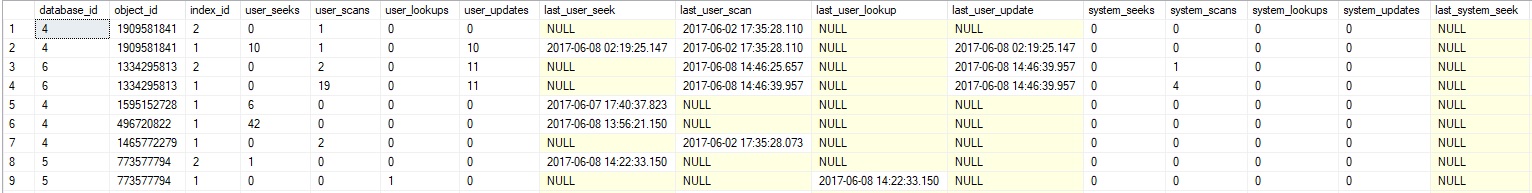
Totals are given for seeks, scans, lookups, and updates, which allows us to accurately gauge the overall read/write operations against any given index. We also can see the last time an index had those operations performed against them, where NULL indicates that none have happened since the last instance restart.
In order to collect this data, we will follow a relatively simple process:
- Create a table to store index metrics detail data. This will persist all data from each collection point-in-time and do so for a limited history. This detail can be useful for troubleshooting or seeing the status of an index at a given point-in-time.
- Create a table to store aggregate index summary data. This provides a long-term view of how indexes have been used since they were created. We can clear this data at any point-in-time if we decide that we’d like to begin counting these metrics anew.
- Create and execute a stored procedure that will populate these tables.
Once created, a collection stored procedure can be run at regular intervals using any automated process, such as SQL Server Agent.
Schema Creation
Our first task is to create a holding table for detail data:
|
1 2 3 4 5 6 7 8 9 10 11 12 13 14 15 16 17 18 19 |
CREATE TABLE dbo.Index_Utiliztion_Details ( Index_Utiliztion_Metrics_Id INT NOT NULL IDENTITY(1,1) CONSTRAINT PK_Index_Utiliztion_Metrics PRIMARY KEY CLUSTERED, Index_Utiliztion_Details_Create_Datetime DATETIME NOT NULL, [Database_Name] SYSNAME, [Schema_Name] SYSNAME, Table_Name SYSNAME, Index_Name SYSNAME, User_Seek_Count BIGINT, User_Scan_Count BIGINT, User_Lookup_Count BIGINT, User_Update_Count BIGINT, Last_User_Seek DATETIME, Last_User_Scan DATETIME, Last_User_Lookup DATETIME, Last_User_Update DATETIME, ); CREATE NONCLUSTERED INDEX IX_Index_Utiliztion_Details_indexUtiliztionDetailsCreateDatetime ON dbo.Index_Utiliztion_Details (Index_Utiliztion_Details_Create_Datetime); |
This table maintains a list of index metrics for each index inspected and tags it with the creation date/time, allowing us to trend usage over time, if needed. Data types for counts are chosen liberally as an index being hit 2.15 billion times is in no way an unattainable feat!
The second table we need will store summary data, which will contain aggregate stats over a longer period of time:
|
1 2 3 4 5 6 7 8 9 10 11 12 13 14 15 16 17 18 19 20 21 22 23 |
CREATE TABLE dbo.Index_Utiliztion_Summary ( Index_Utiliztion_Summary_Id INT NOT NULL IDENTITY(1,1) CONSTRAINT PK_Index_Utiliztion_Summary PRIMARY KEY CLUSTERED, [Database_Name] SYSNAME, [Schema_Name] SYSNAME, Table_Name SYSNAME, Index_Name SYSNAME, User_Seek_Count BIGINT, User_Scan_Count BIGINT, User_Lookup_Count BIGINT, User_Update_Count BIGINT, Last_User_Seek DATETIME, Last_User_Scan DATETIME, Last_User_Lookup DATETIME, Last_User_Update DATETIME, Index_Utiliztion_Summary_Create_Datetime DATETIME NOT NULL, Index_Utiliztion_Summary_Last_Update_Datetime DATETIME NOT NULL, User_Seek_Count_Last_Update BIGINT, User_Scan_Count_Last_Update BIGINT, User_Lookup_Count_Last_Update BIGINT, User_Update_Count_Last_Update BIGINT ); |
We include a create and last update time, allowing the viewer to know when an index was first tracked, and when the last time it was updated by the process. The four columns at the end track the last value for each aggregated count that was reported by the process. This ensures that when a restart occurs, we know exactly how to handle our aggregation, ie: Should we sum values or find the difference between them in order to determine the change since the last update.
Our last step in schema creation is to write a stored procedure that will perform this collection for us. By default, we will check index statistics on all tables in all databases. Indexed views are not included here, but could very easily be added if you had a frequent need to track their use.
This stored procedure will iterate through all non-system databases, read from dm_db_index_usage_stats, join that data to other system views, and report it back to our permanent tables that were created above. This process is quite fast, as the volume of data we are looking at is bounded by the number of indexes you have. If only a single database or set of databases matters to you, then filtering can be performed in order to limit the database list to those of interest.
|
1 2 3 4 5 6 7 8 9 10 11 12 13 14 15 16 17 18 19 20 21 22 23 24 25 26 27 28 29 30 31 32 33 34 35 36 37 38 39 40 41 42 43 44 45 46 47 48 49 50 51 52 53 54 55 56 57 58 59 60 61 62 63 64 65 66 67 68 69 70 71 72 73 74 75 76 77 78 79 80 81 82 83 84 85 86 87 88 89 90 91 92 93 94 95 96 97 98 99 100 101 102 103 104 105 106 107 108 109 110 111 112 113 114 115 116 117 118 119 120 121 122 123 124 125 126 127 128 129 130 131 132 133 134 135 136 137 138 139 140 141 142 143 144 145 146 147 148 149 150 151 152 153 154 155 156 157 158 159 160 161 162 163 164 165 166 167 168 169 170 171 172 173 174 175 176 177 178 179 180 181 182 183 184 185 186 187 188 189 190 191 192 193 194 195 196 197 198 199 200 201 202 203 204 205 206 207 208 209 210 211 212 213 214 215 216 217 218 219 220 221 222 |
IF EXISTS (SELECT * FROM sys.procedures WHERE procedures.name = 'Populate_Index_Utilization_Data') BEGIN DROP PROCEDURE dbo.Populate_Index_Utilization_Data; END GO /* This stored procedure is intended to run semi-regularly (every 4-6 hours is likely sufficient) and will populate the table dbo.Missing_Index_Details with missing index data from the appropriate DMVs. This information can then be used in researching which indexes are not used, underused, or misused. */ CREATE PROCEDURE dbo.Populate_Index_Utilization_Data @Retention_Period_for_Detail_Data_Days TINYINT = 30, @Truncate_All_Summary_Data BIT = 0 AS BEGIN SET NOCOUNT ON; -- Remove old detail data based on the proc parameter. There is little need to save this data long-term. DELETE Index_Utiliztion_Details FROM dbo.Index_Utiliztion_Details WHERE Index_Utiliztion_Details.Index_Utiliztion_Details_Create_Datetime < DATEADD(DAY, -1 * @Retention_Period_for_Detail_Data_Days, CURRENT_TIMESTAMP); IF @Truncate_All_Summary_Data = 1 BEGIN TRUNCATE TABLE Index_Utiliztion_Summary; END DECLARE @Database_List TABLE ( [Database_Name] SYSNAME NOT NULL, Is_Processed BIT NOT NULL); DECLARE @Sql_Command NVARCHAR(MAX); DECLARE @Current_Database_Name SYSNAME; INSERT INTO @Database_List ([Database_Name], Is_Processed) SELECT databases.name AS [Database_Name], 0 AS Is_Processed FROM sys.databases WHERE databases.name NOT IN ('master', 'msdb', 'model', 'tempdb', 'ReportServerTempDB', 'ReportServer'); CREATE TABLE #Index_Utiliztion_Details ( Index_Utiliztion_Details_Create_Datetime DATETIME NOT NULL, [Database_Name] SYSNAME, [Schema_Name] SYSNAME, Table_Name SYSNAME, Index_Name SYSNAME, User_Seek_Count BIGINT, User_Scan_Count BIGINT, User_Lookup_Count BIGINT, User_Update_Count BIGINT, Last_User_Seek DATETIME, Last_User_Scan DATETIME, Last_User_Lookup DATETIME, Last_User_Update DATETIME ); WHILE EXISTS (SELECT * FROM @Database_List Database_List WHERE Database_List.Is_Processed = 0) BEGIN SELECT TOP 1 @Current_Database_Name = Database_List.[Database_Name] FROM @Database_List Database_List WHERE Database_List.Is_Processed = 0 SELECT @Sql_Command = ' USE [' + @Current_Database_Name + '] INSERT INTO #Index_Utiliztion_Details (Index_Utiliztion_Details_Create_Datetime, [Database_Name], [Schema_Name], Table_Name, Index_Name, User_Seek_Count, User_Scan_Count, User_Lookup_Count, User_Update_Count, Last_User_Seek, Last_User_Scan, Last_User_Lookup, Last_User_Update) SELECT CURRENT_TIMESTAMP AS Index_Utiliztion_Details_Create_Datetime, ''' + @Current_Database_Name + ''' AS [Database_Name], schemas.name AS [Schema_Name], tables.name AS Table_Name, indexes.name AS Index_Name, dm_db_index_usage_stats.user_seeks AS User_Seek_Count, dm_db_index_usage_stats.user_scans AS User_Scan_Count, dm_db_index_usage_stats.user_lookups AS User_Lookup_Count, dm_db_index_usage_stats.user_updates AS User_Update_Count, dm_db_index_usage_stats.last_user_seek AS Last_User_Seek, dm_db_index_usage_stats.last_user_scan AS Last_User_Scan, dm_db_index_usage_stats.last_user_lookup AS Last_User_Lookup, dm_db_index_usage_stats.last_user_update AS Last_User_Update FROM ' + @Current_Database_Name + '.sys.dm_db_index_usage_stats INNER JOIN ' + @Current_Database_Name + '.sys.indexes ON indexes.object_id = dm_db_index_usage_stats.object_id AND indexes.index_id = dm_db_index_usage_stats.index_id INNER JOIN ' + @Current_Database_Name + '.sys.tables ON tables.object_id = indexes.object_id INNER JOIN ' + @Current_Database_Name + '.sys.schemas ON schemas.schema_id = tables.schema_id WHERE dm_db_index_usage_stats.database_id = (SELECT DB_ID(''' + @Current_Database_Name + '''));'; EXEC sp_executesql @Sql_Command; UPDATE Database_List SET Is_Processed = 1 FROM @Database_List Database_List WHERE [Database_Name] = @Current_Database_Name; END INSERT INTO dbo.Index_Utiliztion_Details (Index_Utiliztion_Details_Create_Datetime, [Database_Name], [Schema_Name], Table_Name, Index_Name, User_Seek_Count, User_Scan_Count, User_Lookup_Count, User_Update_Count, Last_User_Seek, Last_User_Scan, Last_User_Lookup, Last_User_Update) SELECT * FROM #Index_Utiliztion_Details; MERGE INTO dbo.Index_Utiliztion_Summary AS Utilization_Target USING ( SELECT * FROM #Index_Utiliztion_Details ) AS Utilization_Source ON ( Utilization_Target.[Database_Name] = Utilization_Source.[Database_Name] AND Utilization_Target.[Schema_Name] = Utilization_Source.[Schema_Name] AND Utilization_Target.Table_Name = Utilization_Source.Table_Name AND Utilization_Target.Index_Name = Utilization_Source.Index_Name ) WHEN MATCHED THEN UPDATE SET User_Seek_Count = CASE WHEN Utilization_Source.User_Seek_Count = Utilization_Target.User_Seek_Count_Last_Update THEN Utilization_Target.User_Seek_Count WHEN Utilization_Source.User_Seek_Count >= Utilization_Target.User_Seek_Count THEN Utilization_Source.User_Seek_Count + Utilization_Target.User_Seek_Count - Utilization_Target.User_Seek_Count_Last_Update WHEN Utilization_Source.User_Seek_Count < Utilization_Target.User_Seek_Count AND Utilization_Source.User_Seek_Count < Utilization_Target.User_Seek_Count_Last_Update THEN Utilization_Target.User_Seek_Count + Utilization_Source.User_Seek_Count WHEN Utilization_Source.User_Seek_Count < Utilization_Target.User_Seek_Count AND Utilization_Source.User_Seek_Count > Utilization_Target.User_Seek_Count_Last_Update THEN Utilization_Source.User_Seek_Count + Utilization_Target.User_Seek_Count - Utilization_Target.User_Seek_Count_Last_Update END, User_Scan_Count = CASE WHEN Utilization_Source.User_Scan_Count = Utilization_Target.User_Scan_Count_Last_Update THEN Utilization_Target.User_Scan_Count WHEN Utilization_Source.User_Scan_Count >= Utilization_Target.User_Scan_Count THEN Utilization_Source.User_Scan_Count + Utilization_Target.User_Scan_Count - Utilization_Target.User_Scan_Count_Last_Update WHEN Utilization_Source.User_Scan_Count < Utilization_Target.User_Scan_Count AND Utilization_Source.User_Scan_Count < Utilization_Target.User_Scan_Count_Last_Update THEN Utilization_Target.User_Scan_Count + Utilization_Source.User_Scan_Count WHEN Utilization_Source.User_Scan_Count < Utilization_Target.User_Scan_Count AND Utilization_Source.User_Scan_Count > Utilization_Target.User_Scan_Count_Last_Update THEN Utilization_Source.User_Scan_Count + Utilization_Target.User_Scan_Count - Utilization_Target.User_Scan_Count_Last_Update END, User_Lookup_Count = CASE WHEN Utilization_Source.User_Lookup_Count = Utilization_Target.User_Lookup_Count_Last_Update THEN Utilization_Target.User_Lookup_Count WHEN Utilization_Source.User_Lookup_Count >= Utilization_Target.User_Lookup_Count THEN Utilization_Source.User_Lookup_Count + Utilization_Target.User_Lookup_Count - Utilization_Target.User_Lookup_Count_Last_Update WHEN Utilization_Source.User_Lookup_Count < Utilization_Target.User_Lookup_Count AND Utilization_Source.User_Lookup_Count < Utilization_Target.User_Lookup_Count_Last_Update THEN Utilization_Target.User_Lookup_Count + Utilization_Source.User_Lookup_Count WHEN Utilization_Source.User_Lookup_Count < Utilization_Target.User_Lookup_Count AND Utilization_Source.User_Lookup_Count > Utilization_Target.User_Lookup_Count_Last_Update THEN Utilization_Source.User_Lookup_Count + Utilization_Target.User_Lookup_Count - Utilization_Target.User_Lookup_Count_Last_Update END, User_Update_Count = CASE WHEN Utilization_Source.User_Update_Count = Utilization_Target.User_Update_Count_Last_Update THEN Utilization_Target.User_Update_Count WHEN Utilization_Source.User_Update_Count >= Utilization_Target.User_Update_Count THEN Utilization_Source.User_Update_Count + Utilization_Target.User_Update_Count - Utilization_Target.User_Update_Count_Last_Update WHEN Utilization_Source.User_Update_Count < Utilization_Target.User_Update_Count AND Utilization_Source.User_Update_Count < Utilization_Target.User_Update_Count_Last_Update THEN Utilization_Target.User_Update_Count + Utilization_Source.User_Update_Count WHEN Utilization_Source.User_Update_Count < Utilization_Target.User_Update_Count AND Utilization_Source.User_Update_Count > Utilization_Target.User_Update_Count_Last_Update THEN Utilization_Source.User_Update_Count + Utilization_Target.User_Update_Count - Utilization_Target.User_Update_Count_Last_Update END, Last_User_Seek = CASE WHEN Utilization_Source.Last_User_Seek IS NULL THEN Utilization_Target.Last_User_Seek WHEN Utilization_Source.Last_User_Seek < Utilization_Target.Last_User_Seek THEN Utilization_Target.Last_User_Seek ELSE Utilization_Source.Last_User_Seek END, Last_User_Scan = CASE WHEN Utilization_Source.Last_User_Scan IS NULL THEN Utilization_Target.Last_User_Scan WHEN Utilization_Source.Last_User_Scan < Utilization_Target.Last_User_Scan THEN Utilization_Target.Last_User_Scan ELSE Utilization_Source.Last_User_Scan END, Last_User_Lookup = CASE WHEN Utilization_Source.Last_User_Lookup IS NULL THEN Utilization_Target.Last_User_Lookup WHEN Utilization_Source.Last_User_Lookup < Utilization_Target.Last_User_Lookup THEN Utilization_Target.Last_User_Lookup ELSE Utilization_Source.Last_User_Lookup END, Last_User_Update = CASE WHEN Utilization_Source.Last_User_Update IS NULL THEN Utilization_Target.Last_User_Update WHEN Utilization_Source.Last_User_Update < Utilization_Target.Last_User_Update THEN Utilization_Target.Last_User_Update ELSE Utilization_Source.Last_User_Update END, Index_Utiliztion_Summary_Last_Update_Datetime = CURRENT_TIMESTAMP, User_Seek_Count_Last_Update = Utilization_Source.User_Seek_Count, User_Scan_Count_Last_Update = Utilization_Source.User_Scan_Count, User_Lookup_Count_Last_Update = Utilization_Source.User_Lookup_Count, User_Update_Count_Last_Update = Utilization_Source.User_Update_Count WHEN NOT MATCHED BY TARGET THEN INSERT ( [Database_Name], [Schema_Name], Table_Name, Index_Name, User_Seek_Count, User_Scan_Count, User_Lookup_Count, User_Update_Count, Last_User_Seek, Last_User_Scan, Last_User_Lookup, Last_User_Update, Index_Utiliztion_Summary_Create_Datetime, Index_Utiliztion_Summary_Last_Update_Datetime, User_Seek_Count_Last_Update, User_Scan_Count_Last_Update, User_Lookup_Count_Last_Update, User_Update_Count_Last_Update ) VALUES ( Utilization_Source.[Database_Name], Utilization_Source.[Schema_Name], Utilization_Source.Table_Name, Utilization_Source.Index_Name, Utilization_Source.User_Seek_Count, Utilization_Source.User_Scan_Count, Utilization_Source.User_Lookup_Count, Utilization_Source.User_Update_Count, Utilization_Source.Last_User_Seek, Utilization_Source.Last_User_Scan, Utilization_Source.Last_User_Lookup, Utilization_Source.Last_User_Update, CURRENT_TIMESTAMP, CURRENT_TIMESTAMP, Utilization_Source.User_Seek_Count, Utilization_Source.User_Scan_Count, Utilization_Source.User_Lookup_Count, Utilization_Source.User_Update_Count ); DROP TABLE #Index_Utiliztion_Details; END |
The stored procedure above accepts 2 parameters:
@Retention_Period_for_Detail_Data_Days: The number of days for which data in Index_Utilization_Details will be kept.
@Truncate_All_Summary_Data: A flag that indicates whether the summary data should be removed so that aggregation can start anew. This could be useful after significant server or application settings in which you want a fresh measure of activity.
How much data to retain is completely up to your needs and how far back you’ll typically want index usage history. The default is 30 days, but far more can be kept without consuming any significant amount of storage.
The temporary table #Index_Utiliztion_Details is used within the stored procedure in order to stage the current set of index usage data. This allows for us to insert this data into the detail table and merge it into the summary table without needing to access all of the system views a second time. It also allows for our messy MERGE statement to be a bit less messy.
The MERGE statement is complex as it needs to ensure that our new running totals are accurate, regardless of when the server was last restarted and what any current values are. Instead of checking the server restart time and attempting to gauge the appropriate action, we compare the current value for a count to the previous value and the last collected value. This allows us to determine if this counter was reset since our last stored procedure run and accurately determine how to calculate the new value.
For example, if the aggregate count of seeks on an index is 100, the new reading from the DMV is 25, and our previously collected value was 10, then we can determine that we have had 15 seeks since the last reading. It is possible the server restarted and we have had 25 since that last reading, but micromanaging our numbers to that extent is not necessary for a good idea of how our indexes our used. Unless a server is restarted hourly or daily, our metrics will provide enough accuracy to be effective. It also avoids the need to worry about the bug in previous versions that zeroed out this view upon index rebuilds.
Using the Process: What Can We Learn?
How often to execute this process is an important question to consider. Typically, once per day or a few times per day is adequate. If more granularity is desired and you’d like to be able to compare index usage counts at, say, 5pm vs. 8am, then the timings can be customized to meet your needs.
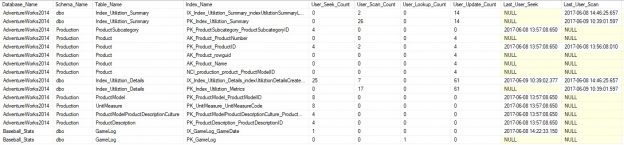
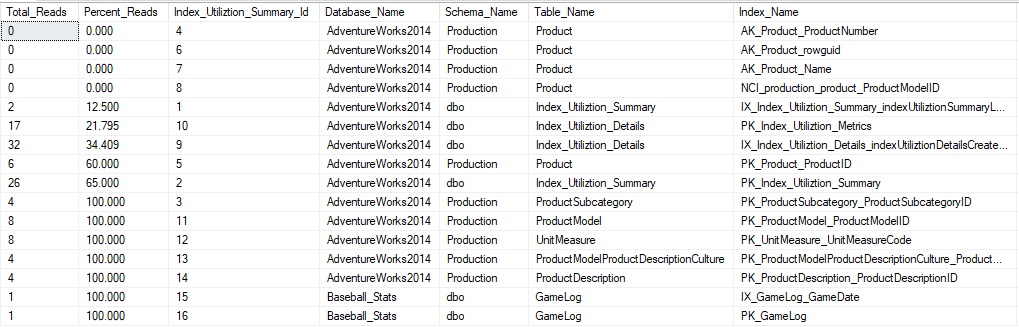
Once the process has been running for a few days, we can look at the summary data and learn about our index use, which will trend back until the last instance restart:
From here, we can see index activity that stretches back to a few days ago when I last restarted my laptop. For data we can act on reliably, we’d want weeks or months of data to act on, but can begin to form an idea of what indexes may be unused or underused. One simple check we can perform is to determine any indexes that have no reads against them:
|
1 2 3 4 5 6 7 8 |
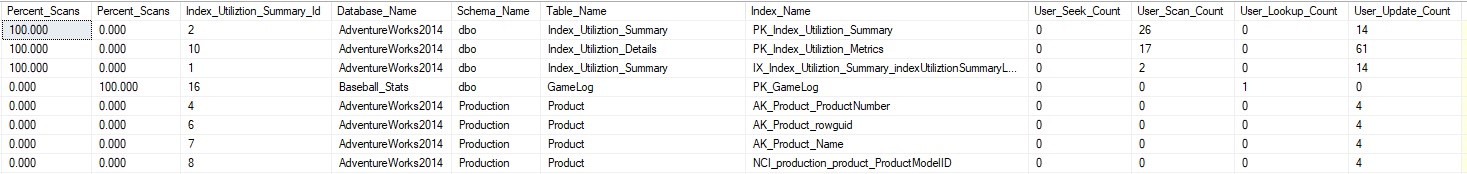
SELECT * FROM dbo.Index_Utiliztion_Summary WHERE Index_Utiliztion_Summary.User_Seek_Count = 0 AND Index_Utiliztion_Summary.User_Scan_Count = 0 AND Index_Utiliztion_Summary.User_Lookup_Count = 0; |
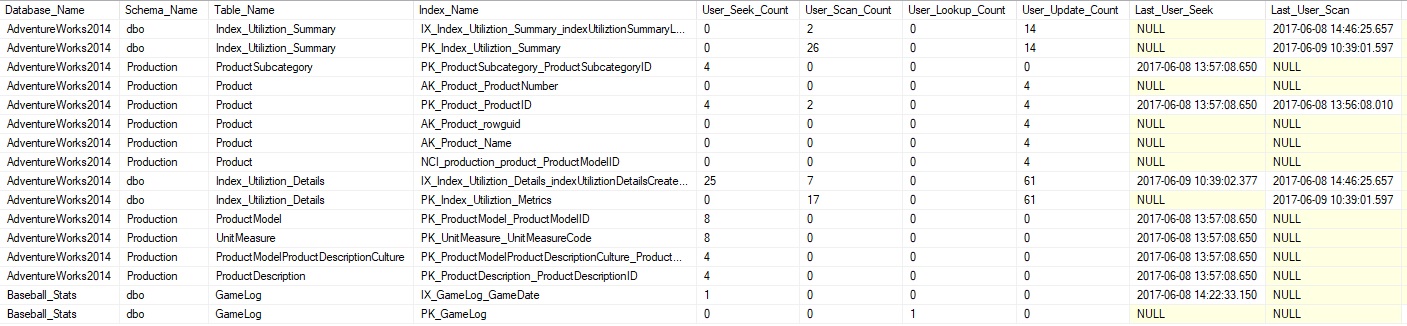
These indexes are the most likely candidates for removal as they have no reads within our aggregated data:
An index that is written to, but never read is essentially useless and can be removed, assuming it is truly unused, which is the important fact that we need to verify. Some indexes may be used infrequently, such as for a quarterly finance report or a yearly executive summary. In addition to ensuring that an index is not used in any commonly executed queries, we need to make sure that it is not needed for less frequent processes.
Indexes with zero reads are rare and unlikely in a real-world database. More likely, there will be indexes that are written to far more often than read, but are still read. To find indexes that are used, but are inefficient, we can adjust our query above:
|
1 2 3 4 5 6 7 8 9 10 |
SELECT Index_Utiliztion_Summary.User_Seek_Count + Index_Utiliztion_Summary.User_Scan_Count + Index_Utiliztion_Summary.User_Lookup_Count AS Total_Reads, CAST((Index_Utiliztion_Summary.User_Seek_Count + Index_Utiliztion_Summary.User_Scan_Count + Index_Utiliztion_Summary.User_Lookup_Count) * 100.00 / (Index_Utiliztion_Summary.User_Seek_Count + Index_Utiliztion_Summary.User_Scan_Count + Index_Utiliztion_Summary.User_Lookup_Count + Index_Utiliztion_Summary.User_Update_Count) AS DECIMAL(6,3)) AS Percent_Reads, * FROM dbo.Index_Utiliztion_Summary ORDER BY CAST((Index_Utiliztion_Summary.User_Seek_Count + Index_Utiliztion_Summary.User_Scan_Count + Index_Utiliztion_Summary.User_Lookup_Count) * 100.00 / (Index_Utiliztion_Summary.User_Seek_Count + Index_Utiliztion_Summary.User_Scan_Count + Index_Utiliztion_Summary.User_Lookup_Count + Index_Utiliztion_Summary.User_Update_Count) AS DECIMAL(6,3)) ASC; |
This returns all indexes ordered by the percentage of reads vs. total operations on each. This allows us to understand which indexes are used most efficiently vs. those which are potentially costing us more than they are worth:
This can be another useful metric when determining how effective an index is as we can gauge read vs. write operations and determine the best course of action, whether an index is unused or not.
One other way to view this data is to compare scan operations vs. seeks. This can allow us to understand if an index is being used frequently for queries that are scanning, rather than seeking the index. Similarly, we can check the lookup count to see if an index is resulting in bookmark lookups frequently. An index that is scanned heavily may be an indication that a common query that uses it can be optimized further or a new index that could supplement it. Excessive lookups may indicate queries that would benefit from adding include columns to the existing index.
|
1 2 3 4 5 6 7 8 9 10 11 12 |
SELECT CASE WHEN (Index_Utiliztion_Summary.User_Seek_Count + Index_Utiliztion_Summary.User_Scan_Count + Index_Utiliztion_Summary.User_Lookup_Count) = 0 THEN 0 ELSE CAST(Index_Utiliztion_Summary.User_Scan_Count * 100.00 / (Index_Utiliztion_Summary.User_Seek_Count + Index_Utiliztion_Summary.User_Scan_Count + Index_Utiliztion_Summary.User_Lookup_Count) AS DECIMAL(6,3)) END AS Percent_Scans, CASE WHEN (Index_Utiliztion_Summary.User_Seek_Count + Index_Utiliztion_Summary.User_Scan_Count + Index_Utiliztion_Summary.User_Lookup_Count) = 0 THEN 0 ELSE CAST(Index_Utiliztion_Summary.User_Lookup_Count * 100.00 / (Index_Utiliztion_Summary.User_Seek_Count + Index_Utiliztion_Summary.User_Scan_Count + Index_Utiliztion_Summary.User_Lookup_Count) AS DECIMAL(6,3)) END AS Percent_Scans, * FROM dbo.Index_Utiliztion_Summary ORDER BY Index_Utiliztion_Summary.User_Lookup_Count + Index_Utiliztion_Summary.User_Scan_Count - Index_Utiliztion_Summary.User_Seek_Count DESC; |
This query will return the percentage of all reads that are scans, as well as the percentage that are lookups:
This allows us to see indexes that might benefit from further optimization, or data points that justify the addition of new indexes. Scans on a clustered index indicate that no nonclustered index was able to satisfy a query, and therefore a new index could be a great way to speed those queries up (if needed). Our next article on missing indexes will allow us to collect far more information that can be used to justify the decision to add new indexes when we find one that is potentially missing.
Not all scans are bad. Occasionally we will have tables that are built to be fully read each time and that such a design is intentional. While rare, this scenario would be one in which we see index usage that indicates the need for indexing changes, but in reality none are required. Further research into these stats would invariably arrive at the same conclusion. A good example of this sort of behavior would be a configuration table that is read in its entirety by an application when it is started, and then not accessed again until the next time it is turned on.
An important consideration is that index usage is indicative of table usage. If all of the indexes on a table (including the clustered index) are never read, then we know that a table is not used often (if at all). Confirming that a table is unused and being able to remove it could be a beneficial way to clean up unused objects and reclaim valuable space. A table that is scanned often with few updates could also be an excellent candidate for compression. In addition, a table that is heavily scanned can be indicative of queries that SELECT *, or are pulling far more columns than they need.
In summary, when analyzing index statistics, we can learn quite a bit about our data and how it is used. This knowledge can allow us to make smart decisions about how we maintain our indexes and allow us to not pay the price of maintenance on unneeded objects.
Conclusion
Understanding index utilization allows us to track and learn about how our data is accessed and how effectively our indexes are being used to service our queries.
This data can allow us to figure out what indexes are not needed and can be dropped. In addition, these metrics can help us determine if an index is not used enough to justify its existence, or if it is not being used as effectively as we would expect it to be.
Since indexes are the primary method by which queries access our data, having an effective set of indexes that are used regularly will ensure that our read operations perform adequately and that writes are not hampered by needing to maintain an extensive list of unused indexes.
Next articles in this series:
- Collecting, aggregating, and analyzing missing SQL Server Index Stats
- SQL Server reporting – SQL Server Index Utilization Description
Downloads

In his free time, Ed enjoys video games, sci-fi & fantasy, traveling, and being as big of a geek as his friends will tolerate.
View all posts by Ed Pollack
- SQL Server Database Metrics - October 2, 2019
- Using SQL Server Database Metrics to Predict Application Problems - September 27, 2019
- SQL Injection: Detection and prevention - August 30, 2019