
Description
Indexing is key to efficient query execution. Determining what indexes are needed to satisfy production needs is often a game of cat and mouse in which we are forced to react to performance problems after they are brought to our attention. Being able to proactively monitor index needs and respond effectively before complaints are received can save us immense time while preventing costly performance messes.
This is the second part in a series that will culminate in an automated index analysis solution, allowing you to understand index usage proactively, rather than waiting for things to break in order to resolve them.
Introduction
Typically, our notice of missing indexes arrives via an end user or developer who has discovered some aspect of the application running unusually slowly. We then can trace the latency to a specific query that would benefit greatly from an index and work through the process to create, test, and implement the new index.
This process is inherently reactive and requires us to wait until someone experiences unacceptable latency in order for us to respond. As a result, we are often put into rushed situations in which we are fighting performance problems rather than creating these indexes in a proactive manner.
There are many reasons why we do not create these indexes up-front and are forced to discover their absence at a later time:
- The size of data within a table has increased greatly over time, slowing down query performance.
- The application has new queries or variants on existing queries that are not satisfied by existing indexes.
- QA efforts did not take into account production-like data, so the need for an index never came to our attention.
- Performance and scalability were not taken into account in the development process.
- The index previously existed, but we removed it previously for some reason.
For these reasons and more, we end up with performance holes and a desire to fill them as seamlessly as possible. Given the choice, we’d rather tune performance before anyone notices a problem, rather than wait for an angry user to ask why their app is slow. Therein lies the solution that will be presented in this article!
What Is a Missing Index
Whenever TSQL is executed, the query optimizer needs to generate an execution plan in order to SQL Server to know how to go about completing the request. If during this process there is an operation that would benefit greatly from an index that does not currently exist, you’ll be presented with an additional line of feedback when executed:
|
1 2 3 4 5 6 7 8 |
SELECT BusinessEntityID, FirstName, Title FROM Person.Person WHERE FirstName LIKE 'Ed%'; |
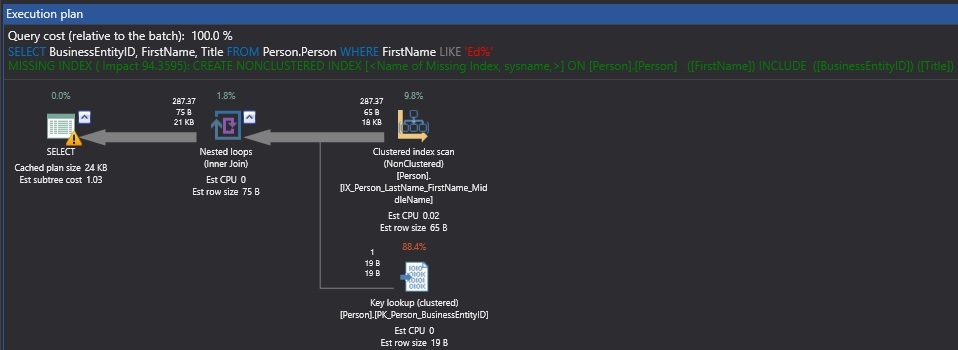
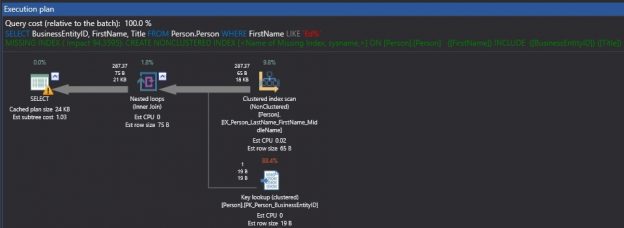
When our query executed against AdventureWorks, the execution plan, in addition to telling us how the query was executed, also provides a missing index warning, shown in green text in between the query text and the execution plan. The full text of this suggestion is as follows:
|
1 2 3 4 5 |
CREATE NONCLUSTERED INDEX [<Name of Missing Index, sysname,>] ON [Person].[Person] ([FirstName]) INCLUDE ([BusinessEntityID],[Title]); |
Based on our query and the resulting performance, SQL Server has suggested an index on FirstName with include columns on BusinessEntityID and Title.
Missing index suggestions do not require us to execute queries manually within SQL Server Management Studio. This process occurs in the background regularly, even if we are not monitoring it. SQL Server provides a handful of dynamic management views that can provide insight into suggested missing indexes:
- Sys.dm_db_missing_index_details: Provides information on the table affected, and suggested index columns.
- Sys.dm_db_missing_index_group_stats: Returns info on the query cost, number of seeks the index would have resulted in, and some other metrics to gauge effectiveness.
- Sys.dm_db_missing_index_groups: Provides an index_handle, which can be used for joining to other views.
These views are reset upon SQL Server restart and can be checked anytime in order to gauge what potential indexes SQL Server has been collecting data on. To view this data, we can run a query that joins these views together with sys.databases, which returns the database name that the index would be applicable to:
|
1 2 3 4 5 6 7 8 9 10 11 12 13 14 15 16 17 18 19 |
SELECT databases.name AS [Database_Name], dm_db_missing_index_details.statement AS Table_Name, dm_db_missing_index_details.Equality_Columns, dm_db_missing_index_details.Inequality_Columns, dm_db_missing_index_details.Included_Columns AS Include_Columns, dm_db_missing_index_group_stats.Last_User_Seek, dm_db_missing_index_group_stats.Avg_Total_User_Cost, dm_db_missing_index_group_stats.Avg_User_Impact, dm_db_missing_index_group_stats.User_Seeks FROM sys.dm_db_missing_index_groups INNER JOIN sys.dm_db_missing_index_group_stats ON dm_db_missing_index_group_stats.group_handle = dm_db_missing_index_groups.index_group_handle INNER JOIN sys.dm_db_missing_index_details ON dm_db_missing_index_groups.index_handle = dm_db_missing_index_details.index_handle INNER JOIN sys.databases ON databases.database_id = dm_db_missing_index_details.database_id; |
The output of this query shows the four indexes that have been suggested on my laptop since it was last restarted:

Included in this list is the query on Person.Person that we ran earlier, as well as a few other index suggestions on the same table, and an index relating to my baseball statistics database. A busy production server will likely have far more index suggestions, as well as a more significant volume of user seeks that could be applied to them.
From these results, we can see exactly what SQL Server was suggesting. Equality columns represent the columns in the index that would have been used for an equality operation, such as “=” or “IN”. Inequality columns are those that would have been used to support a query using operations such as “<>”, “>”, or “NOT IN”. Include columns are those that would help a query execute with minimal (or no) key lookups by maintaining additional columns for quick retrieval when needed.
Our next steps would be to evaluate each index and determine if the underlying queries are important enough to warrant implementing the new index.
Missing Index Metrics Collection
Missing index data is most useful when it is collected regularly, aggregated, and reported on. We can only make intelligent decisions in a production environment when we have a consistent set of data that spans a reasonable amount of time. We also want this data to be resilient against server restarts (planned or otherwise). If a server is shut down for maintenance, I don’t want all of my index metrics to be gone forever!
The answer to this problem is to build a process that collects missing index data and stores it in permanent tables. From here, we can report on it at our leisure and know that our data set is as complete as possible. To do this, we will build a handful of dedicated database objects to store and view this data, and a collection process that regularly populates and maintains this data. Our goal is for the process to be lightweight and resilient so that it requires as little intervention by us as possible.
To assist in collecting meaningful data, we will maintain tables of both detail and aggregate data. The detail data provides an exact copy of what is stored in the SQL Server dynamic management views. This data will be persisted for long enough that we can refer to it as needed in order to understand current missing index behavior.
The aggregate summary data will contain a running total of missing index data with a single row per index. The data in the table will be the all-time sum of all statistics. This allows us to understand how queries perform, even if a server or service is restarted. This data can lose usefulness after a major software release or other hardware/software change, and therefore it may be worthwhile to completely purge the summary data from time to time. Further aggregation or crunching of this data by week, month, quarter, or other metric is also possible, if that data would be useful.
To begin, here is our detail data table:
|
1 2 3 4 5 6 7 8 9 10 11 12 13 14 15 16 17 18 19 |
CREATE TABLE dbo.Missing_Index_Details ( Missing_Index_Details_Id INT NOT NULL IDENTITY(1,1) CONSTRAINT PK_Missing_Index_Details PRIMARY KEY CLUSTERED, Missing_Index_Details_Create_Datetime DATETIME NOT NULL, [Database_Name] SYSNAME NOT NULL, Table_Name VARCHAR(256) NOT NULL, Equality_Columns VARCHAR(MAX) NULL, Inequality_Columns VARCHAR(MAX) NULL, Include_Columns VARCHAR(MAX) NULL, Last_User_Seek DATETIME NOT NULL, Avg_Total_User_Cost FLOAT NOT NULL, Avg_User_Impact FLOAT NOT NULL, User_Seeks BIGINT NOT NULL, Index_Group_Handle INT NOT NULL, Index_Handle INT NOT NULL ); CREATE NONCLUSTERED INDEX IX_Missing_Index_Details_lastUserSeek ON dbo.Missing_Index_Details(Last_User_Seek); |
This table contains a single row per missing index per run of our process. Missing_Index_Details_Create_Datetime lets us know from what point in time this data comes from. If the data collection process runs hourly, then we will end up with 24 rows per index per day. If run daily, then we would get one row per day. The index group handle and index handle are provided solely for research purposes as they allow us to return to the underlying DMVs and view any data we’d like easily. Cleaning up this table from time to time is important, and we won’t forget to include that in our data collection process.
With a comfy place to store our detail data, we can now create a table for our aggregate data:
|
1 2 3 4 5 6 7 8 9 10 11 12 13 14 15 16 17 18 19 20 |
CREATE TABLE dbo.Missing_Index_Summary ( Missing_Index_Summary_Id INT NOT NULL IDENTITY(1,1) CONSTRAINT PK_Missing_Index_Summary PRIMARY KEY CLUSTERED, [Database_Name] SYSNAME NOT NULL, Table_Name VARCHAR(256) NOT NULL, Equality_Columns VARCHAR(MAX) NOT NULL, Inequality_Columns VARCHAR(MAX) NOT NULL, Include_Columns VARCHAR(MAX) NOT NULL, First_Index_Suggestion_Time DATETIME NOT NULL, Last_User_Seek DATETIME NOT NULL, Avg_Total_User_Cost FLOAT NOT NULL, Avg_User_Impact FLOAT NOT NULL, User_Seeks BIGINT NOT NULL, User_Seeks_Last_Update BIGINT NOT NULL ); CREATE NONCLUSTERED INDEX IX_Missing_Index_Summary_lastUserSeek ON dbo.Missing_Index_Summary(Last_User_Seek); CREATE NONCLUSTERED INDEX IX_Missing_Index_Summary_databaseName_tableName ON dbo.Missing_Index_Summary([Database_Name], Table_Name); |
This table contains a row per index. The last user seek, user cost, and user impact are whatever the most recent values were. User seeks is cumulative over time. The column User_Seeks_Last_Update will be set equal to whatever the last value that was collected. If the server is restarted, then counts will reset and knowing the last value allows us to quickly determine if that has happened or not. We could also track server restart time via server metrics or SQL Server system views, but the value check is reliable and would work under any conditions or versions of SQL Server.
The view sys.dm_db_missing_index_columns can be used in order to generate a normalized list of columns that are referenced in the index data above. This dynamic management function takes the index_handle as a parameter and returns a row per column, with some additional details. I’ve left this out of our work as we have column lists, which can easily be broken apart or read with little effort on our part.
With holding tables created, we can now create a stored procedure that collects and stores this data for us. The basic structure of the proc will be:
- Delete any detail data older than an arbitrary date (your choice).
- Determine the last seek time located in Missing_Index_Details. This helps us avoid collecting redundant data for indexes that do not see frequent change.
- Collect all missing index details newer than the time identified above and dump them to a temporary table. This allows us to populate both target tables using a single, small data set, without the need to return to the DMVs.
- Insert detail data into Missing_Index_Details.
- Merge summary data into Missing_Index_Summary by comparing the database, table, and column lists together in order to determine which indexes can and should be updated, or if a new index suggestion should be added.
|
1 2 3 4 5 6 7 8 9 10 11 12 13 14 15 16 17 18 19 20 21 22 23 24 25 26 27 28 29 30 31 32 33 34 35 36 37 38 39 40 41 42 43 44 45 46 47 48 49 50 51 52 53 54 55 56 57 58 59 60 61 62 63 64 65 66 67 68 69 70 71 72 73 74 75 76 77 78 79 80 81 82 83 84 85 86 87 88 89 90 91 92 93 94 95 96 97 98 99 100 101 102 |
CREATE PROCEDURE dbo.Populate_Missing_Index_Data @Retention_Period_for_Detail_Data_Days SMALLINT = 30, @Delete_All_Summary_Data BIT = 0 AS BEGIN SET NOCOUNT ON; DELETE Missing_Index_Details FROM dbo.Missing_Index_Details WHERE Missing_Index_Details.Last_User_Seek < DATEADD(DAY, -1 * @Retention_Period_for_Detail_Data_Days, CURRENT_TIMESTAMP); IF @Delete_All_Summary_Data = 1 BEGIN TRUNCATE TABLE dbo.Missing_Index_Summary; END DECLARE @Last_Seek_Time DATETIME; SELECT @Last_Seek_Time = MAX(Missing_Index_Details.Last_User_Seek) FROM dbo.Missing_Index_Details; IF @Last_Seek_Time IS NULL BEGIN SELECT @Last_Seek_Time = DATEADD(WEEK, -1, CURRENT_TIMESTAMP); END SELECT databases.name AS [Database_Name], dm_db_missing_index_details.statement AS Table_Name, dm_db_missing_index_details.Equality_Columns, dm_db_missing_index_details.Inequality_Columns, dm_db_missing_index_details.Included_Columns AS Include_Columns, dm_db_missing_index_group_stats.Last_User_Seek, dm_db_missing_index_group_stats.Avg_Total_User_Cost, dm_db_missing_index_group_stats.Avg_User_Impact, dm_db_missing_index_group_stats.User_Seeks, dm_db_missing_index_groups.Index_Group_Handle, dm_db_missing_index_groups.Index_Handle INTO #Missing_Index_Details FROM sys.dm_db_missing_index_groups INNER JOIN sys.dm_db_missing_index_group_stats ON dm_db_missing_index_group_stats.group_handle = dm_db_missing_index_groups.index_group_handle INNER JOIN sys.dm_db_missing_index_details ON dm_db_missing_index_groups.index_handle = dm_db_missing_index_details.index_handle INNER JOIN sys.databases ON databases.database_id = dm_db_missing_index_details.database_id WHERE dm_db_missing_index_group_stats.Last_User_Seek > @Last_Seek_Time; INSERT INTO dbo.Missing_Index_Details (Missing_Index_Details_Create_Datetime, [Database_Name], Table_Name, Equality_Columns, Inequality_Columns, Include_Columns, Last_User_Seek, Avg_Total_User_Cost, Avg_User_Impact, User_Seeks, Index_Group_Handle, Index_Handle) SELECT CURRENT_TIMESTAMP AS Missing_Index_Details_Create_Datetime, [Database_Name], Table_Name, Equality_Columns, Inequality_Columns, Include_Columns, Last_User_Seek, Avg_Total_User_Cost, Avg_User_Impact, User_Seeks, Index_Group_Handle, Index_Handle FROM #Missing_Index_Details; MERGE INTO dbo.Missing_Index_Summary AS Index_Summary_Target USING (SELECT [Database_Name], Table_Name, ISNULL(Equality_Columns, '') AS Equality_Columns, ISNULL(Inequality_Columns, '') AS Inequality_Columns, ISNULL(Include_Columns, '') AS Include_Columns, MAX(Last_User_Seek) AS Last_User_Seek, AVG(Avg_Total_User_Cost) AS Avg_Total_User_Cost, AVG(Avg_User_Impact) AS Avg_User_Impact, SUM(User_Seeks) AS User_Seeks FROM #Missing_Index_Details GROUP BY [Database_Name], Table_Name, Equality_Columns, Inequality_Columns, Include_Columns) AS Index_Summary_Source ON (Index_Summary_Source.Database_Name = Index_Summary_Target.Database_Name AND Index_Summary_Source.Table_Name = Index_Summary_Target.Table_Name AND Index_Summary_Source.Equality_Columns = Index_Summary_Target.Equality_Columns AND Index_Summary_Source.Inequality_Columns = Index_Summary_Target.Inequality_Columns AND Index_Summary_Source.Include_Columns = Index_Summary_Target.Include_Columns) WHEN MATCHED THEN UPDATE SET Last_User_Seek = Index_Summary_Source.Last_User_Seek, User_Seeks = CASE WHEN Index_Summary_Source.User_Seeks = Index_Summary_Target.User_Seeks_Last_Update THEN Index_Summary_Target.User_Seeks WHEN Index_Summary_Source.User_Seeks >= Index_Summary_Target.User_Seeks THEN Index_Summary_Source.User_Seeks + Index_Summary_Target.User_Seeks - Index_Summary_Target.User_Seeks_Last_Update WHEN Index_Summary_Source.User_Seeks < Index_Summary_Target.User_Seeks AND Index_Summary_Source.User_Seeks < Index_Summary_Target.User_Seeks_Last_Update THEN Index_Summary_Target.User_Seeks + Index_Summary_Source.User_Seeks WHEN Index_Summary_Source.User_Seeks < Index_Summary_Target.User_Seeks AND Index_Summary_Source.User_Seeks > Index_Summary_Target.User_Seeks_Last_Update THEN Index_Summary_Source.User_Seeks + Index_Summary_Target.User_Seeks - Index_Summary_Target.User_Seeks_Last_Update END, User_Seeks_Last_Update = Index_Summary_Source.User_Seeks, Avg_Total_User_Cost = Index_Summary_Source.Avg_Total_User_Cost, Avg_User_Impact = Index_Summary_Source.Avg_User_Impact WHEN NOT MATCHED BY TARGET THEN INSERT VALUES (Index_Summary_Source.[Database_Name], Index_Summary_Source.Table_Name, Index_Summary_Source.Equality_Columns, Index_Summary_Source.Inequality_Columns, Index_Summary_Source.Include_Columns, CURRENT_TIMESTAMP, Index_Summary_Source.Last_User_Seek, Index_Summary_Source.Avg_Total_User_Cost, Index_Summary_Source.Avg_User_Impact, Index_Summary_Source.User_Seeks, Index_Summary_Source.User_Seeks); DROP TABLE #Missing_Index_Details; END |
Two optional parameters are provided that allow for the maintenance of existing data:
- @Retention_Period_for_Detail_Data_Days indicates how many days of detail data to retain. The default is 30 days, but you can enter whatever is appropriate for your needs. The correct value is how far back you expect to need to look at point-in-time measurements.
- @Delete_All_Summary_Data: When set to 1, the Missing_Index_Summary table is truncated. This may be useful if you’d like to begin collecting summary data anew due to there being very old data that is now irrelevant. Alternatively, we could trim the table of unneeded data ourselves, but I’d prefer an automated process to have as little manual intervention as possible
With our collection stored procedure in place, let’s execute it and review the results:
|
1 2 3 |
EXEC dbo.Populate_Missing_Index_Data @Retention_Period_for_Detail_Data_Days = 180, @Delete_All_Summary_Data = 0; |
This completes relatively quickly, allowing us to query the 2 missing index tables directly:
|
1 2 3 4 5 6 7 8 |
SELECT * FROM dbo.Missing_Index_Details; SELECT * FROM dbo.Missing_Index_Summary; |
Our data looks like this:
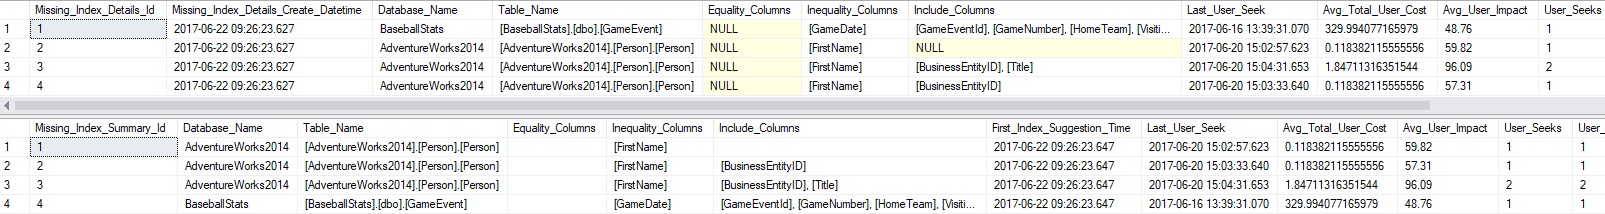
Our data shows a total of 4 current index suggestions, three on AdventureWorks, and one on my BaseballStats database. As of right now, the summary and detail data are the same, as we have only run this process once, and I’ve not executed any additional queries since creating the process.
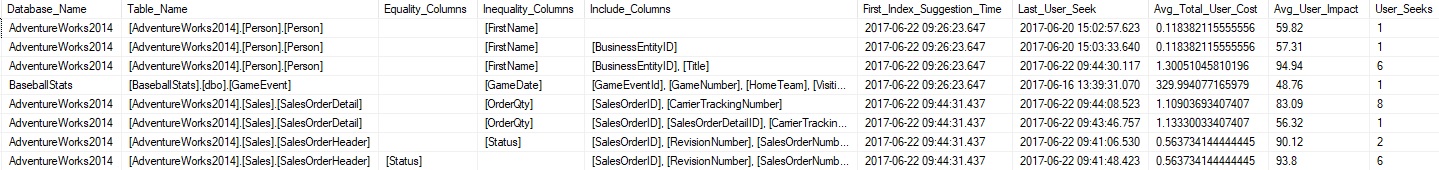
To provide a more interesting view, I’ll execute a variety of queries on AdventureWorks in order to cause some more missing index suggestions to be generated, including our test query from earlier. Once complete, we can execute the missing index collection proc and review the results. Here is the detail data that exists now:
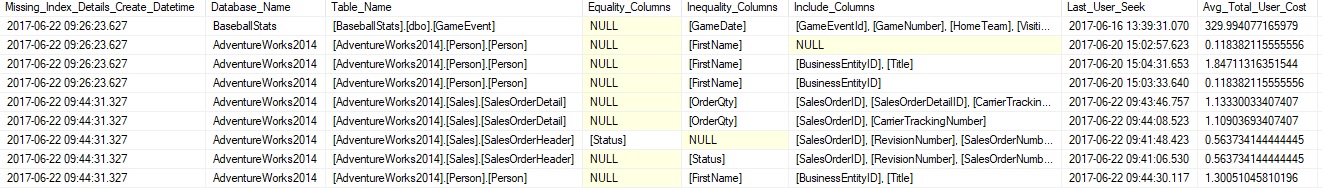
We can see that five rows were added to the table. Any older queries that have not had any executions since the last run of our process are NOT included in the new data. This helps avoid redundant data, as well as save some space wherever this is being stored. This also allows us to easily query our data set for all missing indexes with a last seek time after a given point in time, and not get an excessively large data set returned to us.
If maintaining a point-in-time to all detail data, including duplicate data, is important to you, then alter the stored procedure to remove the filter on “Last_User_Seek > @Last_Seek_Time”. This will allow each capture of detail data to include ALL suggested indexes, even if there is no new data to view on them.
Now, let’s check the summary data for an aggregate view of our data:
Here we can see all 8 index suggestions since our process was created and initially executed. Missing indexes that have experienced additional seeks, such as the 3rd query against Person.Person have had their last user seek time updated, as well as total user seeks. New missing indexes have been added to the table and will be updated going forward, as needed. The column First_Index_Suggestion_Time allows us to understand when an index was first suggested, helping us gauge how long a problem may have existed. Last_User_Seek tells us when the last time was that this index was suggested.
There is some data that is missing from our tables that would be handy to have for analysis or implementation:
- An index creation statement for the suggested index.
- Counts of equality, inequality, and include columns.
- An improvement measure that helps us better understand how useful an index would be.
These can all be extrapolated from existing data, so they are ideal candidates for inclusion in views that access our data:
|
1 2 3 4 5 6 7 8 9 10 11 12 13 14 15 16 17 18 19 20 21 22 23 24 25 26 27 28 29 30 31 32 33 34 35 36 37 38 39 40 41 42 43 44 45 46 47 48 49 50 51 52 53 54 55 56 57 |
CREATE VIEW dbo.v_Missing_Index_Details AS SELECT Missing_Index_Details_Create_Datetime, [Database_Name], REVERSE(SUBSTRING(REVERSE(Missing_Index_Details.Table_Name), 2, (CHARINDEX('[', REVERSE(Missing_Index_Details.Table_Name), 2)) - 2)) AS Table_Name, 'CREATE NONCLUSTERED INDEX [missing_index_' + CONVERT (VARCHAR, Missing_Index_Details.Index_Group_Handle) + '_' + CONVERT (VARCHAR, Missing_Index_Details.Index_Handle) + '_' + LEFT(PARSENAME(REVERSE(SUBSTRING(REVERSE(Missing_Index_Details.Table_Name), 2, (CHARINDEX('[', REVERSE(Missing_Index_Details.Table_Name), 2)) - 2)), 1), 32) + ']' + ' ON ' + REVERSE(SUBSTRING(REVERSE(Missing_Index_Details.Table_Name), 2, (CHARINDEX('[', REVERSE(Missing_Index_Details.Table_Name), 2)) - 2)) + ' (' + ISNULL(Missing_Index_Details.Equality_Columns, '') + CASE WHEN Missing_Index_Details.Equality_Columns IS NOT NULL AND Missing_Index_Details.Inequality_Columns IS NOT NULL THEN ',' ELSE '' END + ISNULL(Missing_Index_Details.Inequality_Columns, '') + ')' + ISNULL(' INCLUDE (' + Missing_Index_Details.Include_Columns + ')', '') AS Index_Creation_Statement, Missing_Index_Details.Avg_Total_User_Cost * (Missing_Index_Details.Avg_User_Impact / 100.0) * Missing_Index_Details.User_Seeks AS Improvement_Measure, Equality_Columns, Inequality_Columns, Include_Columns, ISNULL(LEN(Missing_Index_Details.Equality_Columns) - LEN(REPLACE(Missing_Index_Details.Equality_Columns, '[', '')), 0) AS Equality_Column_Count, ISNULL(LEN(Missing_Index_Details.Inequality_Columns) - LEN(REPLACE(Missing_Index_Details.Inequality_Columns, '[', '')), 0) AS Inequality_Column_Count, ISNULL(LEN(Missing_Index_Details.Include_Columns) - LEN(REPLACE(Missing_Index_Details.Include_Columns, '[', '')), 0) AS Included_Column_Count, Last_User_Seek, User_Seeks, Index_Group_Handle, Index_Handle FROM dbo.Missing_Index_Details; GO CREATE VIEW dbo.v_Missing_Index_Summary AS SELECT [Database_Name], REVERSE(SUBSTRING(REVERSE(Missing_Index_Summary.Table_Name), 2, (CHARINDEX('[', REVERSE(Missing_Index_Summary.Table_Name), 2)) - 2)) AS Table_Name, 'CREATE NONCLUSTERED INDEX [missing_index_' + CONVERT (VARCHAR, Missing_Index_Summary.Missing_Index_Summary_Id) + '_' + LEFT(PARSENAME(REVERSE(SUBSTRING(REVERSE(Missing_Index_Summary.Table_Name), 2, (CHARINDEX('[', REVERSE(Missing_Index_Summary.Table_Name), 2)) - 2)), 1), 32) + ']' + ' ON ' + REVERSE(SUBSTRING(REVERSE(Missing_Index_Summary.Table_Name), 2, (CHARINDEX('[', REVERSE(Missing_Index_Summary.Table_Name), 2)) - 2)) + ' (' + Missing_Index_Summary.Equality_Columns + CASE WHEN Missing_Index_Summary.Equality_Columns <> '' AND Missing_Index_Summary.Inequality_Columns <> '' THEN ',' ELSE '' END + ISNULL(Missing_Index_Summary.Inequality_Columns, '') + ')' + CASE WHEN Missing_Index_Summary.Include_Columns = '' THEN '' ELSE ' INCLUDE (' + Missing_Index_Summary.Include_Columns + ')' END AS Index_Creation_Statement, Missing_Index_Summary.Avg_Total_User_Cost * (Missing_Index_Summary.Avg_User_Impact / 100.0) * Missing_Index_Summary.User_Seeks AS Improvement_Measure, Missing_Index_Summary.Equality_Columns, Missing_Index_Summary.Inequality_Columns, Missing_Index_Summary.Include_Columns, ISNULL(LEN(Missing_Index_Summary.Equality_Columns) - LEN(REPLACE(Missing_Index_Summary.Equality_Columns, '[', '')), 0) AS Equality_Column_Count, ISNULL(LEN(Missing_Index_Summary.Inequality_Columns) - LEN(REPLACE(Missing_Index_Summary.Inequality_Columns, '[', '')), 0) AS Inequality_Column_Count, ISNULL(LEN(Missing_Index_Summary.Include_Columns) - LEN(REPLACE(Missing_Index_Summary.Include_Columns, '[', '')), 0) AS Included_Column_Count, Missing_Index_Summary.First_Index_Suggestion_Time, Missing_Index_Summary.Last_User_Seek, Missing_Index_Summary.User_Seeks FROM dbo.Missing_Index_Summary; GO |
When we select data from either view, 5 additional columns are added that provide the columns mentioned above. Here is what the summary view looks like now:
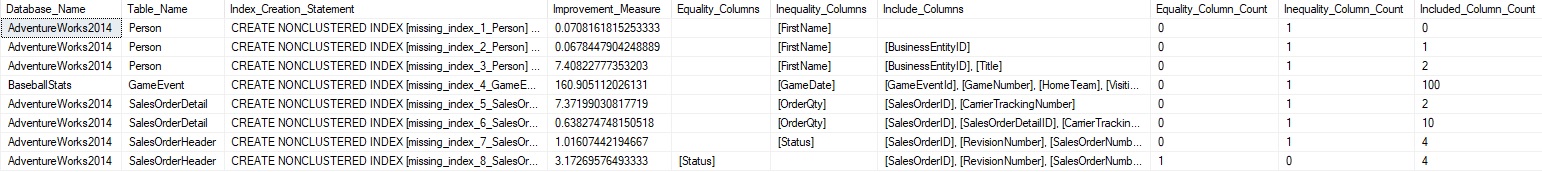
The index creation statement provides a basis for what we could run in order to actually implement the suggested index:
CREATE NONCLUSTERED INDEX [missing_index_8_SalesOrderHeader] ON SalesOrderHeader ([Status]) INCLUDE ([SalesOrderID], [RevisionNumber], [SalesOrderNumber], [CustomerID])
While we should certainly rename the index to something meaningful, the remainder of the statement is accurate, assuming that you’d like to include all of the suggested columns. The column counts can be useful when determining how large or complex an index is. Adding an index on one column is not a difficult decision, whereas adding an index on 25 columns would be comparatively expensive!
Lastly, the improvement measure is the product of the average total user cost of the query, the average user impact, and the total user seeks by the query. This measure allows us to assess a measure of query cost, execution frequency, and the impact of the index itself. This is by no means a perfect measure, but it is one way to filter and sort missing indexes in a helpful fashion.
The last step in our process would be to create a SQL Server Agent job, or some other process that calls the missing index stored procedure on a semi-regular basis. If your server doesn’t restart often, then daily is likely acceptable. If software releases occur at specific times, then having the job run immediately afterwards could be a useful way to pinpoint the appearance of new queries that are missing indexes. For more granularity, feel free to schedule hourly, or every N hours, based on your needs. All of the queries in this article are lightweight and will not impact any user data, as they read from system views only.
With a process that regularly collects missing index data, we can periodically check on it, report against it, and use those results to make smart indexing decisions to keep queries executing fast!
Caution Against Too Many Indexes
Indexing is an area in which too much of a good thing is not good. Indexes improve read speeds for the queries they cover, but slow down writes on those columns. Any insert, delete, or update that touches columns in an index will also need to update the index with whatever change was made. A table with 10 indexes will require changes to any or all of them when the table is written to. Wide indexes also require more effort to maintain than narrow indexes. In addition, each index consumes valuable disk space.
Our goal when indexing our tables is to cover all of our most frequent/important queries as effectively as possible while not adding indexes unless they are truly needed. Adding every index suggestion that SQL Server provides will eventually result in our tables being large, bloated, and slow to write to. Index maintenance would also take an excessive amount of time. Given these facts, how do we choose which index suggestions to add or ignore? Here are some guidelines that can help when making these decisions:
- How often is a query executed? If it’s a one-off report that will never run again, then an index is probably a waste of time. If it is an important piece of app code that runs a million times a day, then making sure it runs efficiently is probably worth the effort.
- How expensive is a query? Are you scanning a table of a billion rows or are you scanning a table of 5? If the index would reduce logical reads from 10 million to 10, then it’s likely a useful one to consider!
- Do any similar indexes already exist? If so, consider ways to combine them into one. If all that is needed is an additional include column to allow the existing index to cover the new query, then that effort is likely worth it.
- How long does the query take to execute? If a query is getting slow enough so as to be problematic for the end user, then an index to speed it up may be necessary. If an index would reduce runtime from 10ms to 8ms, then it might not be needed. If a query used to be fast and is getting slower over time, then this is your chance to get in front of a performance problem and proactively fix it, before anyone else notices a latency issue!
Note that many of these suggestions involve performing additional research on the query that resulted in the index suggestion. This information can be gathered from the query plan cache, as well as from 3rd party monitoring tools. Additionally, solid knowledge of an application may make it easy to find areas in which queries are performing poorly and resulting in common index suggestions. To make an intelligent decision about whether an index should be added requires understanding the queries that it would cover. Only then can we be sure it’s the correct choice.
Conclusion
Collecting, aggregating, and storing data on missing indexes from SQL Server’s dynamic management views allows us to keep track of new indexes that we should consider adding. Trending this data over time and keeping an extra close eye on it after any major software releases or events will allow us to be proactive in resolving performance issues before they become serious.
In the last article in this series, we will take index usage stats and missing index stats and create a data structure that allows us to combine all index suggestions into a single set of recommendations that are updated regularly. The result of this work will be a data set that can be used for monitoring, alerting, and reporting on index effectiveness with the desire to make indexing a proactive science, rather than a reactive frenzy to user complaints.
Other articles in this series:
- SQL Server Index Performance Tuning Using Built-in Index Utilization Metrics
- SQL Server reporting – SQL Server Index Utilization Description
Downloads

In his free time, Ed enjoys video games, sci-fi & fantasy, traveling, and being as big of a geek as his friends will tolerate.
View all posts by Ed Pollack
- SQL Server Database Metrics - October 2, 2019
- Using SQL Server Database Metrics to Predict Application Problems - September 27, 2019
- SQL Injection: Detection and prevention - August 30, 2019