
Summary
Database metrics can be collected, maintained, and used to help predict when processes go awry so problems can be resolved before they become severe. Understanding when an application or process misbehaves is not always easy. We are often left waiting until a server, application, or service breaks or enters an undesirable state before we know something is wrong. At that point, we are forced to rush and resolve a production problem quickly, before its impact becomes severe.
The better we understand our data, the more we can predict data-driven application problems before they occur. By examining database metrics such as row counts, disk IO, and memory usage, we can determine if resource consumption has become unusually high. When this occurs, we can use the data to quickly pinpoint its cause.
What problems can we catch?
Once we analyze the metrics, we can discover many common problems as soon as they manifest and before they cause major application problems. Essentially, our ultimate goal is to catch a bug before it translates into downtime or the need for a significant response.
Data archival/cleanup omissions
When we build new tables, we should ask, “How will we maintain this data?” Often, we build tables that should only retain days, weeks, or maybe months of data. This is common for monitoring, tracking, auditing, and logging.
If we build a fast-growing table that needs a data retention policy and forget to include it, the table will grow indefinitely. Eventually, it is likely that its size will become a performance hazard. If we catch a specific table growing quickly beyond what we expect, then we can act before we hit performance or resource limitations.
Bad/excessive data
A software or script bug can result in more data being generated than expected. Similar bugs can also result in bad data that does not get handled correctly via the application’s business logic.
Tracking row counts can quickly catch these issues as we search for tables that are growing faster than anticipated.
Inconsistent data growth
If a database or application is broken into subsets, then we could compare data growth and utilization for each one to see if there are anomalies or outliers.
By measuring detailed database metrics for each subset of customers, users, or entities, we can track problems that may be invisible in aggregate but become obvious when we break the problem into smaller pieces.
Latency & performance problems
High waits, blocking, locking, or deadlocking can all be symptoms of poorly written queries. Perhaps an application ran efficiently in a small development environment but is slowing down as the dataset gets larger and more complex.
Nearly any metrics we capture can help us find these issues. The problem may be as simple as a missing index or poorly-written query. Our goal is to find those mistakes before they manifest as bug reports and application complaints/outages.
Much more
Every application is different and the data we collect, store, maintain, and report on can vary widely. The server and database metrics that are most meaningful to you may be similar or very different from what we have discussed here. Generally, the space and resources needed to collect and monitor metrics are low-overhead, so when in doubt, monitor more! Unneeded database metrics can be easily removed later, whereas the useful ones will quickly become valuable and worth the resources used to collect them.
Trending data
To truly be able to use database metrics for predictive analysis, we need to collect, retain, and trend data over time. It is not enough to store a day’s worth of data or to monitor/alert when we are in trouble, but to maintain historical data for years. This volume of data allows us to capacity plan, detect anomalies, and otherwise locate bad trends before they become destructive.
These trends are especially important when we introduce change via software releases, maintenance, or hardware changes. The most likely time for software to break will be when we introduce change, so this provides an opportunity for us to identify problems based on abnormal data use.
Row count trending
The following script will create a table to store this data and create a simple stored procedure that collects row count data from all user databases and places it into the table:
|
1 2 3 4 5 6 7 8 9 10 11 12 13 14 15 16 17 18 19 20 21 22 23 24 25 26 27 28 29 30 31 32 33 34 35 36 37 38 39 40 41 42 43 44 45 46 47 48 49 50 51 52 53 54 55 56 57 58 59 |
IF NOT EXISTS (SELECT * FROM sys.tables WHERE tables.name = 'row_count_historical') BEGIN CREATE TABLE dbo.row_count_historical ( row_count_historical_id INT NOT NULL IDENTITY(1,1) CONSTRAINT PK_row_count_historical PRIMARY KEY CLUSTERED, sample_date_utc DATE NOT NULL, databasename VARCHAR(128) NOT NULL, schemaname VARCHAR(128) NOT NULL, table_name VARCHAR(128) NOT NULL, row_count BIGINT NOT NULL) WITH (DATA_COMPRESSION = PAGE); END GO IF EXISTS (SELECT * FROM sys.procedures WHERE procedures.name = 'collect_row_count_metrics') BEGIN DROP PROCEDURE dbo.collect_row_count_metrics; END GO CREATE PROCEDURE dbo.collect_row_count_metrics AS BEGIN SET NOCOUNT ON; DECLARE @current_date_utc DATE = CAST(SYSUTCDATETIME() AS DATE); DELETE row_count_historical FROM dbo.row_count_historical WHERE row_count_historical.sample_date_utc = @current_date_utc; DECLARE @sql_command NVARCHAR(MAX) = 'DECLARE @current_date_utc_local DATE = CAST(SYSUTCDATETIME() AS DATE);'; SELECT @sql_command = @sql_command + ' INSERT INTO dbo.row_count_historical (sample_date_utc, databasename, schemaname, table_name, row_count) SELECT @current_date_utc_local AS sample_date_utc, ''' + databases.name + ''' AS databasename, schemas.name AS schemaname, objects.name AS table_name, dm_db_partition_stats.row_count FROM sys.dm_db_partition_stats INNER JOIN sys.objects ON objects.object_id = dm_db_partition_stats.object_id INNER JOIN sys.schemas ON schemas.schema_id = objects.schema_id WHERE objects.is_ms_shipped = 0 AND objects.type_desc = ''USER_TABLE'' AND dm_db_partition_stats.index_id IN (0,1);' FROM sys.databases WHERE databases.name NOT IN ('TempDB', 'model', 'msdb', 'master'); EXEC sp_executesql @sql_command; END GO EXEC dbo.collect_row_count_metrics; SELECT * FROM dbo.row_count_historical; GO |
Note that I did not include indexed views. If this is a useful addition, feel free to add some code to check the object type and/or join to sys.tables and sys.views for more information. If storage savings is important, you can normalize the database, schema, and table name into TINYINT, SMALLINT, or INT columns (depending on schema volume). The table has page compression applied, since a reporting table like this is the perfect candidate for compression as it is write-once, read-often data. System databases and tables are excluded, but feel free to adjust this filter if you have an interest in any of them. Lastly, I re-declared the UTC date within the dynamic SQL to reduce the amount of string splicing I had to do. This is a style consideration, but I personally prefer to splice less and declare variables within dynamic SQL when possible.
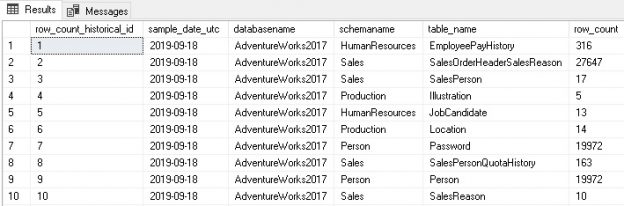
When executed, the table and stored procedure are created, and the proc is executed. The results of the SELECT from the table look like this:
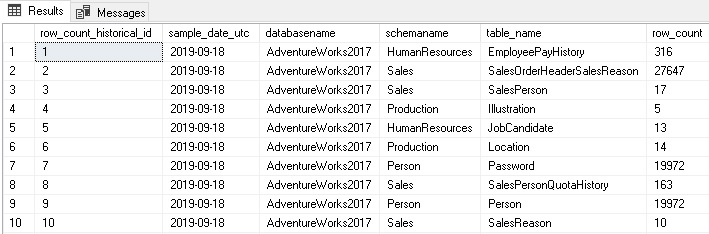
The results show a row per object per day across all databases. If run daily, we can build up a historical set of data that allows us to trend growth and application behavior over time. We can look at row counts over the past week for all tables and compare today’s numbers to yesterday’s, 3 days ago, a week ago, a month ago, etc. Over time we can refine a model that describes normal vs. abnormal data growth effectively.
For example, in this data we determine that sales orders grew at a rate of about 10,000 orders a day. Anything under 1,000 is exceptionally abnormal/bad and anything over 10,000 is also suspect. This is useful, but very specific. A more generic approach would be to say that any table that grows by more than 10% for three days straight should be investigated. Assumptions like this are likely to trigger false positives on occasion but require far less manual intervention up front. This approach would lend itself towards creating exceptions after-the-fact to eliminate them and improve alerting quality.
One additional note: If you are pulling data from an environment where there are many tables in many databases, the storage size of this can get unwieldy! For example, if you had 1,000 databases with 1,000 tables each, then you would get one million rows a day. Here are some suggestions to tame large row count data volume:
- Remove all tables with less than N rows of data. This may be 5 or 10 or 100, but this helps eliminate lookup tables or those with an inconsequential amount of data. The downside to this decision is that we lose insight into these tables
- Only add a row to the trending table when the row count on a table changes. When populating the table, left join to the previous day’s data and compare the new vs. old row counts. If they differ (or a new row has appeared), then include it. This compresses data greatly while not losing insight, though querying the table becomes a bit more complex. For this option, consider an is_current BIT that allows you to quickly pull the current values across your environment
- Only store tables of interest. If you know that there is only a small set of tables that matter, then filter to include only them. The maintenance here is to check periodically to either add new tables or revisit old ones if their application usage patterns change
I/O stats
We can approach I/O file stats very similarly to how we handled row counts above: Regularly collect data, store it in a reporting table, and then run analytics against it as needed. Since these database metrics are reset when SQL Server services restart, we need to collect a bit more often. We’ll also want to collect often enough to be able to correlate changes to ongoing application activity. Hourly is typically an acceptable collection frequency, but your environment may lend itself to the more frequent or less frequent collection.
Since pulling IO stats does not require iterating through databases, we can collect data quickly and easily, without the need for dynamic SQL:
|
1 2 3 4 5 6 7 8 9 10 11 12 13 14 15 16 17 18 19 20 21 22 23 24 25 26 27 28 29 30 31 32 33 34 35 36 37 38 39 40 41 42 43 44 45 46 47 48 49 50 51 52 53 54 |
IF NOT EXISTS (SELECT * FROM sys.tables WHERE tables.name = 'io_virtual_file_stats_historical') BEGIN CREATE TABLE dbo.io_virtual_file_stats_historical ( io_virtual_file_stats_historical_id INT NOT NULL IDENTITY(1,1) CONSTRAINT PK_io_virtual_file_stats_historical PRIMARY KEY CLUSTERED, sample_time_utc DATETIME2(0) NOT NULL, databasename VARCHAR(128) NOT NULL, database_filename NVARCHAR(128) NOT NULL, file_type VARCHAR(60) NOT NULL, physical_name NVARCHAR(260) NOT NULL, number_of_reads INT NOT NULL, number_of_bytes_read BIGINT NOT NULL, number_of_writes INT NOT NULL, number_of_bytes_written BIGINT NOT NULL) WITH (DATA_COMPRESSION = PAGE); END GO IF EXISTS (SELECT * FROM sys.procedures WHERE procedures.name = 'collect_io_virtual_file_stats_metrics') BEGIN DROP PROCEDURE dbo.collect_io_virtual_file_stats_metrics; END GO CREATE PROCEDURE dbo.collect_io_virtual_file_stats_metrics AS BEGIN SET NOCOUNT ON; DECLARE @current_time_utc DATE = CAST(SYSUTCDATETIME() AS DATETIME2(0)); INSERT INTO dbo.io_virtual_file_stats_historical (sample_time_utc, databasename, database_filename, file_type, physical_name, number_of_reads, number_of_bytes_read, number_of_writes, number_of_bytes_written) SELECT @current_time_utc AS sample_time_utc, databases.name AS DatabaseName, master_files.name AS DatabaseFileName, master_files.type_desc AS FileType, master_files.physical_name, dm_io_virtual_file_stats.num_of_reads, dm_io_virtual_file_stats.num_of_bytes_read, dm_io_virtual_file_stats.num_of_writes, dm_io_virtual_file_stats.num_of_bytes_written FROM sys.master_files INNER JOIN sys.dm_io_virtual_file_stats(NULL, NULL) ON master_files.database_id = dm_io_virtual_file_stats.database_id INNER JOIN sys.databases ON databases.database_id = master_files.database_id AND master_files.file_id = dm_io_virtual_file_stats.file_id; END GO EXEC dbo.collect_io_virtual_file_stats_metrics; SELECT * FROM dbo.io_virtual_file_stats_historical; GO |
This script creates a table to store data and creates a stored proc that deposits IO stats numbers into the table. The results are a point-in-time for I/O when executed:
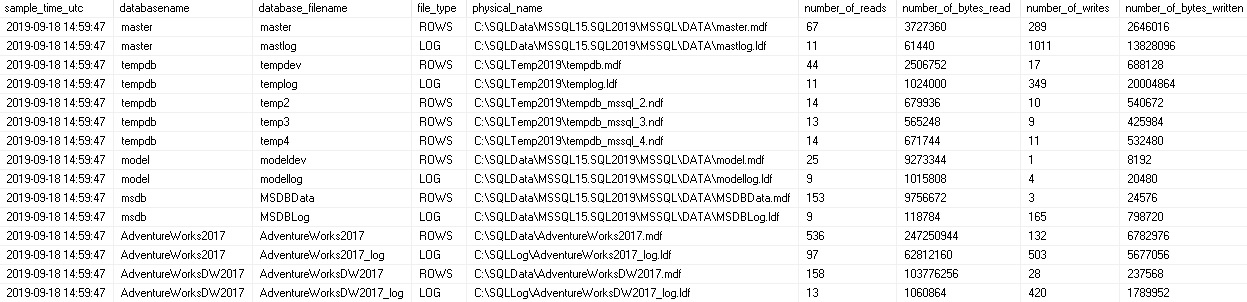
Note that if the SQL Server restarts, the numbers in this table will also reset to zero. When reporting off of this data, you’ll likely want to join back to the preceding data sample to check and see if the new values are smaller than the previous values. If so, then we know that a restart occurred, and the dynamic management view was zeroed out.
With this data in hand, we can quantify the volume of data written and read to each database file during specific time periods, as well as to measure throughput over time. This allows us to better plan storage needs, as well as identify times when I/O is heavy, light, or anomalously high. If the amount of I/O currently experienced by the sum total of data files on a disk is approaching or exceeding its capacity, then we can expect performance problems related to that bottleneck.
Unusually high I/O can be correlated to other events and help us to pinpoint the general location of an application issue. Since I/O can occur without inserting or deleting rows, this can help fill in the blanks for update and select operations.
Extending the methodology
The stored procedures created above display a distinct pattern:
- Create a permanent table to store trending data
- Create a stored procedure that pulls a point-in-time snapshot of a specific metric
- Retain data points over time for trending
- Alert/monitor on suboptimal conditions that can predict application or capacity problems
Data like this is extremely useful! It provides value that grows over time as our data grows. We have great flexibility in how often we take samples, the details of what columns we retain, and how we consume this data.
The process shown here for row counts and I/O stats can easily be extended to backups, waits, deadlocks, and more. Pick a metric that is measurable, sample it, store it, use it.
While data can be subject to a retention period, I have always been hesitant to remove it unless it truly is old, and we are certain to never use it again. It is challenging to determine when database metrics are no longer relevant and most measures that we have discussed are compact enough that storing years of data will not be disruptive. Wait stats, deadlocks, and other long-text metrics can get big, but these are specific details we can compress, truncate, or remove over time to ensure that space usage doesn’t get out of hand (if needed). In general, metrics should be retained for as long as we would perform any other reporting on related data points, such as application bugs, usage, and history.
Combining database metrics
We can correlate any of these data points to other metrics. Does a spike in writes correlate to a significant increase in rows in a given table? Do waits spike during a period of time when reads are especially high? By combining metrics, we can paint a clearer picture of database performance and more quickly isolate a problem.
Consider collecting multiple metrics and using them in tandem to find problems early. Once an application issue is found, use these and other database metrics to diagnose the problem and be able to offer up the best possible solution from the database perspective.
Conclusion
Database metrics may seem to most people to be academic in nature, providing the ability for us to capacity plan or budget for future hardware or cloud resources, but in reality, we can use this data to locate, diagnose, and solve application problems. This is exceptionally valuable and can prevent downtime, bug reports, and latency that could be disruptive to your organization. Whenever given the option, it’s far better to solve a problem on your terms than to be rushed and reactive when something breaks in the future.
How do you use database metrics like these? Do you have any creative ways to turn database metadata and performance metrics into real-world solutions?

In his free time, Ed enjoys video games, sci-fi & fantasy, traveling, and being as big of a geek as his friends will tolerate.
View all posts by Ed Pollack
- SQL Server Database Metrics - October 2, 2019
- Using SQL Server Database Metrics to Predict Application Problems - September 27, 2019
- SQL Injection: Detection and prevention - August 30, 2019