

A SQL index is used to retrieve data from a database very fast. Indexing a table or view is, without a doubt, one of the best ways to improve the performance of queries and applications.
A SQL index is a quick lookup table for finding records users need to search frequently. An index is small, fast, and optimized for quick lookups. It is very useful for connecting the relational tables and searching large tables.
SQL indexes are primarily a performance tool, so they really apply if a database gets large. SQL Server supports several types of indexes but one of the most common types is the clustered index. This type of index is automatically created with a primary key. To make the point clear, the following example creates a table that has a primary key on the column “EmployeeId”:
|
1 2 3 4 5 6 7 |
CREATE TABLE dbo.EmployeePhoto (EmployeeId INT NOT NULL PRIMARY KEY, Photo VARBINARY(MAX) NULL, MyRowGuidColumn UNIQUEIDENTIFIER NOT NULL ROWGUIDCOL UNIQUE DEFAULT NEWID() ); |
You’ll notice in the create table definition for the “EmployeePhoto” table, the primary key at the end of “EmployeeId” column definition. This creates a SQL index that is specially optimized to get used a lot. When the query is executed, SQL Server will automatically create a clustered index on the specified column and we can verify this from Object Explorer if we navigate to the newly created table, and then the Indexes folder:
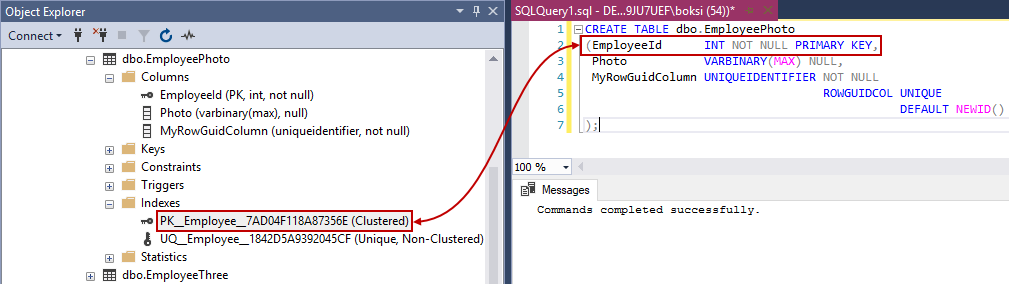
Notice that not only creating a primary key creates a unique SQL index. The unique constraint does the same on the specified columns. Therefore, we got one additional unique index for the “MyRowGuidColumn” column. There are no remarkable differences between the unique constraint and a unique index independent of a constraint. Data validation happens in the same manner and the query optimizer does not differentiate between a unique SQL index created by a constraint or manually created. However, a unique or primary key constraint should be created on the column when data integrity is the objective because by doing so the objective of the index will be clear.
Note: The detailed explanation of each type of these SQL indexes can be found in the following article: How to create and optimize SQL Server indexes for better performance
So, if we use a lot of joins on the newly created table, SQL Server can lookup indexes quickly and easily instead of searching sequentially through potentially a large table.
SQL indexes are fast partly because they don’t have to carry all the data for each row in the table, just the data that we’re looking for. This makes it easy for the operating system to cache a lot of indexes into memory for faster access and for the file system to read a huge number of records simultaneously rather than reading them from the disk.
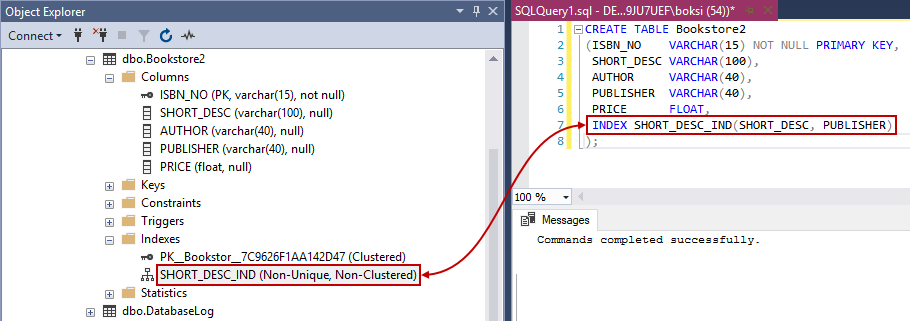
Additional indexes can be created by using the Index keyword in the table definition. This can be useful when there is more than one column in the table that will be searched often. The following example creates indexes within the Create table statement:
|
1 2 3 4 5 6 7 8 |
CREATE TABLE Bookstore2 (ISBN_NO VARCHAR(15) NOT NULL PRIMARY KEY, SHORT_DESC VARCHAR(100), AUTHOR VARCHAR(40), PUBLISHER VARCHAR(40), PRICE FLOAT, INDEX SHORT_DESC_IND(SHORT_DESC, PUBLISHER) ); |
This time, if we navigate to Object Explorer, we’ll find the index on multiple columns:
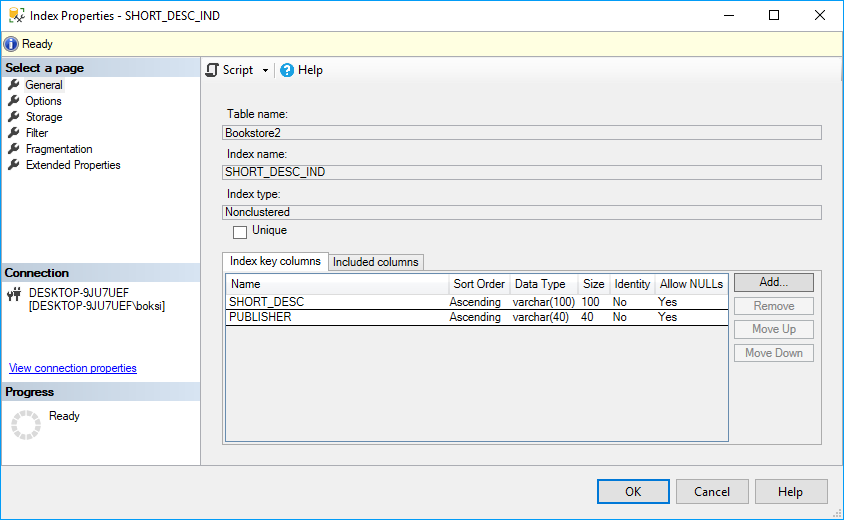
We can right-click the index, hit Properties and it will show us what exactly this index spans like table name, index name, index type, unique/non-unique, and index key columns:
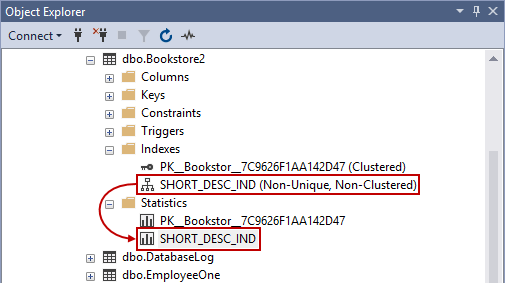
We must briefly mention statistics. As the name implies, statistics are stat sheets for the data within the columns that are indexed. They primarily measure data distribution within columns and are used by the query optimizer to estimate rows and make high-quality execution plans.
Therefore, any time a SQL index is created, stats are automatically generated to store the distribution of the data within that column. Right under the Indexes folder, there is the Statistics folder. If expanded, you’ll see the sheet with the same specified name as we previously did to our index (the same goes for the primary key):
There is not much for users to do on SQL Server when it comes to statistics because leaving the defaults is generally the best practice which ultimately auto-creates and updates statistics. SQL Server will do an excellent job with managing statistics for 99% of databases but it’s still good to know about them because they are another piece of the puzzle when it comes to troubleshooting slow running queries.
For detailed information on statistics, please see the following article: How to optimize SQL Server query performance – Statistics, Joins and Index Tuning
Also worth mentioning are selectivity and density when creating SQL indexes. These are just measurements used to measure index weight and quality:
- Selectivity – number or distinct keys values
- Density – number of duplicate key values
These two are proportional one to another and are used to measure both index weight and quality. Essentially how this works in the real world can be explained in an artificial example. Let’s say that there’s an Employees table with 1000 records and a birth date column that has an index on it. If there is a query that hits that column often coming either from us or application and retrieves no more than 5 rows that means that our selectivity is 0.995 and density is 0.005. That is what we should aim for when creating an index. In the best-case scenario, we should have indexes that are highly selective which basically means that queries coming at them should return a low number of rows.
When creating SQL indexes, I always like to set SQL Server to display information of disk activity generated by queries. So the first thing we can do is to enable IO statistics. This is a great way to see how much work SQL Server has to do under the hood to retrieve the data. We also need to include the actual execution plan and for that, I like to use a SQL execution plan viewing and analysis tool called ApexSQL Plan. This tool will show us the execution plan that was used to retrieve the data so we can see what SQL indexes, if any, are used. When using ApexSQL Plan, we don’t really need to enable IO statistics because the application has advanced I/O reads stats like the number of logical reads including LOB, physical reads (including read-ahead and LOB), and how many times a database table was scanned. However, enabling the stats on SQL Server can help when working in SQL Server Management Studio. The following query will be used as an example:
|
1 2 3 4 5 6 7 8 9 10 11 12 13 14 15 |
CHECKPOINT; GO DBCC DROPCLEANBUFFERS; DBCC FREESYSTEMCACHE('ALL'); GO SET STATISTICS IO ON; GO SELECT sod.SalesOrderID, sod.ProductID, sod.ModifiedDate FROM Sales.SalesOrderDetail sod JOIN Sales.SpecialOfferProduct sop ON sod.SpecialOfferID = sop.SpecialOfferID AND sod.ProductID = sop.ProductID WHERE sop.ModifiedDate >= '2013-04-30 00:00:00.000'; GO |
Notice that we also have the CHECKPOINT and DBCC DROPCLEANBUFFERS that are used to test queries with a clean buffer cache. They are basically creating a clean system state without shutting down and restarting the SQL Server.
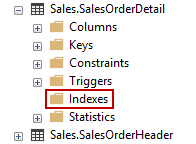
So, we got a table inside the sample AdventureWorks2014 database called “SalesOrderDetail”. By default, this table has three indexes, but I’ve deleted those for the testing purposes. If expanded, the folder is empty:
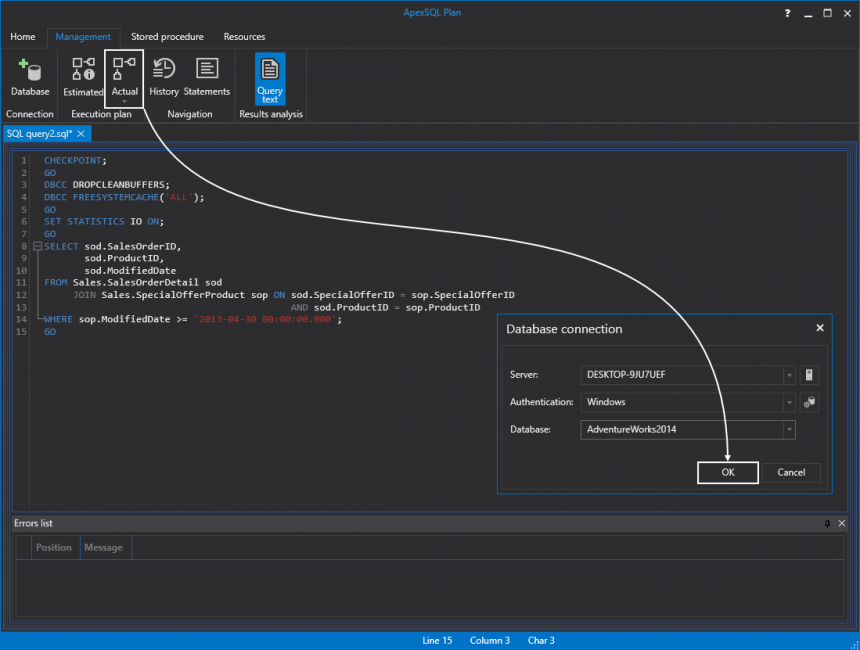
Next, let’s get the actual execution plan by simply pasting the code in ApexSQL Plan and clicking the Actual button. This will prompt the Database connection dialog first time in which we have to choose the SQL Server, authentication method and the appropriate database to connect to:
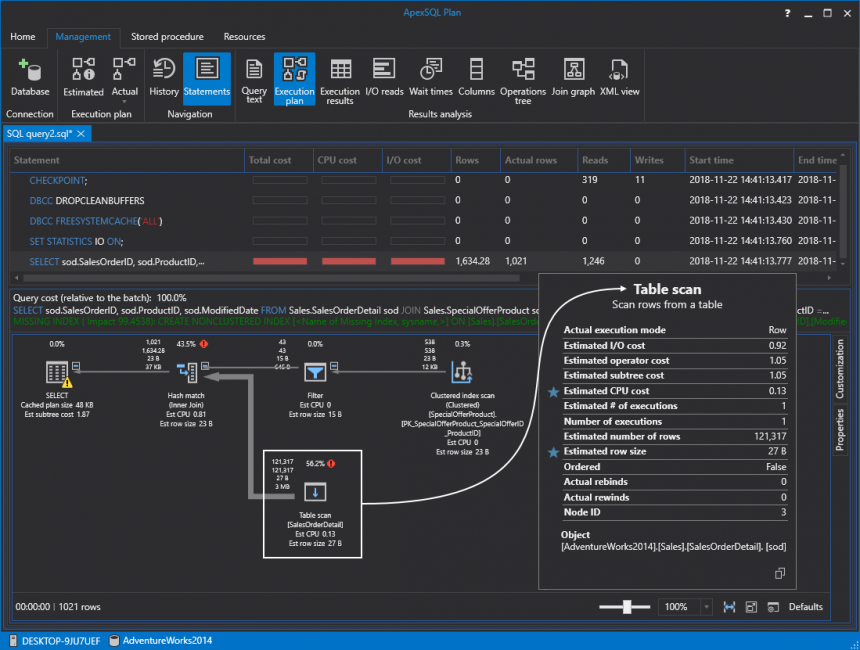
This will take us to the query execution plan where we can see that SQL Server is doing a table scan and it’s taking most resources (56.2%) relative to the batch. This is bad because it’s scanning everything in that table to pull a small portion of the data. To be more specific, the query returns only 1.021 rows out of 121.317 in total:
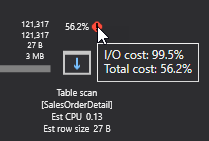
If we hover the mouse over the red exclamation mark, an additional tooltip will show the IO cost as well. In this case, 99.5 percent:
So, 1.021 rows out of 121.317 returned almost instantly on the modern machine but SQL Server still has to do a lot of work and as data fills up in the table the query could get slower and slower over time. So, the first thing we have to do is create a clustered index on the “SalesOrderDetail” table. Bear in mind that we should always choose the clustered index wisely. In this case, we are creating it on the “SalesOrderID” and “SalesOrderDetailID” because we’re expecting so much data on them. Let’s just go ahead and create this SQL index by executing the query from below:
|
1 2 3 4 5 |
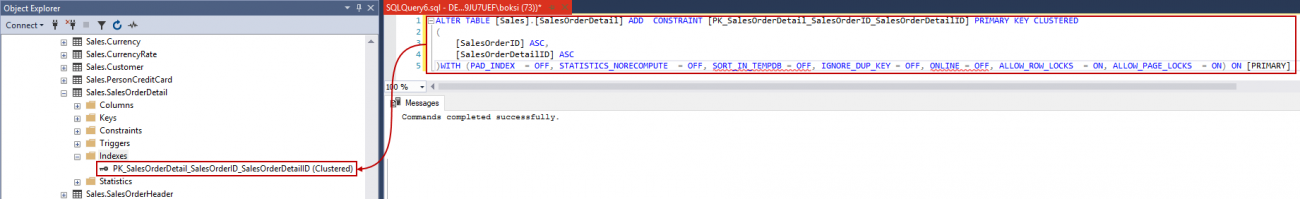
ALTER TABLE [Sales].[SalesOrderDetail] ADD CONSTRAINT [PK_SalesOrderDetail_SalesOrderID_SalesOrderDetailID] PRIMARY KEY CLUSTERED ( [SalesOrderID] ASC, [SalesOrderDetailID] ASC )WITH (PAD_INDEX = OFF, STATISTICS_NORECOMPUTE = OFF, SORT_IN_TEMPDB = OFF, IGNORE_DUP_KEY = OFF, ONLINE = OFF, ALLOW_ROW_LOCKS = ON, ALLOW_PAGE_LOCKS = ON) ON [PRIMARY] |
Actually, before we do that. Let’s quickly switch over to the IO reads tab and take a shot from there just so we have this information before doing anything:
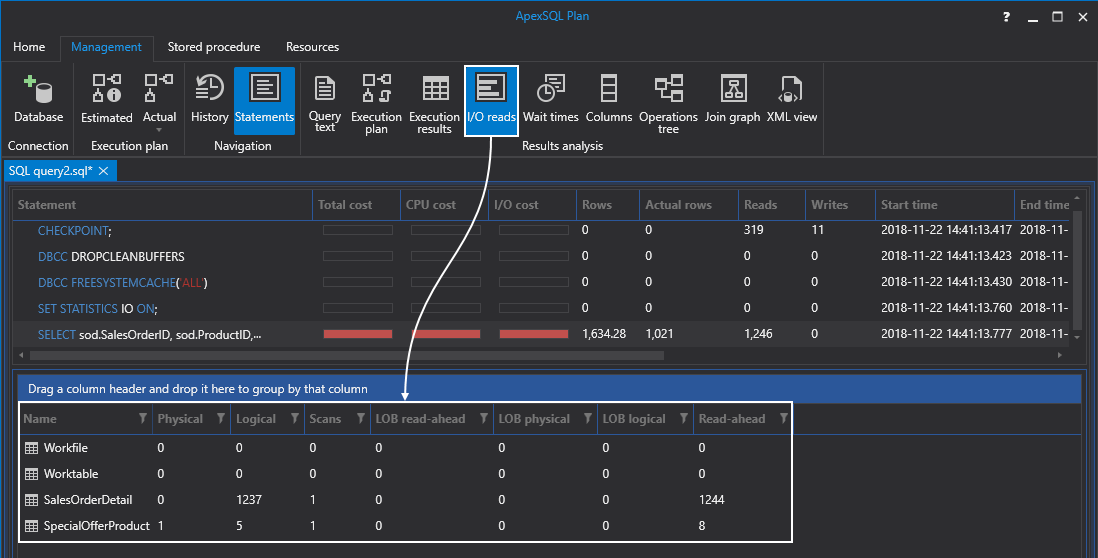
After executing the above query, we will have a clustered index created by a primary key constraint. If we refresh the Indexes folder in Object Explorer, we should see the newly created clustered, unique, primary key index:
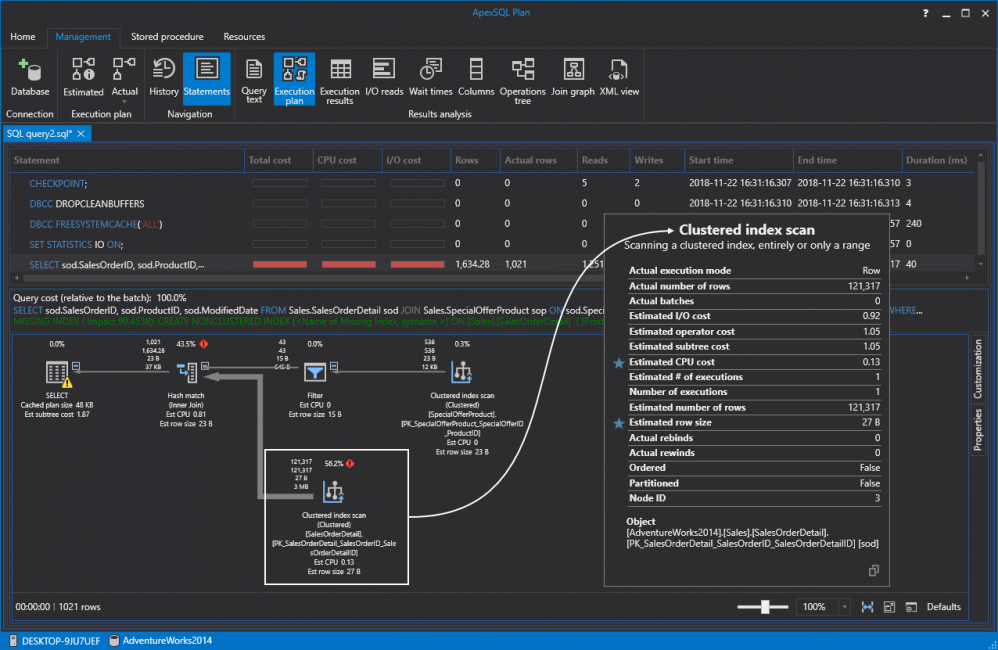
Now, this isn’t going to improve performance a great deal. As a matter of fact, if we run the same query again it will just switch from the table scan to a clustered index scan:
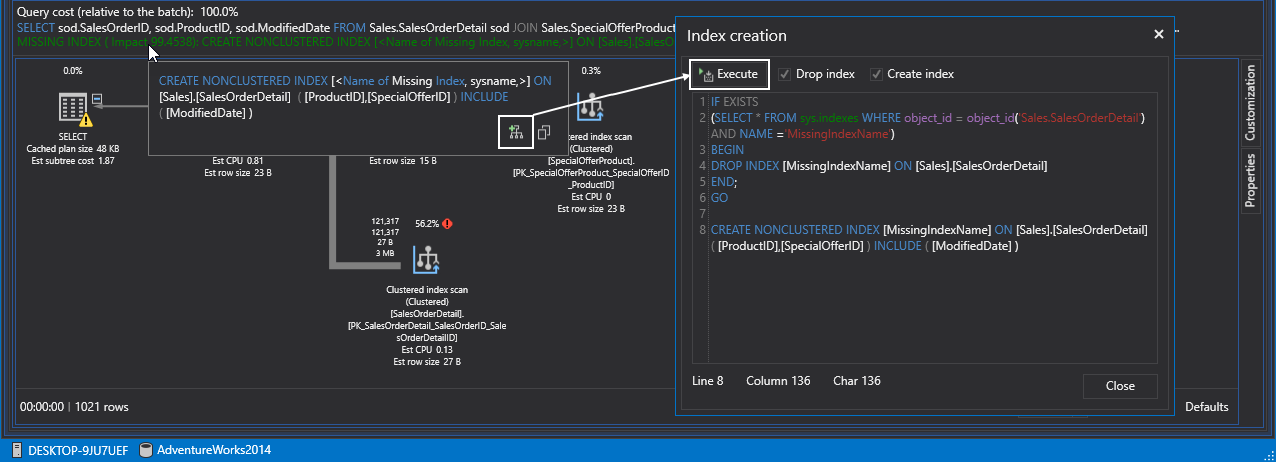
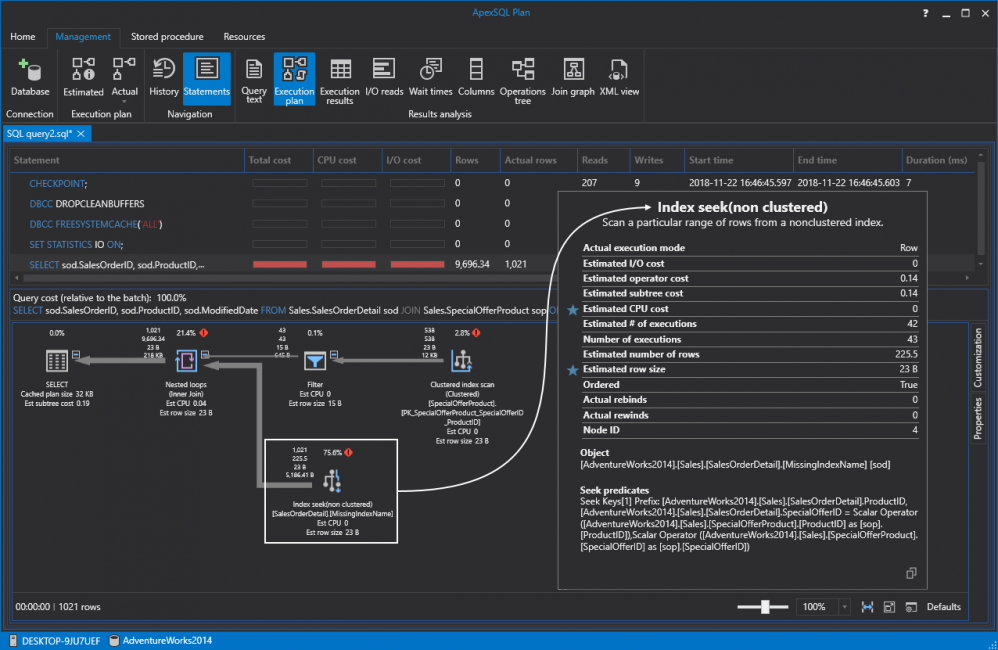
However, we paved the way for the future nonclustered SQL indexes. So, without further ado let’s create a nonclustered index. Notice that ApexSQL Plan determines missing indexes and create queries for (re)creating them from the tooltip. Feel free to review and edit the default code or just hit Execute to create the index:
If we execute the query again, SQL Server is doing a nonclustered index seek instead of the previous scan. Remember seeks are always better than scans:
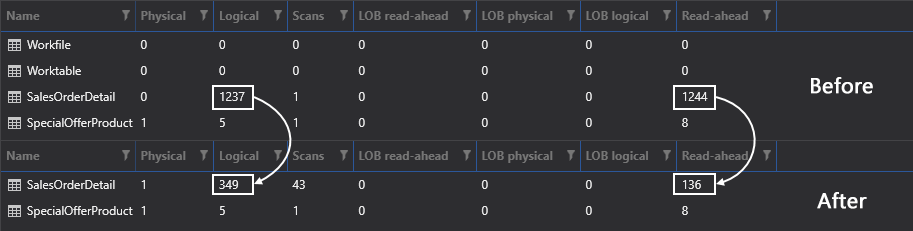
Don’t let the number fools you. Even though some numbers are higher relative to the batch compared to the previous runs this doesn’t necessarily mean that it’s a bad thing. If we switch over to IO reads again and compare them to the previous results, just look at those reads going drastically down from 1.237 to 349, and 1.244 to 136. The reason this was so efficient is that SQL Server used only the SQL indexes to retrieve the data:
Indexing strategy guidelines
Poorly designed SQL indexes and a lack of them are primary sources of database and application performance issues. Here are a few indexing strategies that should be considered when indexing tables:
- Avoid indexing highly used table/columns – The more indexes on a table the bigger the effect will be on a performance of Insert, Update, Delete, and Merge statements because all indexes must be modified appropriately. This means that SQL Server will have to do page splitting, move data around, and it will have to do that for all affected indexes by those DML statements
- Use narrow index keys whenever possible – Keep indexes narrow, that is, with as few columns as possible. Exact numeric keys are the most efficient SQL index keys (e.g. integers). These keys require less disk space and maintenance overhead
- Use clustered indexes on unique columns – Consider columns that are unique or contain many distinct values and avoid them for columns that undergo frequent changes
- Nonclustered indexes on columns that are frequently searched and/or joined on – Ensure that nonclustered indexes are put on foreign keys and columns frequently used in search conditions, such as Where clause that returns exact matches
- Cover SQL indexes for big performance gains – Improvements are attained when the index holds all columns in the query
I hope this article on the SQL indexing strategy has been informative and I thank you for reading.

He has written extensively on both the SQL Shack and the ApexSQL Solution Center, on topics ranging from client technologies like 4K resolution and theming, error handling to index strategies, and performance monitoring.
Bojan works at ApexSQL in Nis, Serbia as an integral part of the team focusing on designing, developing, and testing the next generation of database tools including MySQL and SQL Server, and both stand-alone tools and integrations into Visual Studio, SSMS, and VSCode.
See more about Bojan at LinkedIn
View all posts by Bojan Petrovic
- Visual Studio Code for MySQL and MariaDB development - August 13, 2020
- SQL UPDATE syntax explained - July 10, 2020
- CREATE VIEW SQL: Working with indexed views in SQL Server - March 24, 2020