
Description
Fixing and preventing performance problems is critical to the success of any application. We will use a variety of tools and best practices to provide a set of techniques that can be used to analyze and speed up any performance problem!
This is one of my personal favorite areas of research and discussion as it is inherently satisfying. Taking a performance nightmare and tuning it into something fast and sleek feels great and will undoubtedly make others happy.
I often view optimization as a detective mystery. Something terrible has happened and you need to follow clues to locate and apprehend the culprit! This series of articles is all about these clues, how to identify them, and how to use them in order to find the root cause of a performance problem.
For more information about Query optimization, see the SQL Query Optimization — How to Determine When and If It’s Needed article
Defining Optimization
What is “optimal”? The answer to this will also determine when we are done with a problem and can move onto the next one. Often, a query can be sped up through many different means, each of which has an associated time and resource cost.
We usually cannot spend the resources needed to make a script run as fast as possible, nor should we want to. For the sake of simplicity, we will define “optimal” as the point at which a query performs acceptably and will continue to do so for a reasonable amount of time in the future. This is as much as a business definition as it is a technical definition. With infinite money, time, and computing resources, anything is possible, but we do not have the luxury of unlimited resources, and therefore must define what “done” is whenever we chase any performance problem.
This provides us with several useful checkpoints that will force us to re-evaluate our progress as we optimize:
- The query now performs adequately.
- The resources needed to optimize further are very expensive.
- We have reached a point of diminishing returns for any further optimization.
- A completely different solution is discovered that renders this unneeded.
Over-optimization sounds good, but in the context of resource management is generally wasteful. A giant (but unnecessary) covering index will cost us computing resources whenever we write to a table for the rest of eternity (a long time). A project to rewrite code that was already acceptable might cost days or weeks of development and QA time. Trying to further tweak an already good query may net a gain of 3%, but take a week of sweating to get there.
Our goal is to solve a problem and not over-solve it.
What Does the Query Do?
Question #1 that we must always answer is: What is the purpose of a query?
- What is its purpose?
- What should the result set look like?
- What sort of code, report, or UI is generating the query?
It is first-nature for us to want to dive in with a sword in hand and slay the dragon as quickly as humanly possible. We have a trace running, execution plans in hand, and a pile of IO and timing statistics collected before realizing that we have no idea what we are doing 🙂
Step #1 is to step back and understand the query. Some helpful questions that can aid in optimization:
- How large is the result set? Should we brace ourselves for a million rows returned, or just a few?
- Are there any parameters that have limited values? Will a given parameter always have the same value, or are there other limitations on values that can simplify our work by eliminating avenues of research.
- How often is the query executed? Something that occurs once a day will be treated very differently than one that is run every second.
- Are there any invalid or unusual input values that are indicative of an application problem? Is one input set to NULL, but never should be NULL? Are any other inputs set to values that make no sense, are contradictory, or otherwise go against the use-case of the query?
- Are there any obvious logical, syntactical, or optimization problems staring us in the face? Do we see any immediate performance bombs that will always perform poorly, regardless of parameter values or other variables? More on these later when we discuss optimization techniques.
- What is acceptable query performance? How fast must the query be for its consumers to be happy? If server performance is poor, how much do we need to decrease resource consumption for it to be acceptable? Lastly, what is the current performance of the query? This will provide us with a baseline so we know how much improvement is needed.
By stopping and asking these questions prior to optimizing a query, we avoid the uncomfortable situation in which we spend hours collecting data about a query only to not fully understand how to use it. In many ways, query optimization and database design force us to ask many of the same questions.
The results of this additional foresight will often lead us to more innovative solutions. Maybe a new index isn’t needed and we can break a big query into a few smaller ones. Maybe one parameter value is incorrect and there is a problem in code or the UI that needs to be resolved. Maybe a report is run once a week, so we can pre-cache the data set and send the results to an email, dashboard, or file, rather than force a user wait 10 minutes for it interactively.
Tools
To keep things simple, we’ll use only a handful of tools in this article:
Execution Plans
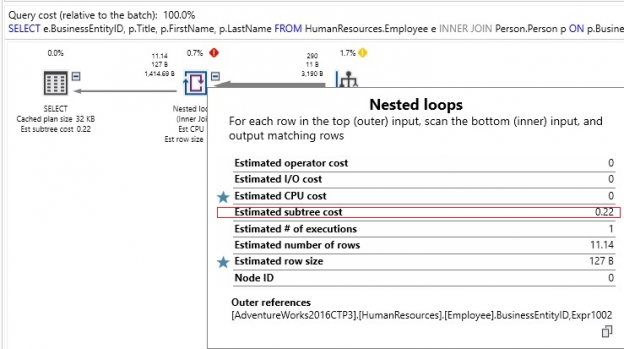
An execution plan provides a graphical representation of how the query optimizer chose to execute a query:
The execution plan shows us which tables were accessed, how they were accessed, how they were joined together, and any other operations that occurred along the way. Included are query costs, which are estimates of the overall expense of any query component. A treasure trove of data is also included, such as row size, CPU cost, I/O cost, and details on which indexes were utilized.
In general, what we are looking for are scenarios in which large numbers of rows are being processed by any given operation within the execution plan. Once we have found a high cost component, we can zoom in on what the cause is and how to resolve it.
STATISTICS IO
This allows us to see how many logical and physical reads are made when a query is executed and may be turned on interactively in SQL Server Management Studio by running the following TSQL:
SET STATISTICS IO ON;
Once on, we will see additional data included in the Messages pane:

Logical reads tell us how many reads were made from the buffer cache. This is the number that we will refer to whenever we talk about how many reads a query is responsible for, or how much IO it is causing.
Physical reads tell us how much data was read from a storage device as it was not yet present in memory. This can be a useful indication of buffer cache/memory capacity problems if data is very frequently being read from storage devices, rather than memory.
In general, IO will be the primary cause of latency and bottlenecks when analyzing slow queries. The unit of measurement of STATISTICS IO = 1 read = a single 8kb page = 8192 bytes.
Query Duration
Typically, the #1 reason we will research a slow query is because someone has complained and told us that it is too slow. The time it takes a query to execute is going to often be the smoking gun that leads us to a performance problem in need of a solution.
For our work here, we will measure duration manually using the timer found in the lower-right hand corner of SSMS:

There are other ways to accurately measure query duration, such as setting on STATISTICS TIME, but we’ll focus on queries that are slow enough that such a level of accuracy will not be necessary. We can easily observe when a 30 second query is improved to run in sub-second time. This also reinforces the role of the user as a constant source of feedback as we try to improve the speed of an application.
Our Eyes
Many performance problems are the result of common query patterns that we will become familiar with below. This pattern recognition allows us to short-circuit a great deal of research when we see something that is clearly poorly written.
As we optimize more and more queries, quickly identifying these indicators becomes more second-nature and we’ll get the pleasure of being able to fix a problem quickly, without the need for very time-consuming research.
In addition to common query mistakes, we will also look out for any business logic hints that may tell us if there is an application problem, parameter issue, or some other flaw in how the query was generated that may require involvement from others aside from us.
What Does the Query Optimizer Do?
Every query follows the same basic process from TSQL to completing execution on a SQL Server:

Parsing is the process by which query syntax is checked. Are keywords valid and are the rules of the TSQL language being followed correctly. If you made a spelling error, named a column using a reserved word, or forgot a semicolon before a common table expression, this is where you’ll get error messages informing you of those problems.
Binding checks all objects referenced in your TQL against the system catalogs and any temporary objects defined within your code to determine if they are both valid and referenced correctly. Information about these objects is retrieved, such as data types, constraints, and if a column allows NULL or not. The result of this step is a query tree that is composed of a basic list of the processes needed to execute the query. This provides basic instructions, but does not yet include specifics, such as which indexes or joins to use.
Optimization is the process that we will reference most often here. The optimizer operates similarly to a chess (or any gaming) computer. It needs to consider an immense number of possible moves as quickly as possible, remove the poor choices, and finish with the best possible move. At any point in time, there may be millions of combinations of moves available for the computer to consider, of which only a handful will be the best possible moves. Anyone that has played chess against a computer knows that the less time the computer has, the more likely it is to make an error.
In the world of SQL Server, we will talk about execution plans instead of chess moves. The execution plan is the set of specific steps that the execution engine will follow to process a query. Every query has many choices to make to arrive at that execution plan and must do so in a very short span of time.
These choices include questions such as:
- What order should tables be joined?
- What joins should be applied to tables?
- Which indexes should be used?
- Should a seek or scan be used against a given table?
- Is there a benefit in caching data in a worktable or spooling data for future use?
Any execution plan that is considered by the optimizer must return the same results, but the performance of each plan may differ due to those questions above (and many more!).
Query optimization is a CPU-intensive operation. The process to sift through plans requires significant computing resources and to find the best plan may require more time than is available. As a result, a balance must be maintained between the resources needed to optimize the query, the resources required to execute the query, and the time we must wait for the entire process to complete. As a result, the optimizer is not built to select the best execution plan, but instead to search and find the best possible plan after a set amount of time passes. It may not be the perfect execution plan, but we accept that as a limitation of how a process with so many possibilities must operate.
The metric used to judge execution plans and decide which to consider or not is query cost. The cost has no unit and is a relative measure of the resources required to execute each step of an execution plan. The overall query cost is the sum of the costs of each step within a query. You can view these costs in any execution plan:
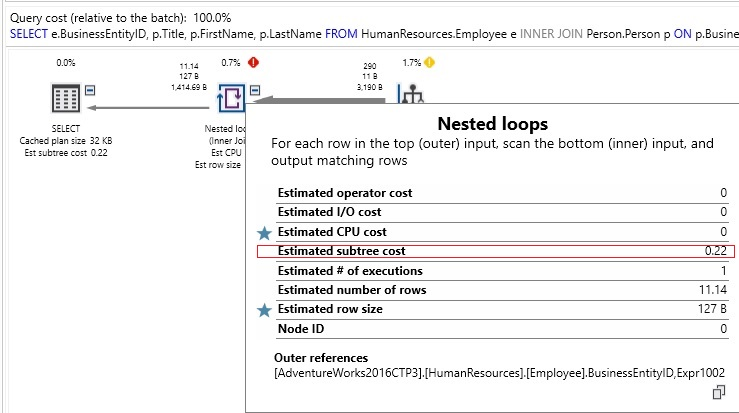
Subtree costs for each component of a query are calculated and used to either:
- Remove a high-cost execution plan and any similar ones from the pool of available plans.
- Rank the remaining plans based on how low their cost is.
While query cost is a useful metric to understand how SQL Server has optimized a particular query, it is important to remember that its primary purpose is to aid the query optimizer in choosing good execution plans. It is not a direct measure of IO, CPU, memory, duration, or any other metric that matters to an application user waiting for query execution to complete. A low query cost may not indicate a fast query or the best plan. Alternatively, a high query cost may sometimes be acceptable. As a result, it’s best to not rely heavily on query cost as a metric of performance.
As the query optimizer churns through candidate execution plans, it will rank them from lowest cost to highest cost. Eventually, the optimizer will reach one of the following conclusions:
- Every execution plan has been evaluated and the best one chosen.
- There isn’t enough time to evaluate every plan, and the best one thus far is chosen.
Once an execution plan is chosen, the query optimizer’s job is complete and we can move to the final step of query processing.
Execution is the final step. SQL Server takes the execution plan that was identified in the optimization step and follows those instructions in order to execute the query.
A note on plan reuse: Because optimizing is an inherently expensive process, SQL Server maintains an execution plan cache that stores details about each query executed on a server and the plan that was chosen for it. Typically, databases experience the same queries executed over and over again, such as a web search, order placement, or social media post. Reuse allows us to avoid the expensive optimization process and rely on the work we have previously done to optimize a query.
When a query is executed that already has a valid plan in cache, that plan will be chosen, rather than going through the process of building a new one. This saves computing resources and speeds up query execution immensely. We’ll discuss plan reuse more in a future article when we tackle parameter sniffing.
Common Themes in Query Optimization
With the introduction out of the way, let’s dive into optimization! The following is a list of the most common metrics that will assist in optimization. Once the basics are out of the way, we can use these basic processes to identify tricks, tips, and patterns in query structure that can be indicative of poor performance.
Index Scans
Data may be accessed from an index via either a scan or a seek. A seek is a targeted selection of rows from the table based on a (typically) narrow filter. A scan is when an entire index is searched to return the requested data. If a table contains a million rows, then a scan will need to traverse all million rows to service the query. A seek of the same table can traverse the index’s binary tree quickly to return only the data needed, without the need to inspect the entire table.
If there is a legitimate need to return a great deal of data from a table, then an index scan may be the correct operation. If we needed to return 950,000 rows from a million row table, then an index scan makes sense. If we only need to return 10 rows, then a seek would be far more efficient.
Index scans are easy to spot in execution plans:
|
1 2 3 4 5 6 7 8 |
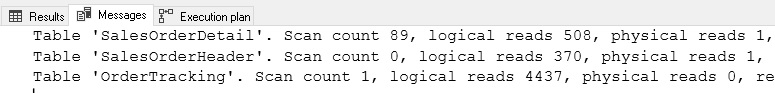
SELECT * FROM Sales.OrderTracking INNER JOIN Sales.SalesOrderHeader ON SalesOrderHeader.SalesOrderID = OrderTracking.SalesOrderID INNER JOIN Sales.SalesOrderDetail ON SalesOrderDetail.SalesOrderID = SalesOrderHeader.SalesOrderID WHERE OrderTracking.EventDateTime = '2014-05-29 00:00:00'; |
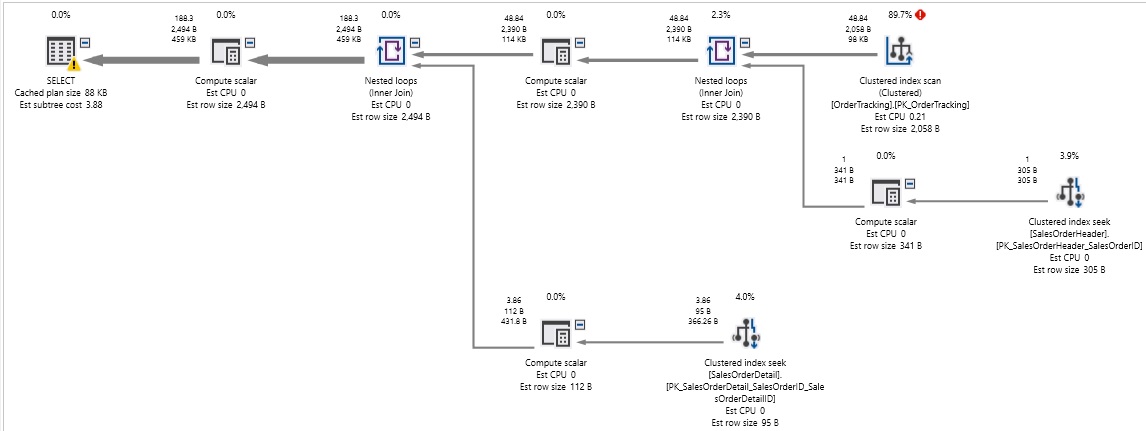
We can quickly spot the index scan in the top-right corner of the execution plan. Consuming 90% of the resources of the query, and being labeled as a clustered index scan quickly lets us know what is going on here. STATISTICS IO also shows us a large number of reads against the OrderTracking table:
Many solutions are available when we have identified an undesired index scan. Here is a quick list of some thoughts to consider when resolving an index scan problem:
-
Is there any index that can handle the filter in the query?
- In this example, is there an index on EventDateTime?
-
If no index is available, should we create one to improve performance on the query?
- Is this query executed often enough to warrant this change? Indexes improve read speeds on queries, but will reduce write speeds, so we should add them with caution.
-
Is this a valid filter? Is this column one that no one should ever filter on?
- Should we discuss this with those responsible for the app to determine a better way to search for this data?
- Is there some other query pattern that is causing the index scan that we can resolve? We will attempt to more thoroughly answer this question below. If there is an index on the filter column (EventDataTime in this example), then there may be some other shenanigans here that require our attention!
-
Is the query one for which there is no way to avoid a scan?
- Some query filters are all-inclusive and need to search the entire table. In our demo above, if EventDateTIme happens to equal “5-29-2014” in every row in Sales.OrderTracking, then a scan is expected. Similarly, if we were performing a fuzzy string search, an index scan would be difficult to avoid without implementing a Full-Text Index, or some similar feature.
As we walk through more examples, we’ll find a wide variety of other ways to identify and resolve undesired index scans.
Functions Wrapped Around Joins and WHERE Clauses
A theme in optimization is a constant focus on joins and the WHERE clause. Since IO is generally our biggest cost, and these are the query components that can limit IO the most, we’ll often find our worst offenders here. The faster we can slice down our data set to only the rows we need, the more efficient query execution will be!
When evaluating a WHERE clause, any expressions involved need to be resolved prior to returning our data. If a column contains functions around it, such as DATEPART, SUBSTRING, or CONVERT, then these functions will also need to be resolved. If the function must be evaluated prior to execution to determine a result set, then the entirety of the data set will need to be scanned to complete that evaluation.
Consider the following query:
|
1 2 3 4 5 6 7 |
SELECT Person.BusinessEntityID, Person.FirstName, Person.LastName, Person.MiddleName FROM Person.Person WHERE LEFT(Person.LastName, 3) = 'For'; |
This will return any rows from Person.Person that have a last name beginning in “For”. Here is how the query performs:
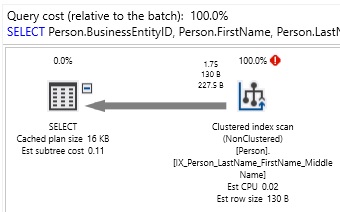

Despite only returning 4 rows, the entire index was scanned to return our data. The reason for this behavior is the use of LEFT on Person.LastName. While our query is logically correct and will return the data we want, SQL Server will need to evaluate LEFT against every row in the table before being able to determine which rows fit the filter. This forces an index scan, but luckily one that can be avoided!
When faced with functions in the WHERE clause or in a join, consider ways to move the function onto the scalar variable instead. Also think of ways to rewrite the query in such a way that the table columns can be left clean (that is: no functions attached to them!)
The query above can be rewritten to do just this:
|
1 2 3 4 5 6 7 |
SELECT Person.BusinessEntityID, Person.FirstName, Person.LastName, Person.MiddleName FROM Person.Person WHERE Person.LastName LIKE 'For%'; |
By using LIKE and shifting the wildcard logic into the string literal, we have cleaned up the LastName column, which will allow SQL Server full access to seek indexes against it. Here is the performance we see on the rewritten version:
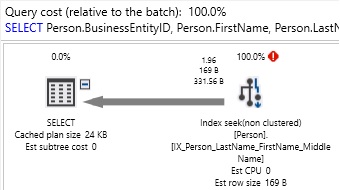

The relatively minor query tweak we made allowed the query optimizer to utilize an index seek and pull the data we wanted with only 2 logical reads, instead of 117.
The theme of this optimization technique is to ensure that columns are left clean! When writing queries, feel free to put complex string/date/numeric logic onto scalar variables or parameters, but not on columns. If you are troubleshooting a poorly performing query and notice functions (system or user-defined) wrapped around column names, then begin thinking of ways to push those functions off into other scalar parts of the query. This will allow SQL Server to seek indexes, rather than scan, and therefore make the most efficient decisions possible when executing the query!
Implicit Conversions
Earlier, we demonstrated how wrapping functions around columns can result in unintended table scans, reducing query performance and increasing latency. Implicit conversions behave the exact same way but are far more hidden from plain sight.
When SQL Server compares any values, it needs to reconcile data types. All data types are assigned a precedence in SQL Server and whichever is of the lower precedence will be automatically converted to the data type of higher precedence. For more info on operator precedence, see the link at the end of this article containing the complete list.
Some conversions can occur seamlessly, without any performance impact. For example, a VARCHAR(50) and VARCHAR(MAX) can be compared no problem. Similarly, a TINYINT and BIGINT, DATE and DATETIME, or TIME and a VARCHAR representation of a TIME type. Not all data types can be compared automatically, though.
Consider the following SELECT query, which is filtered against an indexed column:
|
1 2 3 4 5 6 |
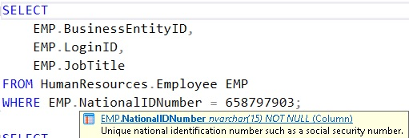
SELECT EMP.BusinessEntityID, EMP.LoginID, EMP.JobTitle FROM HumanResources.Employee EMP WHERE EMP.NationalIDNumber = 658797903; |
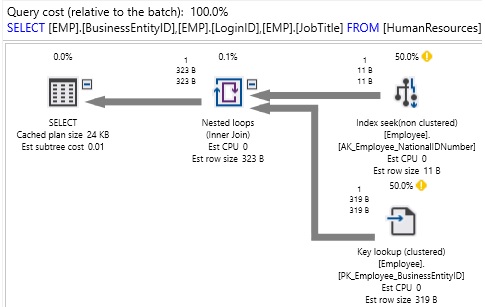
A quick glance and we assume that this query will result in an index seek and return data to us quite efficiently. Here is the resulting performance:
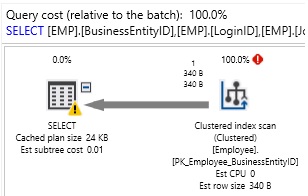

Despite only looking for a single row against an indexed column, we got a table scan for our efforts. What happened? We get a hint from the execution plan in the yellow exclamation mark over the SELECT operation:
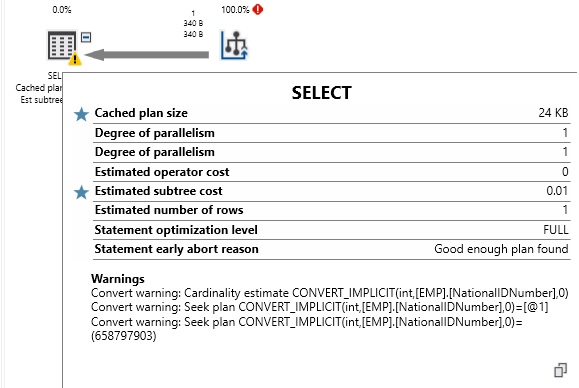
Hovering over the operator reveals a CONVERT_IMPLICIT warning. Whenever we see this, it is an indication that we are comparing two data types that are different enough from each other that they cannot be automatically converted. Instead, SQL Server converts every single value in the table prior to applying the filter.
When we hover over the NationalIDNumber column in SSMS, we can confirm that it is in fact an NVARCHAR(15). The value we are comparing it to is a numeric. The solution to this problem is very similar to when we had a function on a column: Move the conversion over to the scalar value, instead of the column. In this case, we would change the scalar value 658797903 to the string representation, ‘658797903’:
|
1 2 3 4 5 6 |
SELECT EMP.BusinessEntityID, EMP.LoginID, EMP.JobTitle FROM HumanResources.Employee EMP WHERE EMP.NationalIDNumber = '658797903' |
This simple change will completely alter how the query optimizer handles the query:

The result is an index seek instead of a scan, less IO, and the implicit conversion warning is gone from our execution plan.
Implicit conversions are easy to spot as you’ll get a prominent warning from SQL Server in the execution plan whenever it happens. Once you’ve been tipped off to this problem, you can check the data types of the columns indicated in the warning and resolve the issue.
Conclusion
Query optimization is a huge topic that can easily become overwhelming without a good dose of focus. The best way to approach a performance problem is to find specific areas of focus that are most likely the cause of latency. A stored procedure could be 10,000 lines long, but only a single line needs to be addressed to resolve the problem. In these scenarios, finding the suspicious, high-cost, high resource-consuming parts of a script can quickly narrow down the search and allow us to solve a problem rather than hunt for it.
The information in this article should provide a good starting point to tackling latency and performance problems. Query optimization sometimes requires additional resources, such as adding a new index but often can end up as a freebie. When we can improve performance solely by rewriting a query, we reduce resource consumption at no cost (aside from our time). As a result, query optimization can be a direct source of cost-savings! In addition to saving money, resources, and the sanity of those waiting for queries to complete, there is a great deal of satisfaction to be gained by improving a process at no further cost to anyone else.
Thanks for reading, and let’s keep on making things go faster!
Table of contents
| Query optimization techniques in SQL Server: the basics |
| Query optimization techniques in SQL Server: tips and tricks |
| Query optimization techniques in SQL Server: Database Design and Architecture |
| Query Optimization Techniques in SQL Server: Parameter Sniffing |

In his free time, Ed enjoys video games, sci-fi & fantasy, traveling, and being as big of a geek as his friends will tolerate.
View all posts by Ed Pollack
- SQL Server Database Metrics - October 2, 2019
- Using SQL Server Database Metrics to Predict Application Problems - September 27, 2019
- SQL Injection: Detection and prevention - August 30, 2019