
Introduction
In my previous 2 articles, What is a SQL Server Deadlock and Understanding the graphical representation of the SQL Server Deadlock Graph, I discussed what a deadlock is, how SQL Server handles deadlocks, some tips on how to reduce deadlocks and ultimately what information you can glean by just looking at the graphical representation of the Deadlock Graph. In this article, I will look at what information is available in the XML description of the Deadlock Graph. The XML contains information which is not visible in the graphical representation of the Deadlock Graph, which makes it necessary for us to look at the XML description.Extracting the XML Description from the Deadlock Graph
Depending on how you captured your Deadlock Graph you have multiple ways of viewing the XML text.-
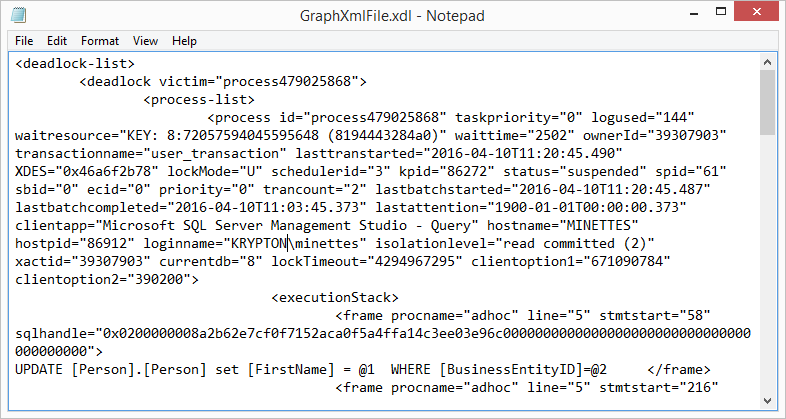
Open the same .xdl file in a text viewer such as notepad

Figure 1: Deadlock XML in notepad -
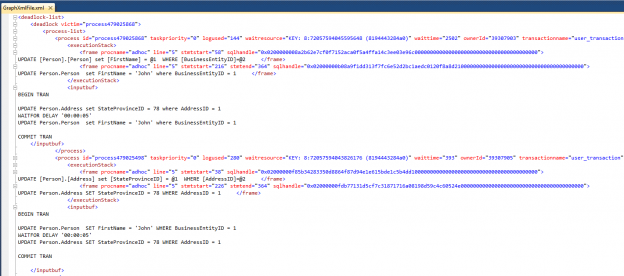
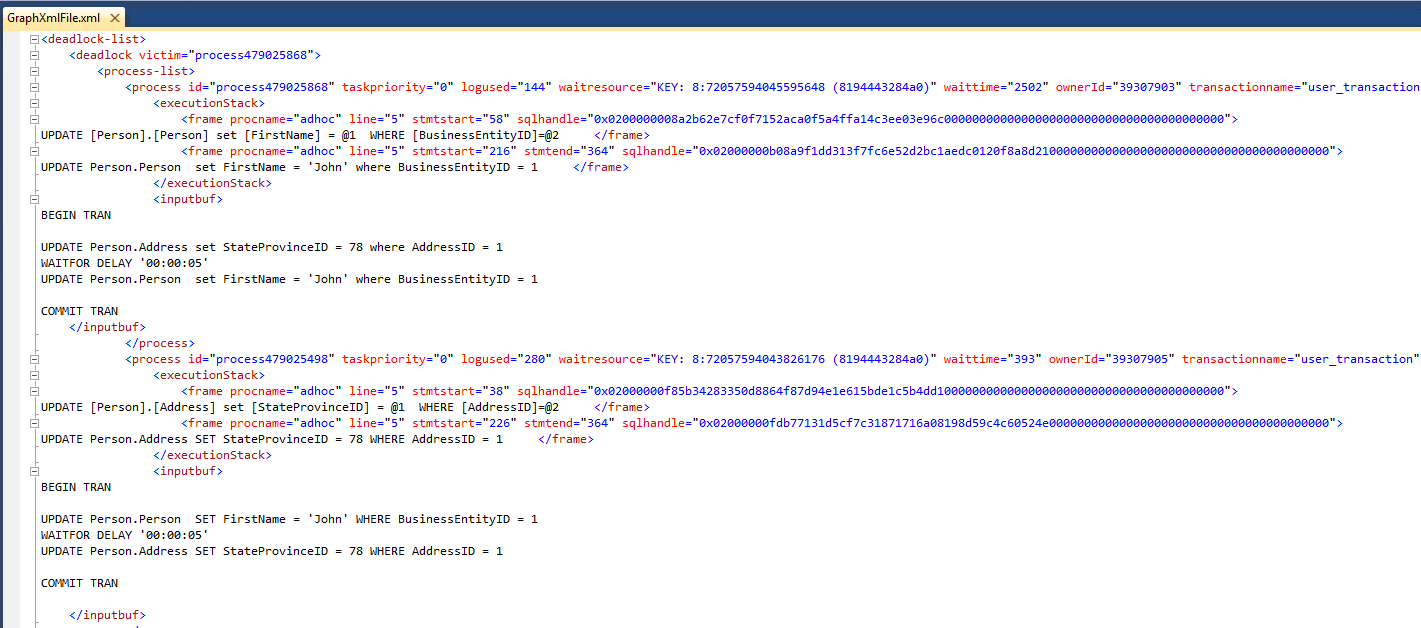
Change the file extension from .xdl to .xml and open it in SSMS
Figure 2: Deadlock Graph as XML in SSMS -
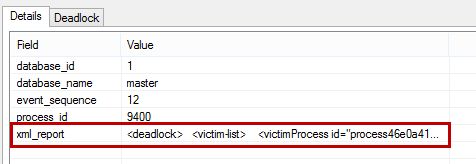
If you extracted your deadlock using Extended Events you can double click on the xml_report line in the event details which will open the xml description as an .xml file in SQL Server Management Studio
Figure 3: Double click to get XML report
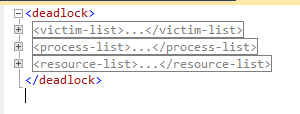
Understanding the XML
The Deadlock XML consists out of 3 sections:- The victim list
- The process list and
- The Resource list
The victim list
The victim list is exactly what it says it’s a list of process ids which have been selected to be the victims of the deadlock. In this particular instance there is only one victim, but it is possible to have multiple victims involved in a deadlock.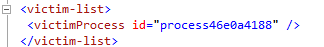
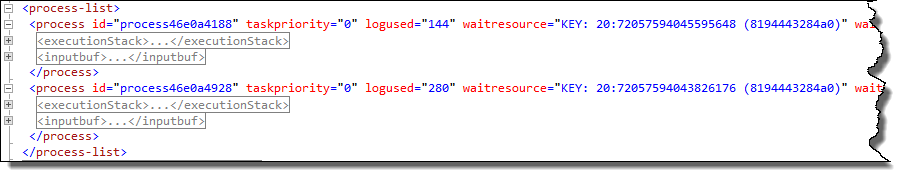
The process list
The process list contains one node for each process involved in the deadlock. The following details are displayed for each process per MSDN:| Id | The process id of the specific process |
| Task priority |
This is the deadlock priority. Typical values are
|
| Log used | The amount of transaction log used by the process |
| Waitresource | The waitresource has a format like this: KEY: 20:72057594045595648 (8194443284 a0) The first part: KEY indicates the resource type. In this case a key. The second part: 20 is the database id The third part: 72057594045595648 is the Heap or B tree ID The part in brackets is the hash value for the index key |
| Waittime | The amount of time the process waited for the resource to become available |
| Ownerid | This displays the transaction id of the transaction which owns the process. This value corresponds to the request_owner_id field in the sys.dm_tran_locks DMV. |
| Input buffer | This describes the event type and the code that is executed. In other words the SQL script that is being executed will be shown here. |
| Statement |
The statement type such as:
|
| transactionname | The name of the transaction or the transaction type: I.e. user_transaction |
| Lasttranstarted | The date time the last transaction started |
| XDES | Transaction description structures |
| LockMode | The type of lock the process wants to take |
| Schedulerid | The ID of the processor on which the process is running |
| Kpid | The Windows thread ID |
| Status |
The status of the process. I.e.:
|
| Spid | The SQL Process ID |
| Sbid | The batch ID |
| Ecid | This is the execution context when the process is executed in parallel. If not executed in parallel this value will be 0. |
| The same as the deadlock task priority | |
| Trancount | The number of transactions involved in the deadlock |
| lastbatchstarted | Date time the last batch was started |
| lastbatchcompleted | Date time the last batch completed |
| lastattention | The timestamp of the processing of the last attention event such as a timeout or a cancellation on the thread involved in the deadlock. |
| Clientapp | The client application that created the process |
| Hostname | The host name on which the client is running |
| Hostpid | The process ID of the client application |
| Loginname | Name of the logged in user |
| Isolationlevel | The isolation level of the process |
| Xactid | The transaction ID of the process |
| Currentdb | Database ID of the database on which the process was run |
| lockTimeout | The maximum time a process can wait for a lock to be released |
| Clientoption1 | These are SET options such as ANSI_NULLS or QUOTED_IDENTIFIER |
| Clientoption2 | More SET options |
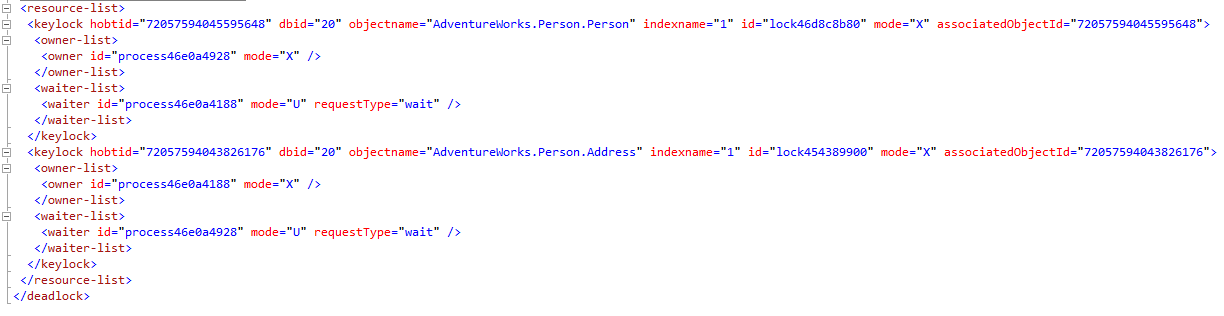
The resource list
The resource list provides detailed information about each resource involved in the deadlock. A resource can be a row, a key, a page, an extent, a heap or a B-tree (HoBT) , a table , a file, an allocation unit or metadata. In this example, the deadlock involved Keys or rather indexes.|
1 2 3 4 5 6 7 8 9 |
<keylock hobtid="72057594045595648" dbid="20" objectname="AdventureWorks.Person.Person" indexname="1" id="lock46d8c8b80" mode="X" associatedobjectid="72057594045595648"> <owner-list> <owner id="process46e0a4928" mode="X"> </owner></owner-list> <waiter-list> <waiter id="process46e0a4188" mode="U" requesttype="wait"> </waiter></waiter-list> </keylock> |
| HoBTId | The heap or B-tree ID |
| dbID | The database id on which the resource exists |
| objectName | The name of the resource |
| indexname | This is the ID or name of the index involved in the deadlock |
| Id | The id of the key lock |
| Mode | The lock mode |
| associatedObjectId | The id of the object on which deadlock occurred, mostly the same as the HoBTID. |
| Owner-list | Information about the owner of the process and corresponding lock mode |
| Waiter-list | Information on the process waiting on the resource, lock type requested and the request type. |
Conclusion
The deadlock graph is the easiest way to get information about a deadlock. A lot of information can be seen simply by looking at the graph, but usually more in depth information is required to be able to resolve the deadlock, such as the types of locks involved, the isolation level used etc. The XML description of the deadlock provides a ton of additional information which makes troubleshooting deadlocks a lot easier. So instead of just using the deadlock graph, be sure to also look at the XML description of the graph.The previous articles in this series
- What is a SQL Server deadlock?
- Understanding the graphical representation of the SQL Server Deadlock Graph

Minette Steynberg has over 15 years’ experience in working with data in different IT roles including SQL developer and SQL Server DBA to name but a few. Minette enjoys being an active member of the SQL Server community by writing articles and the occasional talk at SQL user groups.
Minette currently works as a Data Platform Solution Architect at Microsoft South Africa.
View all posts by Minette Steynberg
Minette currently works as a Data Platform Solution Architect at Microsoft South Africa.
View all posts by Minette Steynberg
Latest posts by Minette Steynberg (see all)
- The end is nigh! (For SQL Server 2008 and SQL Server 2008 R2) - April 4, 2018
- 8 things to know about Azure Cosmos DB (formerly DocumentDB) - September 4, 2017
- Introduction to Azure SQL Data Warehouse - August 29, 2017