
Microsoft Power BI is a data analytics tool available in two flavors: Power BI Desktop and a Power BI Service.
The Power BI Desktop app allows users to create interactive data visualizations locally, while Power BI Service is a cloud-based variant of Power BI. With Power BI Service you can create lots of different types of visualization and perform variance analytics tasks in the cloud.
It makes it very easy to access and share your data visualizations. You can also create your visualizations locally using the Power BI Desktop application and then publish them to the cloud using Power BI Service. Power BI service is also known as Power BI Online.
In this article, we will look at the different types of Power BI Service (Pro and Premium), how you can sign up for a trial version of Power BI Pro, and then go on to create a simple report in Power BI Pro.
For more details, see this article on Power BI licensing.
Types of Power BI Services
Microsoft is not very strict about naming conventions, however, based on functionalities and license fees, Power BI Service can be divided into two types:
- Power BI Pro Service
- Power BI Premium Service
Power BI Pro Service
Power BI Pro is a single user cloud-based software as a service application. With Power BI Pro, you can share your reports, data, visualizations, and dashboards with the other users who have Power BI. Power BI Pro Service is charged on a per user basis.
Power BI Premium Service
Power BI Premium on the other hand caters to the needs of large organizations and enterprises. By contrast with Power BI Pro Service, this is charged for on a capacity basis. Put simply this is a combination of data size and computation capacity required. It allows for unlimited viewers of the data although creators of data visualizations must have a Pro license for Power BI.
Signing Up with Power BI Pro
To sign up with Power BI Pro, go to this link: https://powerbi.microsoft.com/en-us/power-bi-pro/ and click the “Try free” button from the main page.

Once you click on the “Try free” link from the above page, you will be taken to a sign-up page. If you want to register for a Power BI Pro trial, you need a business or school email address.
If you do not have a business or school email address, you can go to this link where you can create an account for Office 365 enterprise. Start a free trial which is valid for 30 days. You can use that same email address to set up a free Power BI Pro trial for 60 days.
Once you have signed up, login to the Power BI service at the following link: https://powerbi.microsoft.com/en-us/landing/signin/
Creating a report
Having logged into your Power BI account, you should see a simple dashboard welcoming you to create a New Report, you have to first create a new workspace.
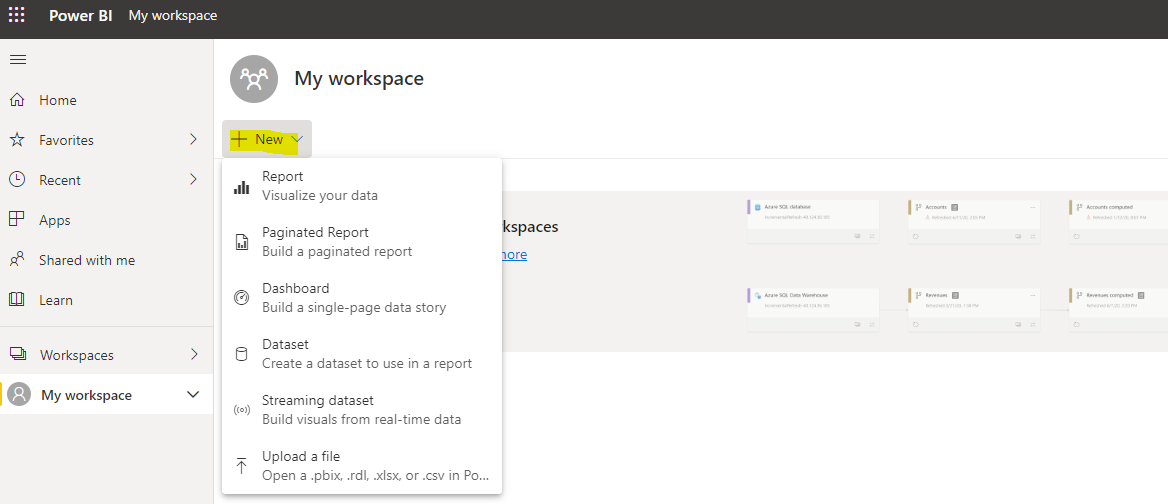
Click the “My workspace” button at the top of the page and you should be taken to a “My workspace” page as is shown in the image below. Click on the “+ New” button and you will see a dropdown list asking you what you would like to create.
Importing the dataset
Assuming that you don’t already have a dataset you will now need to import a dataset to create a report. Note that once you have imported a dataset into the Power BI service you can directly create a new report.
To import a dataset, select the “Dataset” option from the dropdown menu. There are various ways to import datasets to Power BI, the four main options are shown in the following screenshot:
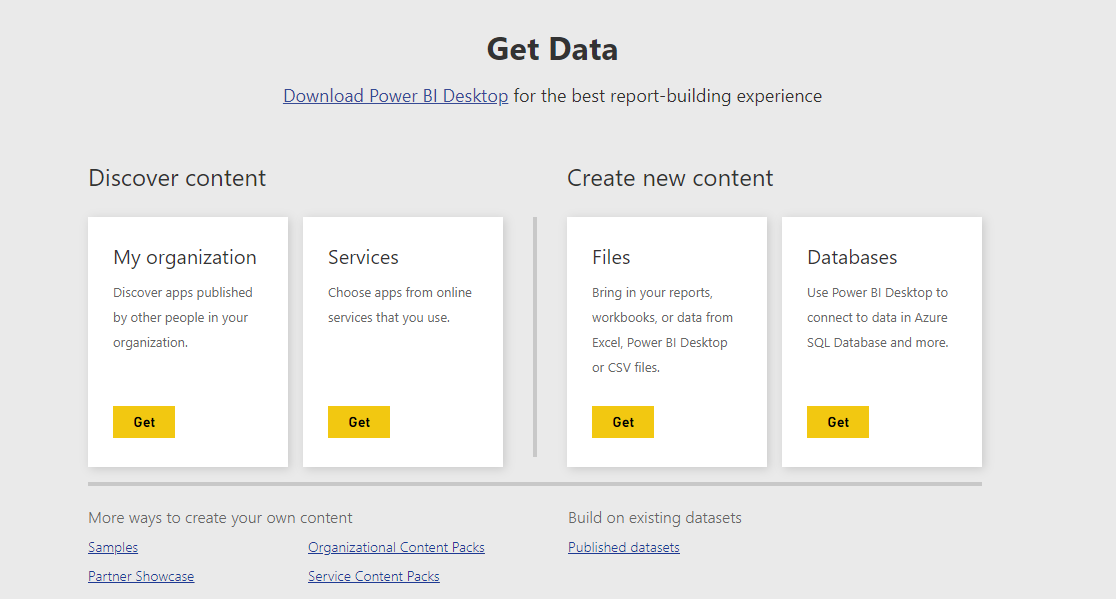
For the purposes of this article, we will be importing data from local files so click “Files” and then select “Local File” and navigate to the file on your PC.
The file I am using for this article can be downloaded from this Kaggle Competition Link. The file contains information like name, age, gender etc. on the passengers who traveled on the Titanic.
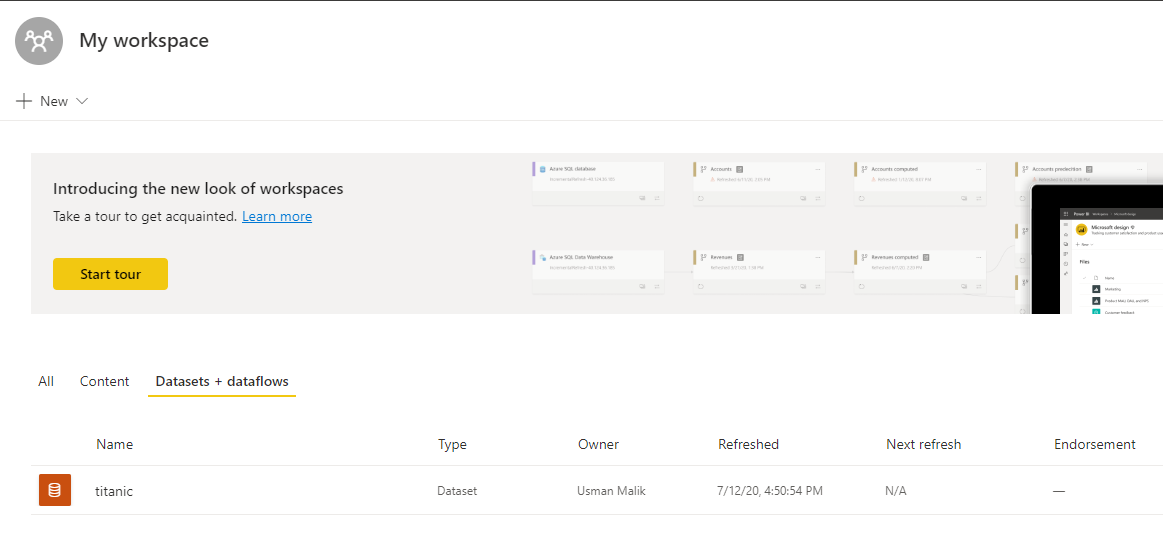
Once the dataset is imported, you will see it in the list of datasets as shown in the following screenshot:
Creating a report
Now that the dataset is imported, you are ready to create a report.
To create a report, again go to “My workspace” click the “+New” button and select “Report” from the dropdown list. Here is a screenshot for reference:
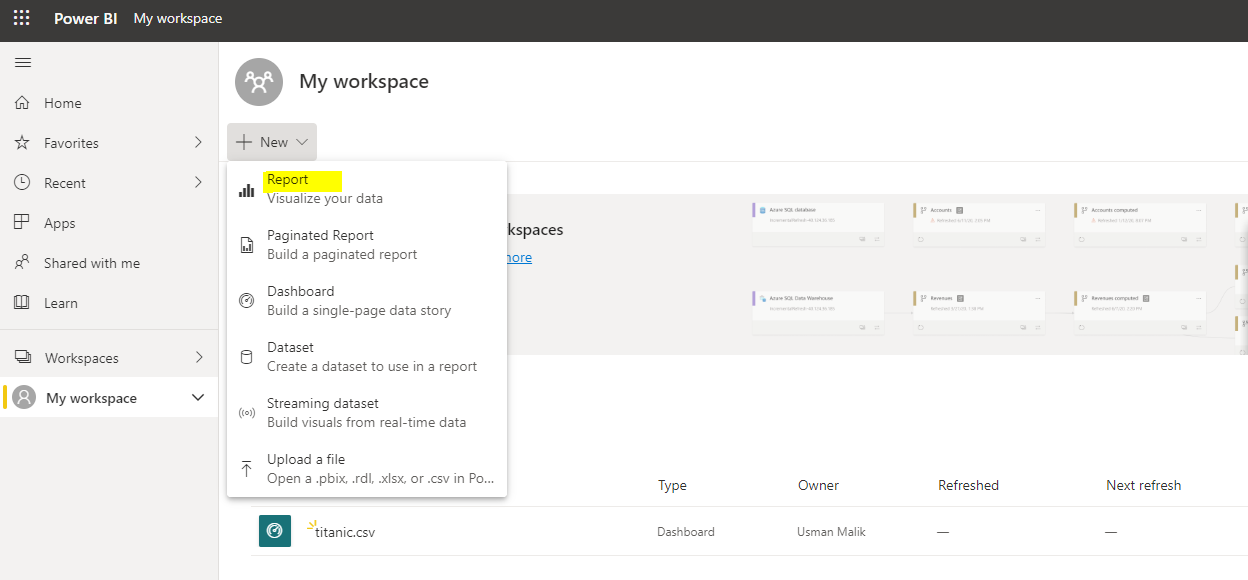
You will then be prompted to select the dataset that you want to use in order to create your report. In this case, we select the Titanic dataset we uploaded earlier.
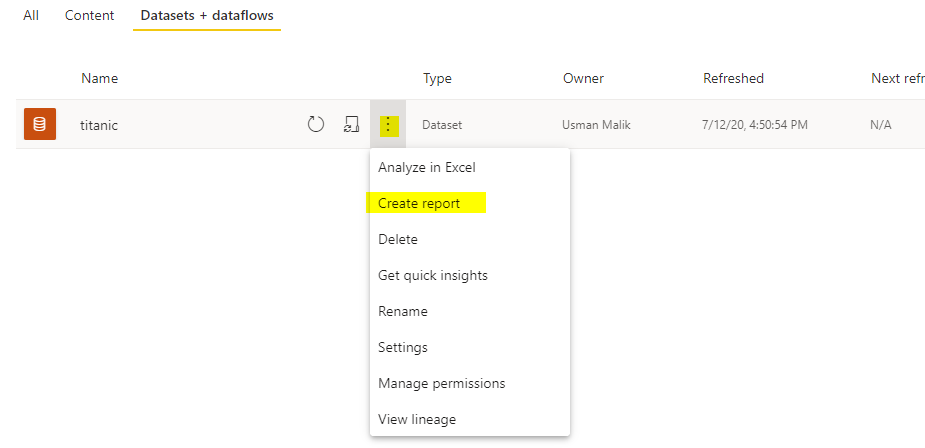
The other option is to right-click on three vertical dots that follow the dataset name and then select the “Create Report” option from the dropdown menu as shown below:
Once you click “Create Report”, you should see the following dashboard.
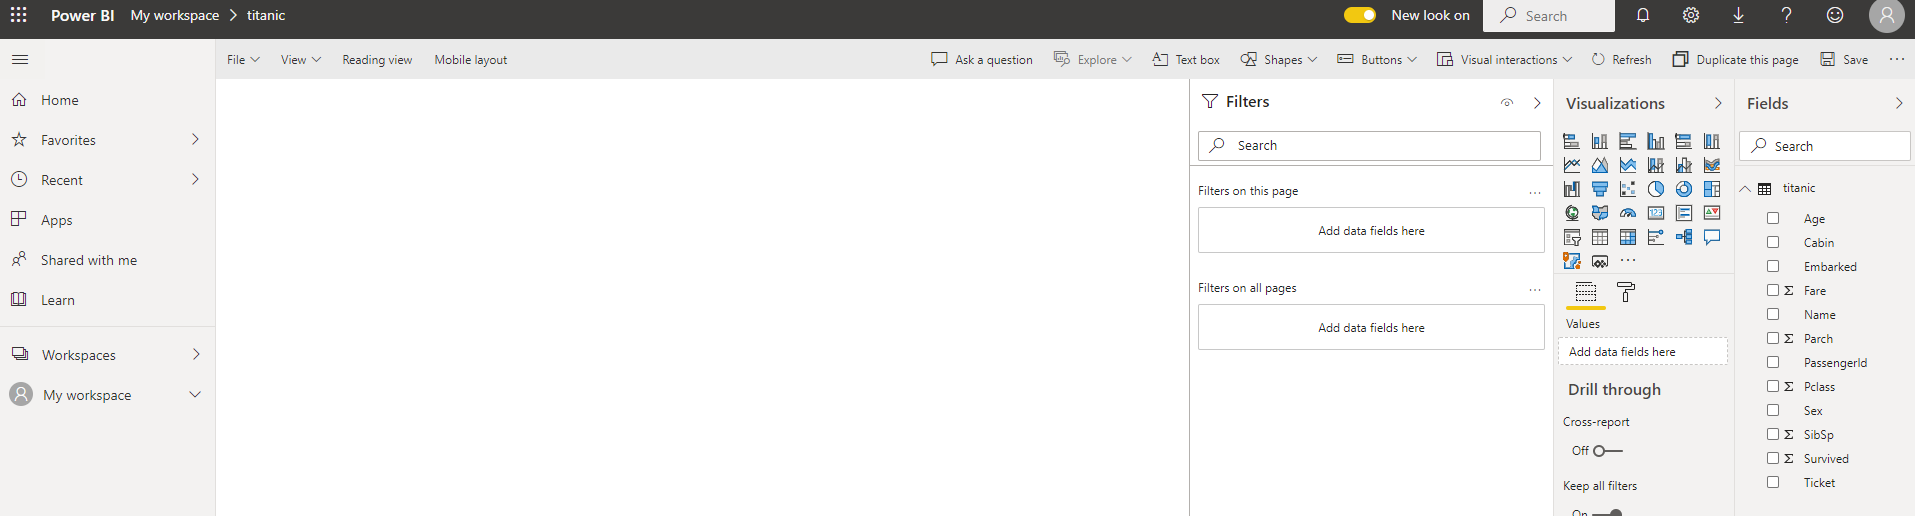
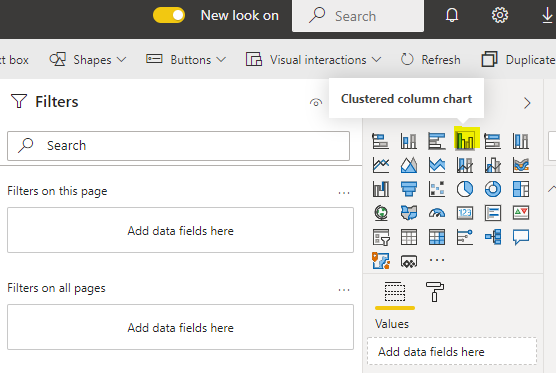
You now need to select the type of graph that you want to create from the “Visualization” group on the right of the window. For the purposes of this article, we’re going to create a clustered column chart:
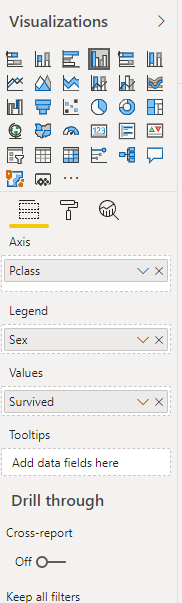
To create a clustered column chart, you have to specify a categorical value for the X-axis, a categorical or numerical value for the y-axis and an optional categorical value for the legend.
The following settings create a clustered column chart where the “PClass” is displayed on the x-axis and the sum of passengers survived on the y-axis. The graph is further categorized by sex via a legend.
Here is the output plot generated as a result:
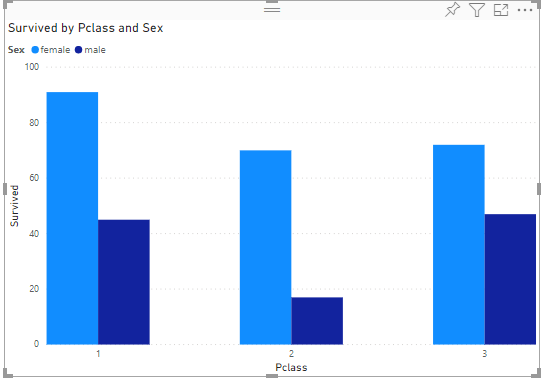
You can see from the plot that the highest number of passengers of both sexes that survived was in first class, with third-class passengers ranking second by a total number of passengers that survived.
The smallest number of surviving passengers was in second-class. The plot also tells us that the number of male surviving passengers is lower than the number of surviving female passengers.
Let’s try creating another visualization. This time we will create a pie chart that shows the total aggregate fares paid by the passengers from the three classes as a proportion of the total fares paid.
To create a pie chart, select “Pie chart” from the list of charts in the “Visualizations” section in the Power BI Reports view as shown below.
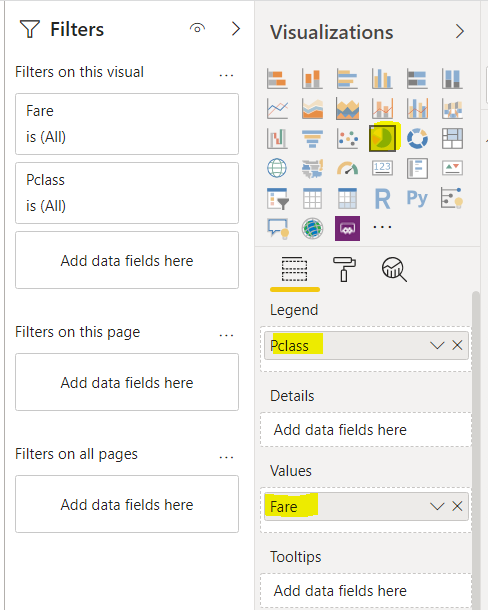
Add the “Pclass” column to the “Legend” field and the “Fare” column to the “Values” field. You should see the following pie chart in the reports view:
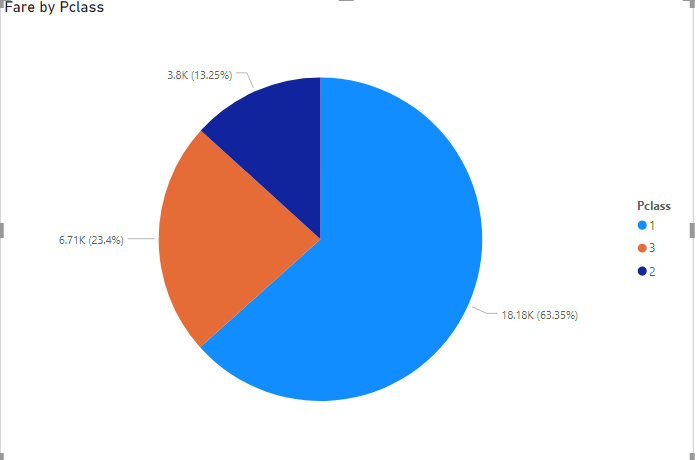
The light-blue portion in the above pie chart shows the fare paid by the first-class passengers while the dark-blue and orange portions correspond to the fares paid by the passengers in the second and third class.
You can see that 63.35% of the total fare is paid by the passengers from the first class, while the second and third-class passengers respectively paid 13.25% and 23.4% of the total fare.
Conclusion
Power BI Service is a very powerful tool when creating and sharing datasets and visualizations. It comes in two different flavors: Power BI Pro and Power BI Premium.
In this article, we looked at what Power BI Service is and how to create a simple report using the Power BI Pro service. We also saw how to import a dataset to the Power BI Pro Service dashboard, how to create a clustered column chart and how to create a pie chart.
The decision to select Power BI desktop, Power BI Pro or Power BI premium depends purely on your usage. If you just want to explore data for personal interest and you do not intend to share it with others, the Power BI desktop app will suffice. However, if you want to make enterprise-level visualizations that you can share with other people, you will have to switch to the Pro or Premium version.

View all posts by Ben Richardson
- Working with the SQL MIN function in SQL Server - May 12, 2022
- SQL percentage calculation examples in SQL Server - January 19, 2022
- Working with Power BI report themes - February 25, 2021