
Microsoft’s Power BI is a data analytics tool that can be used to plot rich reports and graphs for data analysis without writing a single line of code. Among myriads of other features, you can apply different types of Power BI report themes to change the outlook of your reports.
In this article, you will see how to:
- apply default Power BI Report themes to your datasets
- how to import existing themes from other sources
- and how to create your own Power BI report themes by customizing existing themes
Importing Dataset
To create reports in Power BI, you need a dataset. In this article, you will be creating reports using a world population dataset for 2020. The dataset can be downloaded (CSV format) from the following Kaggle link.
https://www.kaggle.com/eng0mohamed0nabil/population-by-country-2020
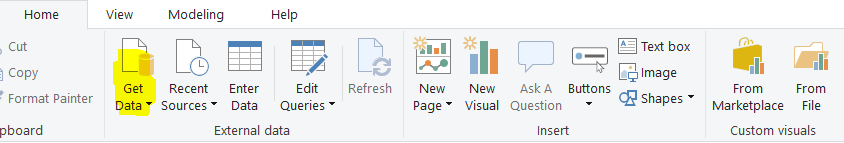
To import the dataset in Power BI, you have to click the “Get Data” option from the top menu of the Power BI dashboard.
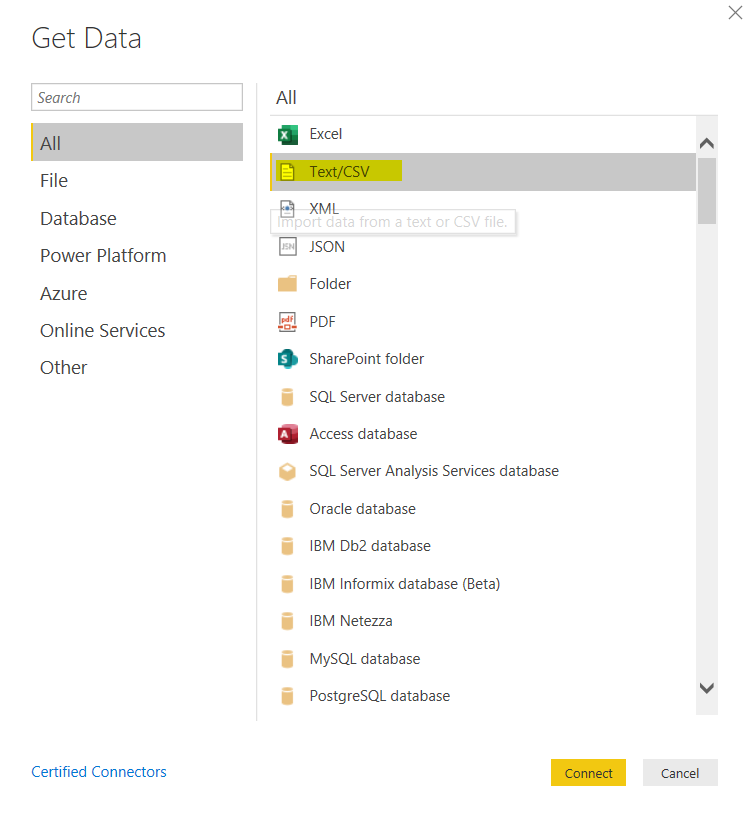
You should see the following dialogue box. This is asking you to specify the type of data that you want to import. You can see that you can import flat files like text, CSV and Excel. You can also import datasets like SQL Server (see this article to see how), and you can also import data from online sources.
Since the dataset is in the CSV format, select the CSV option from the list of data sources and click the Connect button as shown below:
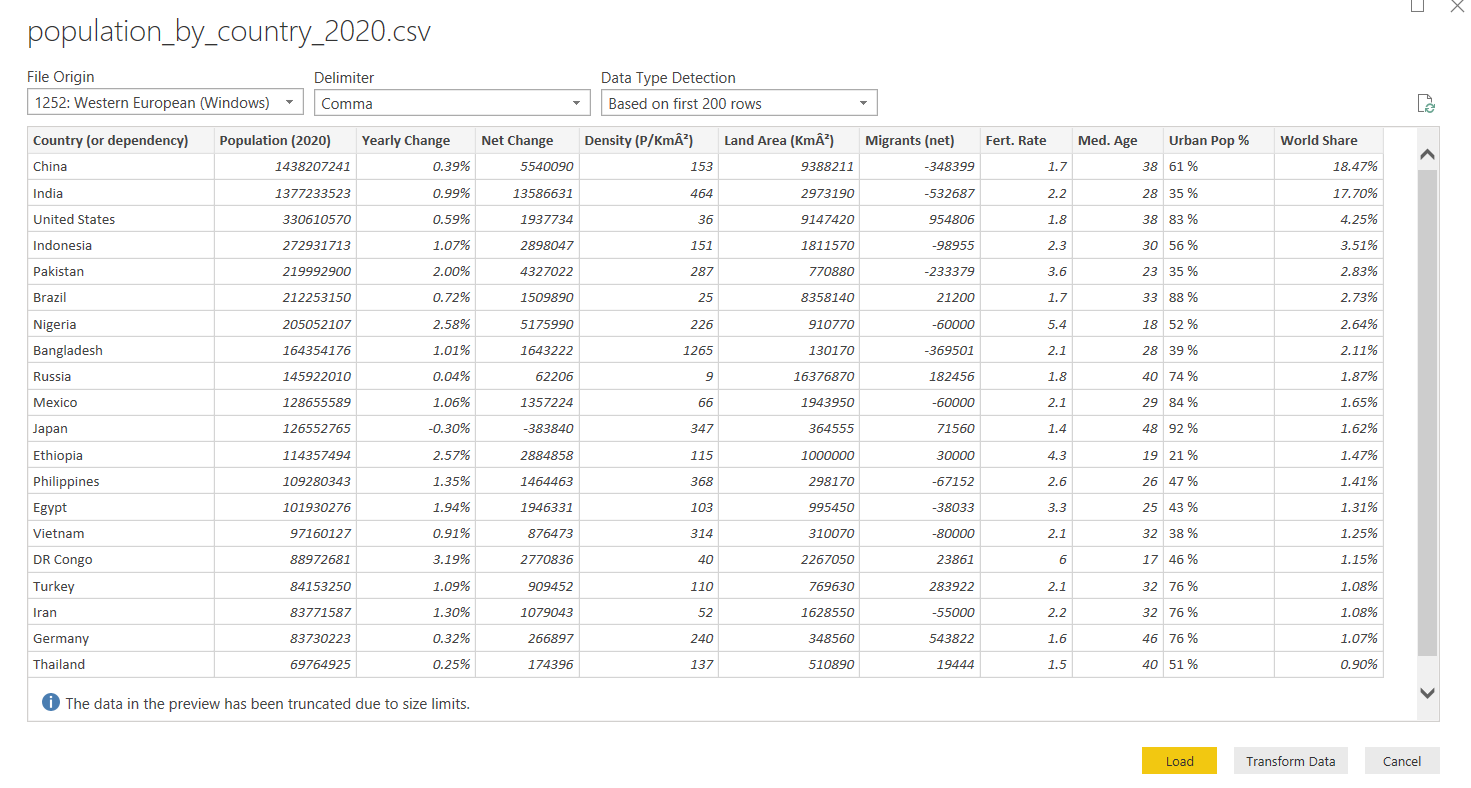
The data will now load into Power BI and should look like the below.
You now have two options:
- You can click the Transform Data button to load the dataset into the Power BI Query Editor, or
- You can click the Load button to load the dataset into Power BI reports view
We will directly load the data into the reports view, so please click the “Load” button.
Creating Reports
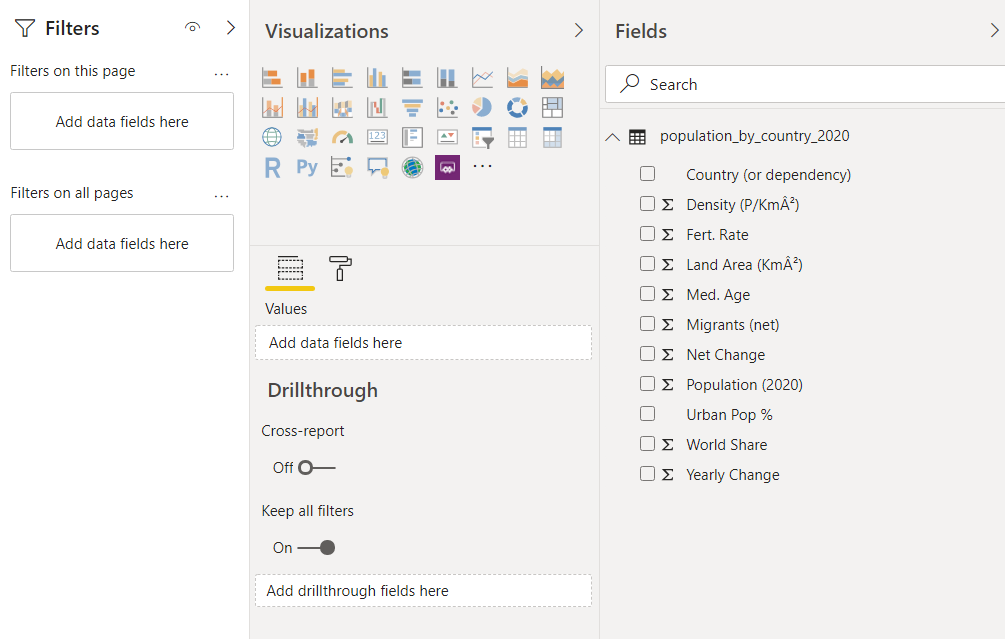
Now that the data is loaded, you should see the reports view. On the left side of the reports view, you can see different types of visualizations that you can add to your report. You can also see the fields of your dataset in the reports view.
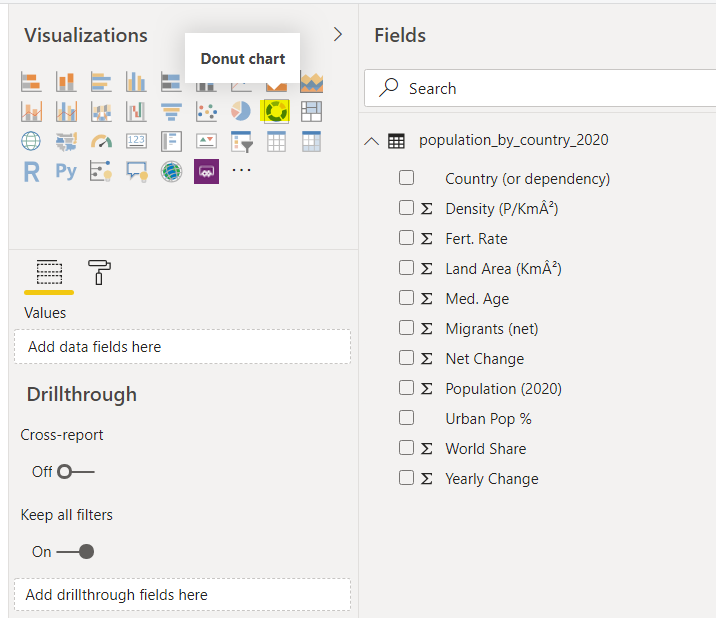
Before you can work with Power BI report themes, you need to create a new report by adding a few visualizations. The first visualization that you will be adding is a donut chart. To do this, select the “Donut chart” option from the list of visualizations as shown below.
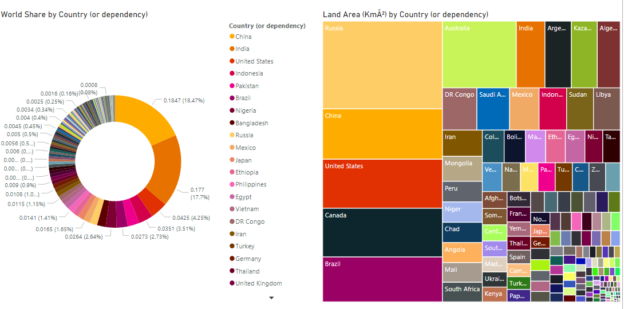
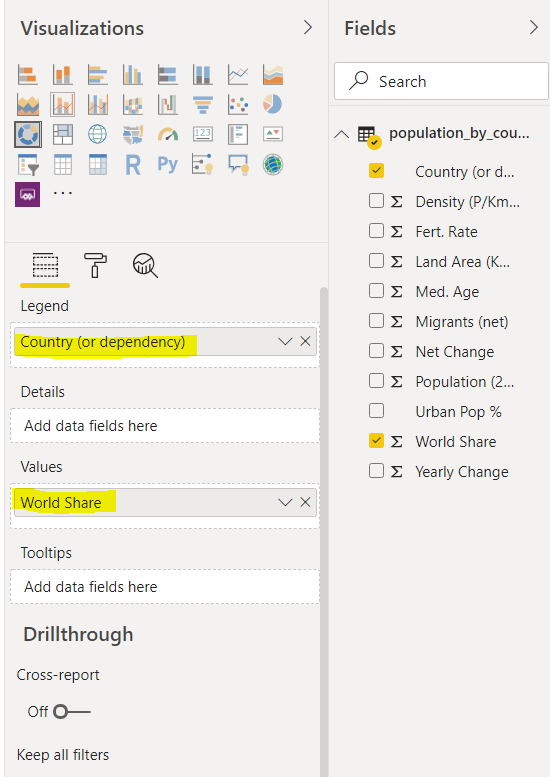
The donut chart that you will plot will show the distribution of populations for all the countries in the world. To plot this chart, drag the “Country or dependency” column from the “Fields” pane and add it to the “Legend” field under Visualizations. Similarly, add the “World Share” column to the Values field.
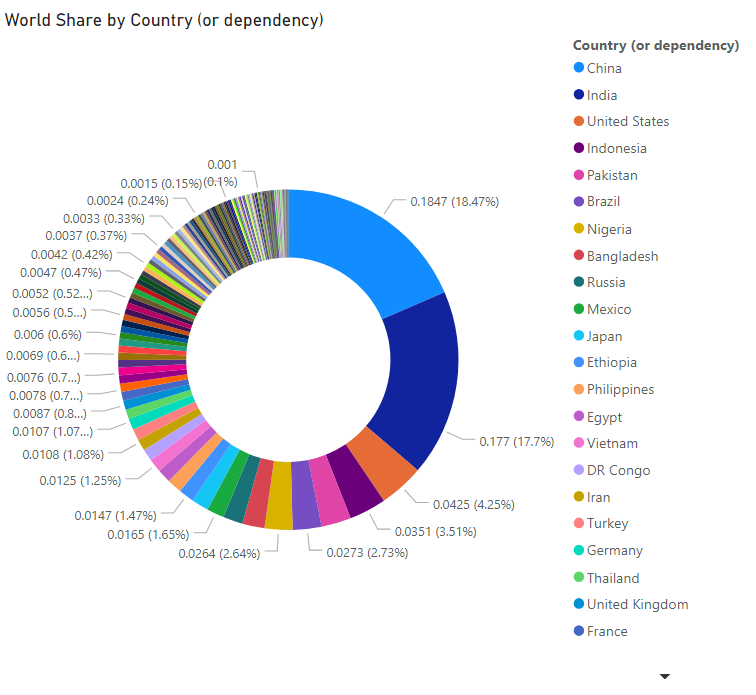
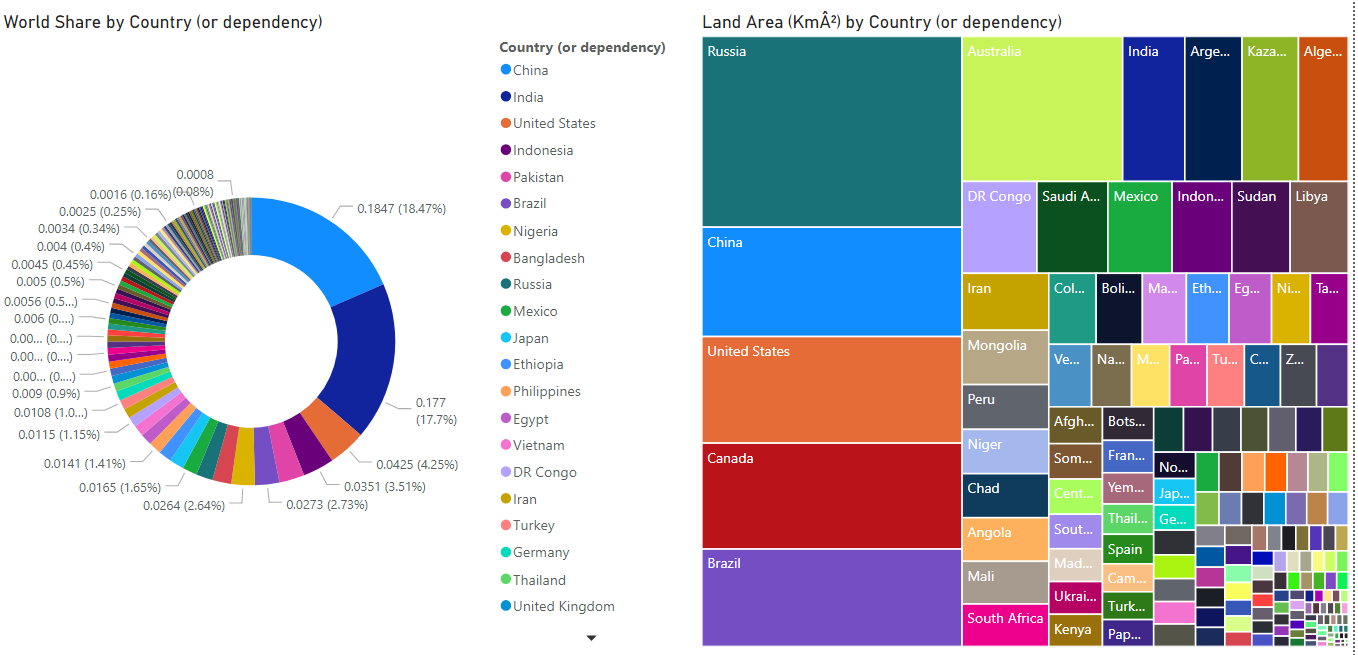
You should see the following donut chart. You can see that China and India have the biggest share of the world population.
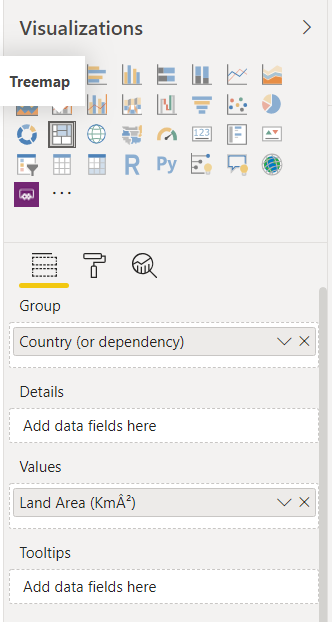
Let’s now add a Treemap that shows the distribution of land area between the different countries of the world. Look at the following screenshot for reference.
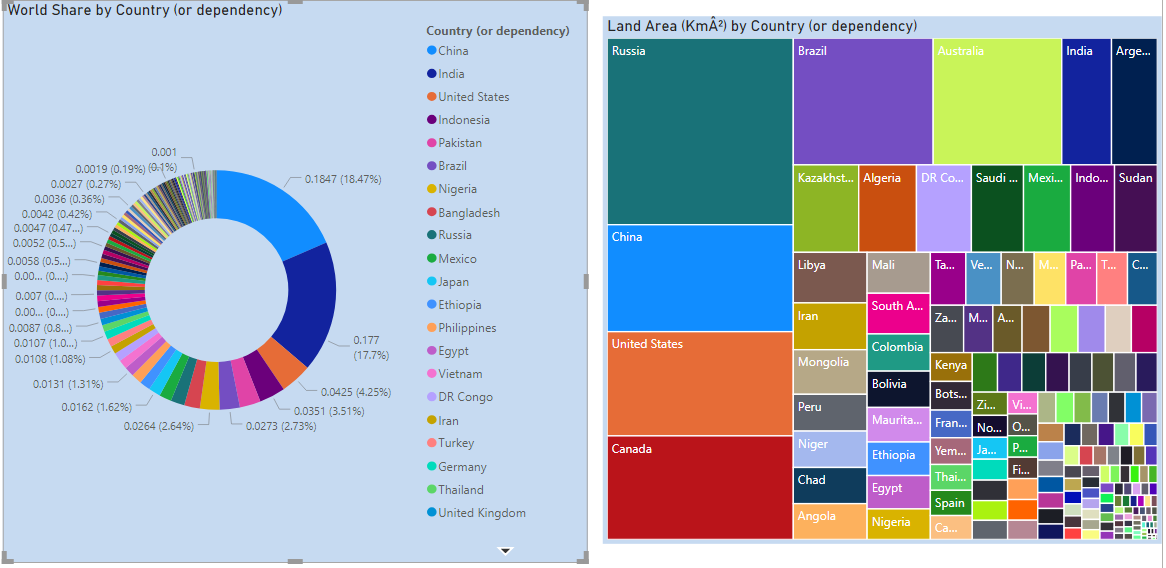
You should now see the following two visualizations in your report.
When it comes to Power BI report themes, you have three options. You can either 1) apply the default themes to all of your plots, 2) you can import built-in themes from other sources, or 3) you can create new themes by customizing existing Power BI report themes.
Default Power BI report themes
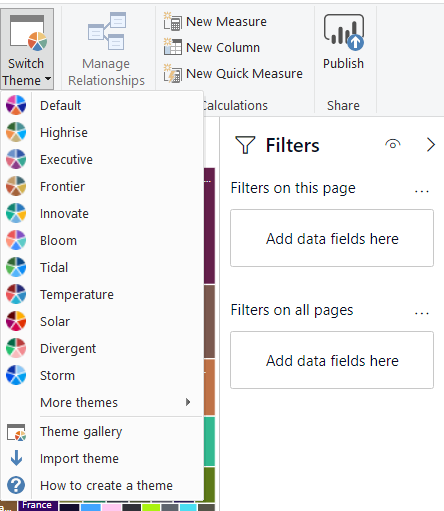
Applying default themes to Power BI reports is extremely easy and straight forward. To do this, click on the Switch Theme button in the top menu. You will see a dropdown list with different theme names as shown below. You can click on any theme to apply it to your reports.
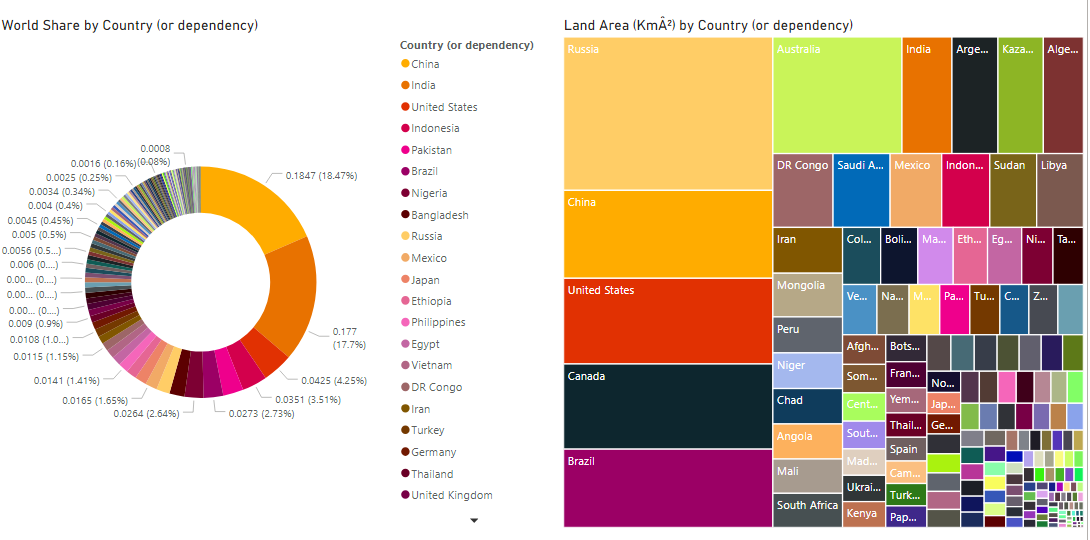
For example, if you apply the Solar theme to your report, you will see that the donut chart and Treemap visualizations look like the ones in the following screenshot.
Importing Themes
In addition to working with default themes, you have an option to import themes from other sources. One of the major sources for importing themes created by other users is the following link:
https://community.powerbi.com/t5/Themes-Gallery/bd-p/ThemesGallery
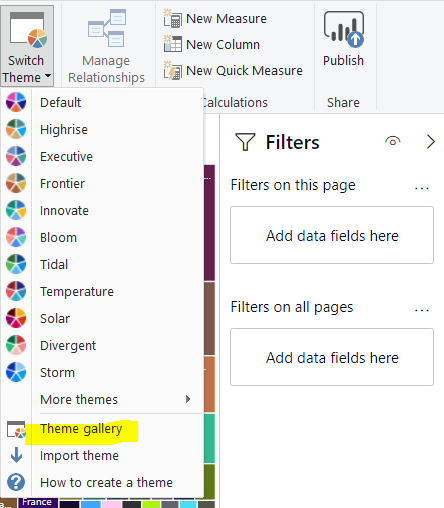
You can directly go to the above link or you can click the “Theme gallery” option from the dropdown list that appears when you click the “Switch Theme” button from the top menu as shown in the following screenshot.
The theme gallery looks like this.
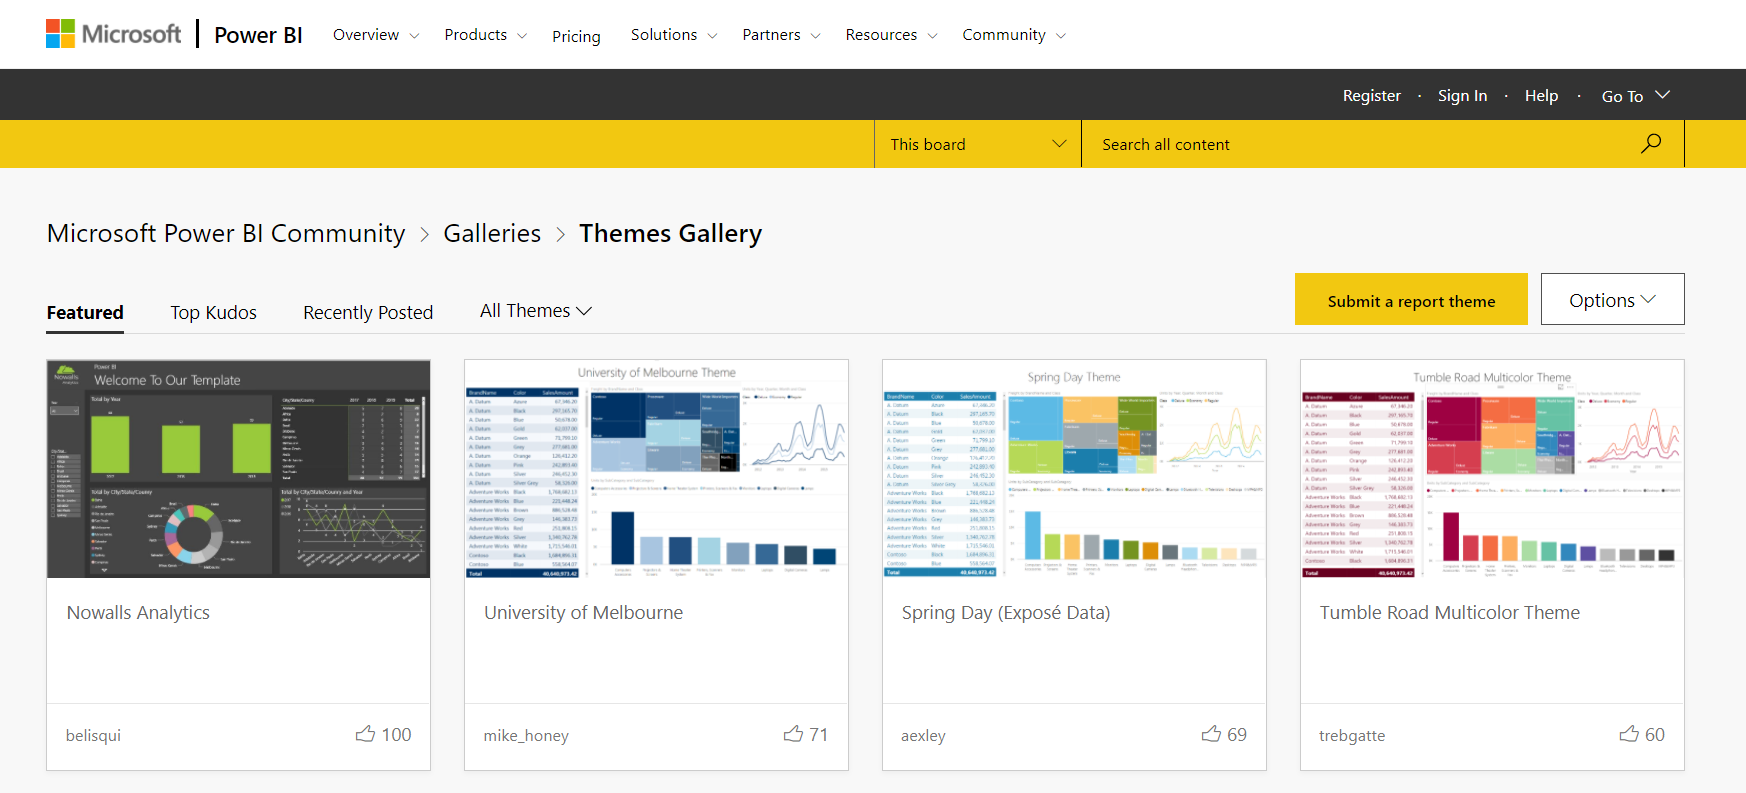
Here you can click on any theme that you want to import. As an example, you will import the “University of Melbourne” theme in this article. Click on the “University of Melbourne” theme from the list of themes as shown in the above screenshot.
You will be taken to the page containing the detail of the “University of Melbourne” theme. If you scroll down, you should see the two options: Power BI Color Theme – University of Melbourn.PNG and Power BI Color Theme – University of Melbourne.json. You need to download the JSON file only by clicking it.

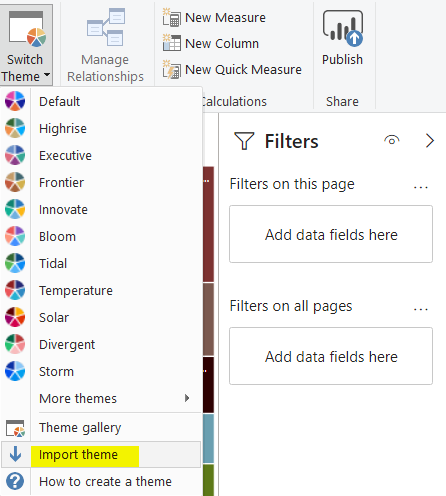
Once you have downloaded the JSON file, the next step is to go to “Switch Theme => Import theme” as shown below:
You will see a file upload dialogue box. Navigate to the location of the “University of Melbourne.json” file that you downloaded earlier and import it.
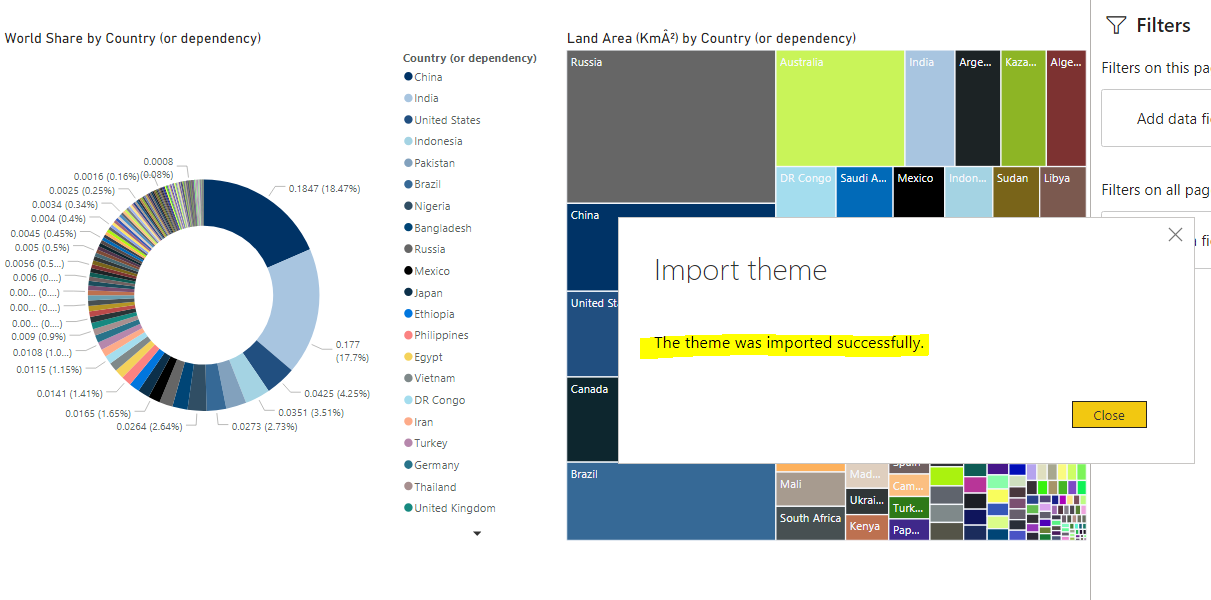
Once you import the file, you will see that your visualizations are updated according to the color scheme of the theme you imported. Also, you will see a dialogue box that states that “The theme was imported successfully”.
Creating a new theme by customizing an existing theme
In addition to using default Power BI report themes and importing themes from other resources, you can customize existing Power BI report themes to create new themes according to your requirements.
Here is how you go about it.
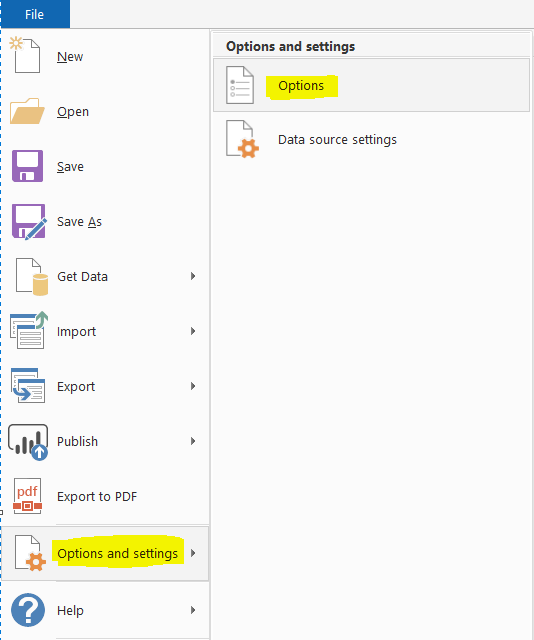
Since you will be creating a new theme by customizing an existing theme, you first have to enable the option to customize existing themes. For that, go to “File-> Options and settings” and then click Options as shown in the following screenshot.
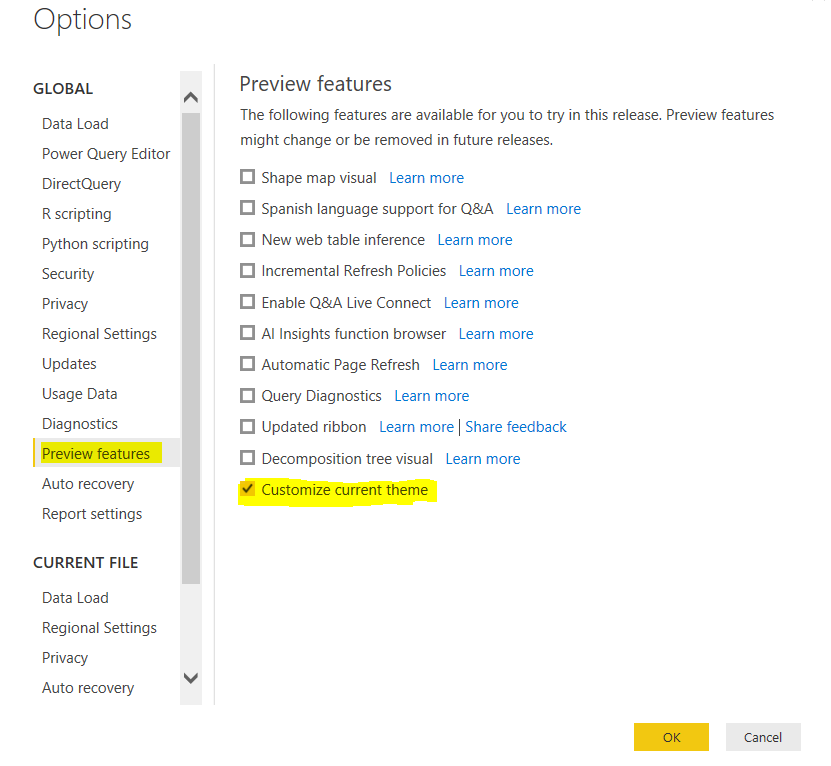
Next, from the list of Global options, select Preview features and then check the checkbox for the “Customize current theme” option. Look at the following screenshot for reference.
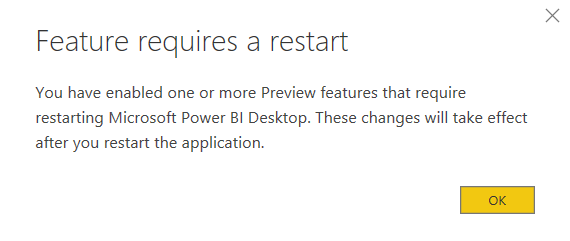
For the settings to take effect, you will have to restart your Power BI as shown by the following pop up.
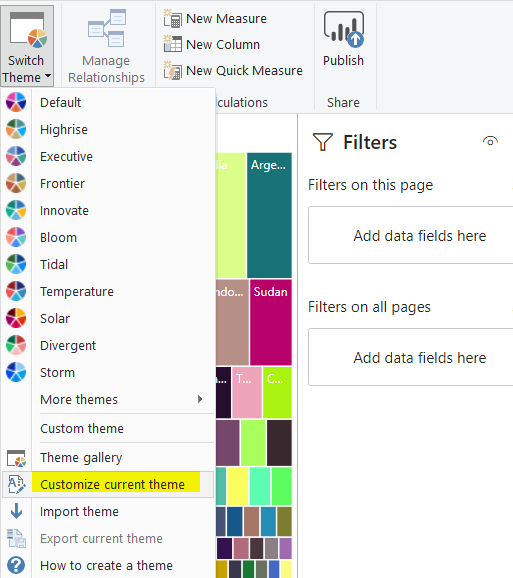
Once you have restarted Power BI select “Switch Theme” from the top menu, you will see an option “Customize current theme”, as shown in the following image. Click this option.
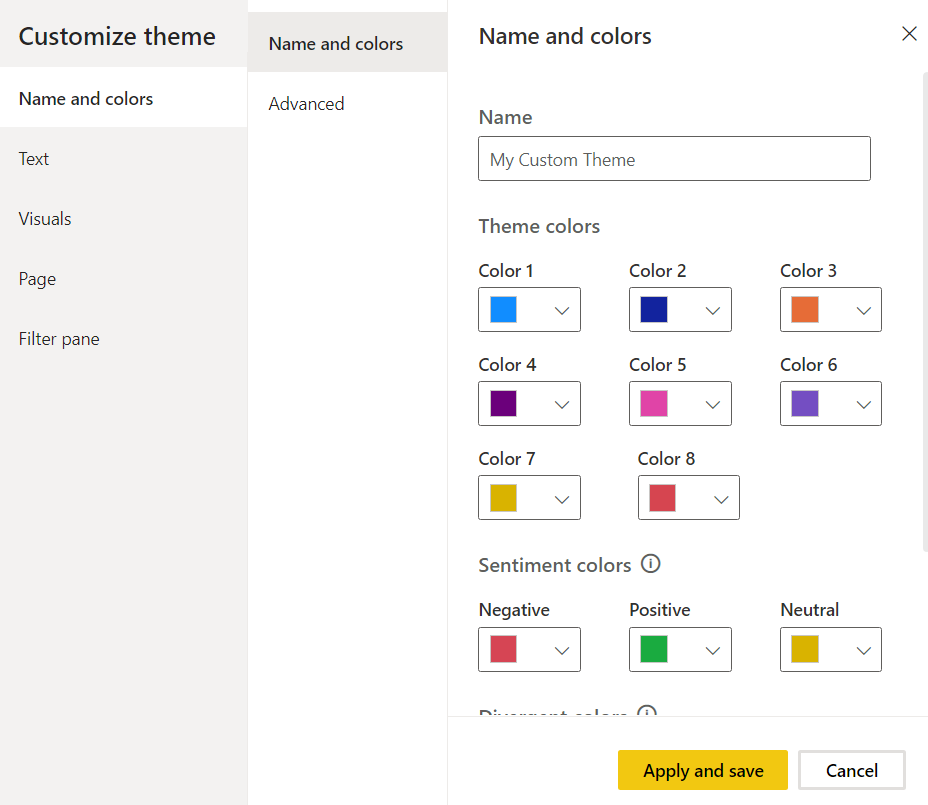
You should see a Customize theme dialogue box as shown below. Here you can enter a name for your customized theme.
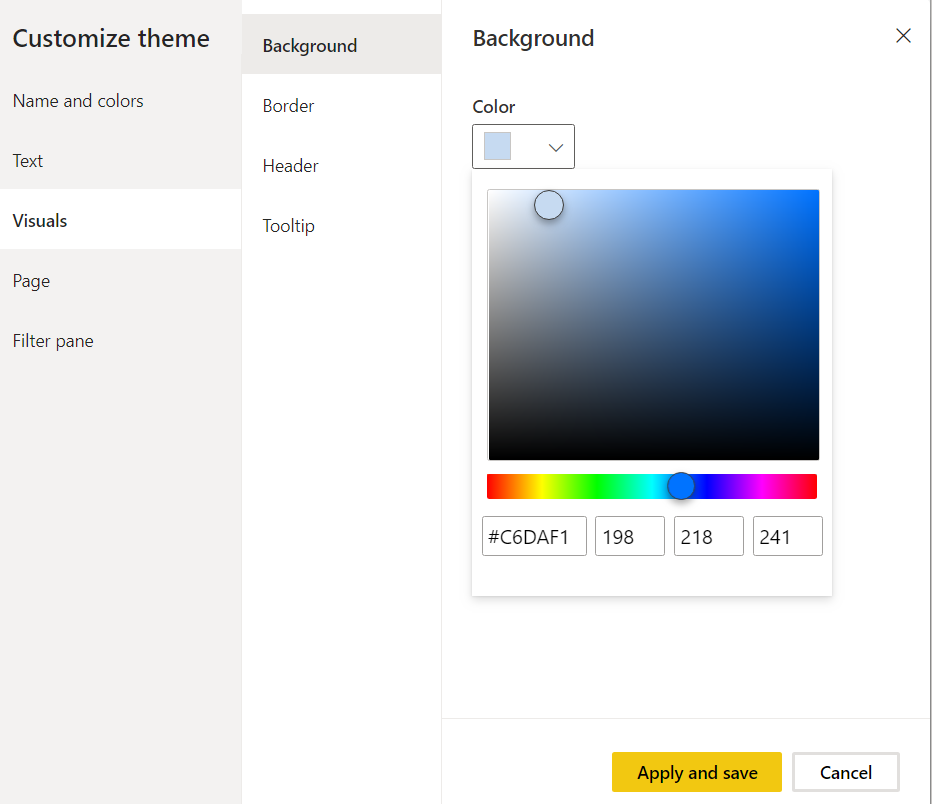
For the sake of this example, let’s only make one change in the existing theme. Click “Visuals” and then change the background color to a light blue. Click the “Apply and save” button. Look at the following screenshot for reference.
The background color for the visualizations will change as shown below.
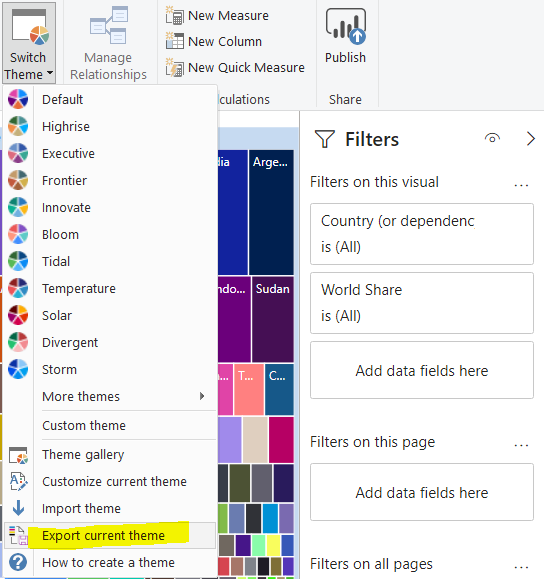
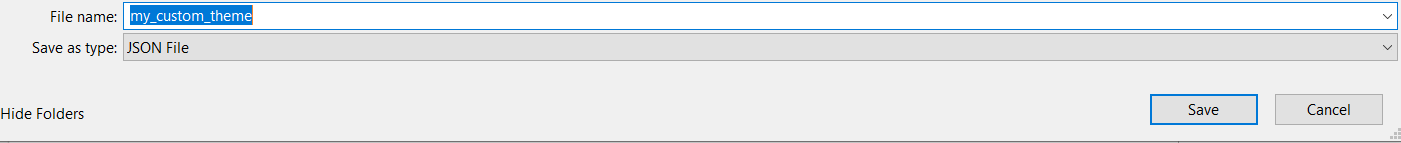
To save your customized theme, click the “Switch Theme” button from the top menu and then click the “Export current theme” button.
Give any name to your theme. Your theme will be saved as a JSON file as shown in the following image.
You can import this theme at any time and use it. You will see that whenever you use this theme, the background color will by default change to the color that you selected while customizing the original theme.
Conclusion
In this article, we learned how you can work with different kinds of report themes in Power BI. You can apply default themes, import built-in themes from other sources, and also can create new themes by customizing existing Power BI report themes.

View all posts by Ben Richardson
- Working with the SQL MIN function in SQL Server - May 12, 2022
- SQL percentage calculation examples in SQL Server - January 19, 2022
- Working with Power BI report themes - February 25, 2021