
Connecting to tables in SQL Server Analysis Service (SSAS) databases is easy. Maybe too easy. The learning curve for developing in a Multidimensional Cube is steep, although a Tabular Model has lessened this curve. The power of encapsulating the business logic of aggregations and analytics into an Analysis Service database is too great not to embrace Analysis Services in an enterprise environment.
The steps for connecting to a table are different between Multidimensional Cubes and Tabular Models. But, they both can use the same optimization techniques. A different tactic must be taken. Cubes separate the dimension tables from the fact tables. The Tabular Model imports or connects to a dimension table just like a fact table.
Connecting to tables in either solution requires the Data Source connection which was covered in the previous article – Connecting Data Source in SQL Server Analysis Services. In the Tabular Model, the same wizard for connecting to a Data Source is used to connect to tables. But, just like the Multidimensional Cube, adding or removing tables can be accomplished later. This seems logical in this day and age of software development. There is always more than one way to get to a solution, but initially a wizard steps through the task for getting started.
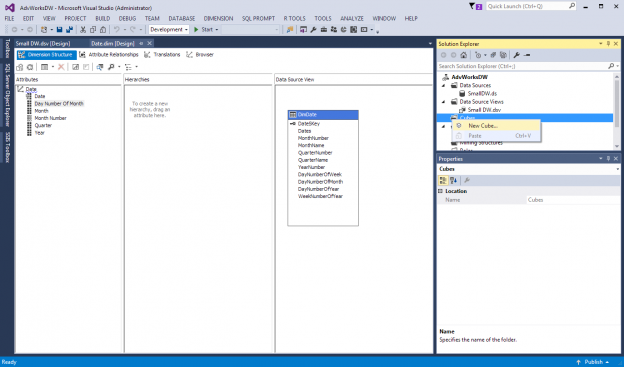
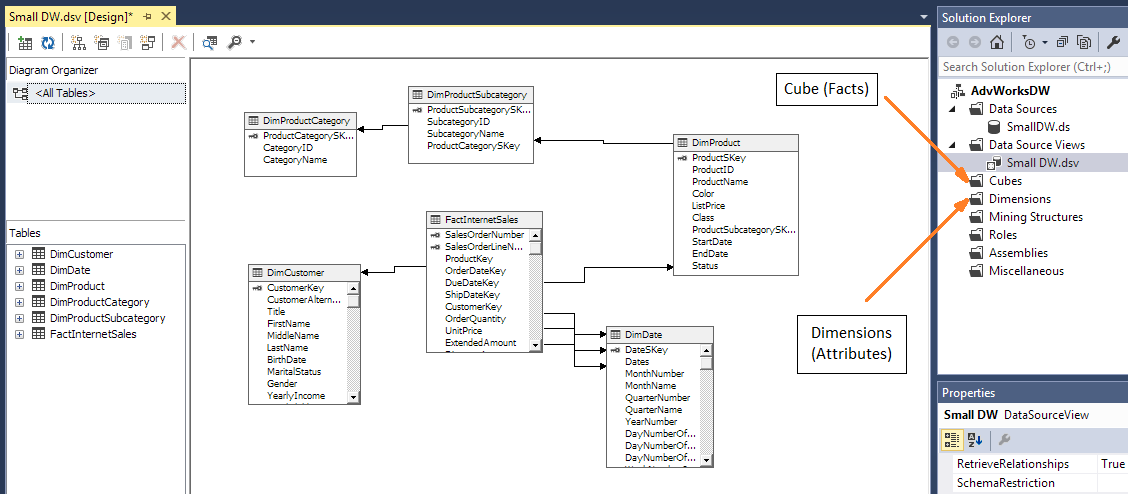
In a Multidimensional Cube, the solution explorer has two folders for creating Dimension Attributes and Fact Measures. The folders in the solution explore are Cubes and Dimensions as shown in Figure 1.
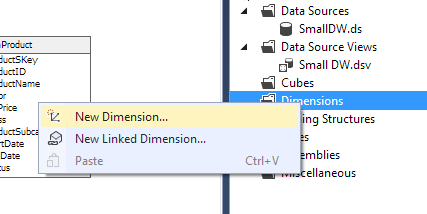
Dimension and Cube creation start wizards to help through the implementation of attributes/hierarchies for dimensions and measure/measure groups for cubes. To start the Dimensions wizard, right-click on the Dimensions folder and select New Dimension… from the submenu like Figure 2.
Like all wizards, the first screen is the welcome window. After reading this descriptive page, click next. Since the table has been modeled in the Data Source View, select Use an existing table and click next. Figure 3 is the Specify Source Information. This screen has the Data Source View and Main Table dropdowns as well as Key Column with associated Name Column for creating a dimension.
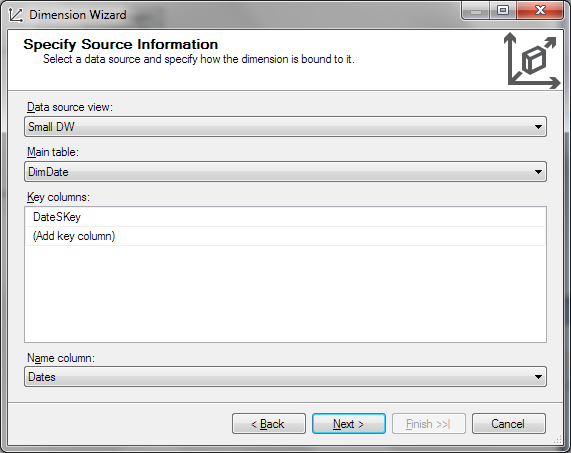
This example will use the DimDate table to create a Dimension. The Key is the surrogate key from the dimension and the name column is the full date column. These are essential for the Date Dimension. Figure 4 will show the Select Dimension Attributes screen.
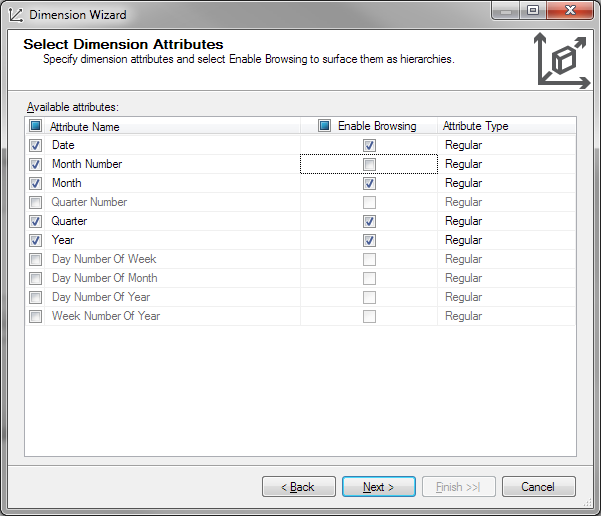
In this example, the Month, Quarter and Year attributes are going to be created. The Month Number is selected but Enable Browsing is deselected. Month Number will be used to sort the Month Name attribute, but does not need to be viewable by the report end user. After selecting the attributes or columns needed for reporting in the cube, we click next to name the dimension Date, not Dim Date, and it is completed.
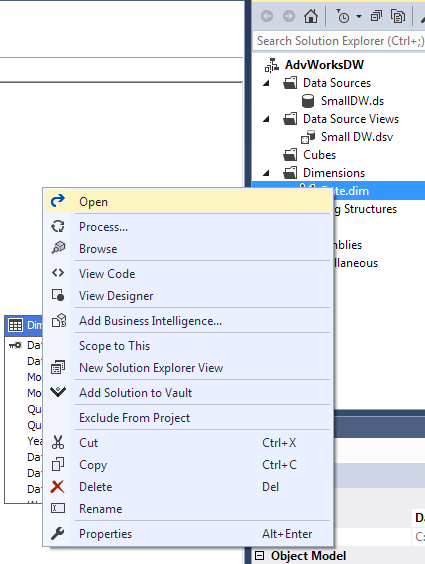
The dimension can be edited by double-clicking the Date dimension in the Dimension folder of the solution explorer or right-clicking on the Date dimension and selecting Open from the submenu.
The Dimension Structure tab has three work areas. The Attributes list has the selected attributes for this dimension. Hierarchies is a place to create a hierarchy like Year/Quarter/Month/Date. The Data Source View shows available tables and columns to be added to the Dimension Attributes.
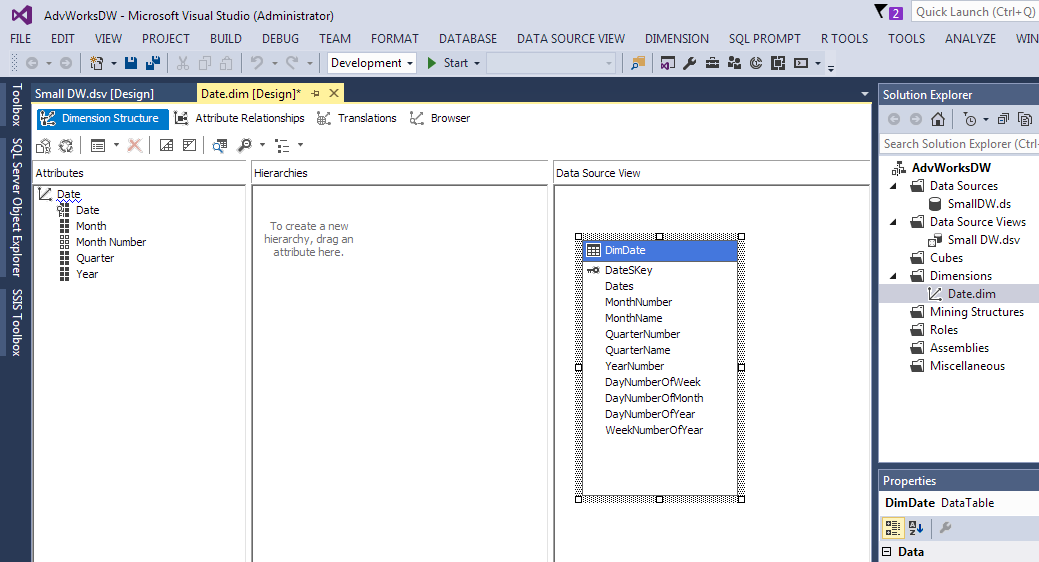
Dragging and dropping the column DayNumberOfYear from the Data Source View work area to the Attributes pane will add this attribute to the Date dimension. This shows that after you use the wizard, there are no limitations to the changes you can make. The wizard is just an assistant to get you started.
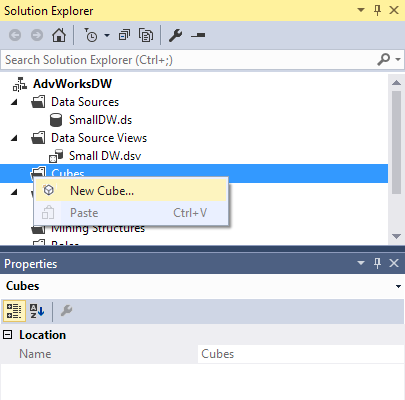
Fact tables contain the measures. A wizard can start this process. Figure 7 shows right-clicking the Cube folder in the solution explorer and selecting the New Cube… submenu.
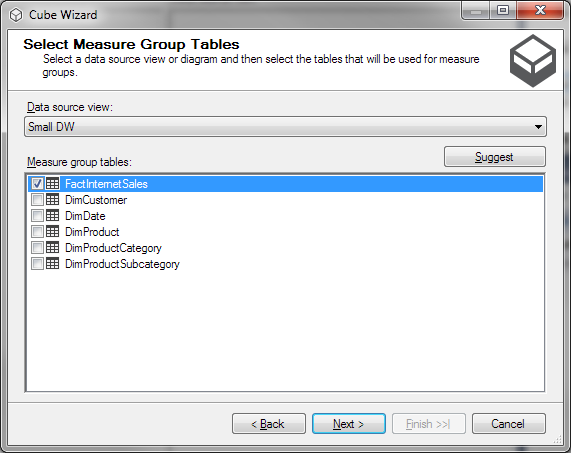
Click next to move past the introduction screen. The first prompt gives options for Using an Existing table, Create an Empty Cube or Generate Tables in a Data Source. Since the database has a fact table, selecting Use existing tables will be the choice before clicking next. The fact table in this example is FactInternetSales like in Figure 8. There is even a Suggest button if the user is not sure. If Suggest is selected, the development environment will make a guess on a table with lots of integer and/or numeric data type columns as the fact table for measures.
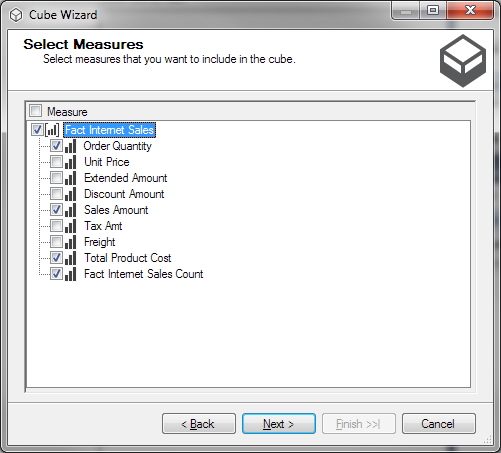
After clicking next, the wizard gives a list of numeric data type columns to add as measure along with a Count column – Fact Internet Sales Count. Deselect the measures not needed right now, and click next. Remember, adding, editing and deleting measures can always be accomplished outside of the wizard.
After clicking next, we are prompted for Dimensions already created in the Project that have a relationship with the fact table selected. Date in this example stays selected and the wizard is continued by clicking next. Then, a list of Dimensions not created that have a relationship with Fact Internet Sales in the Data Source View are selected like Figure 10.
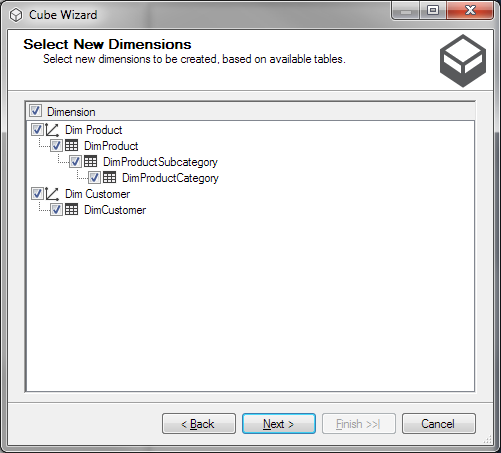
The Dim Product shows DimProductSubcategory and DimProductCategory selected in a related hierarchy view. This means that the new dimensions will be added to the Dim Product dimension created through this wizard and not as individual dimensions. The Dim Customer dimension does not have any related tables.
Clicking next with new Dimensions selected will create “Shell” dimensions with only the Key columns as attributes. Older versions of Analysis Services used to create the new dimension will all columns selected. The last step is to give the cube a name, in this case Internet Sales.
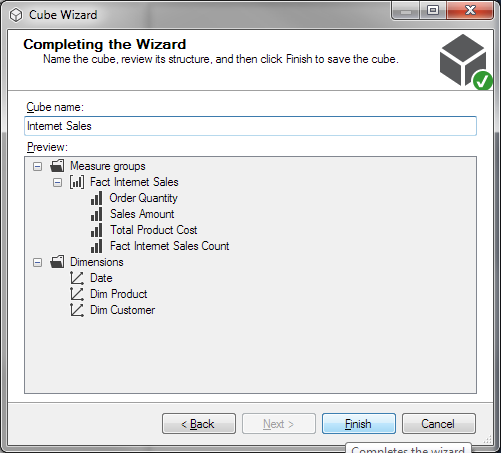
The Cube Structure of the new cube, Internet Sales, shows the new measures Order Quantity, Sales Amount, Total Product Cost and Fact Internet Sales Count listed in the Measure pane like Figure 12.
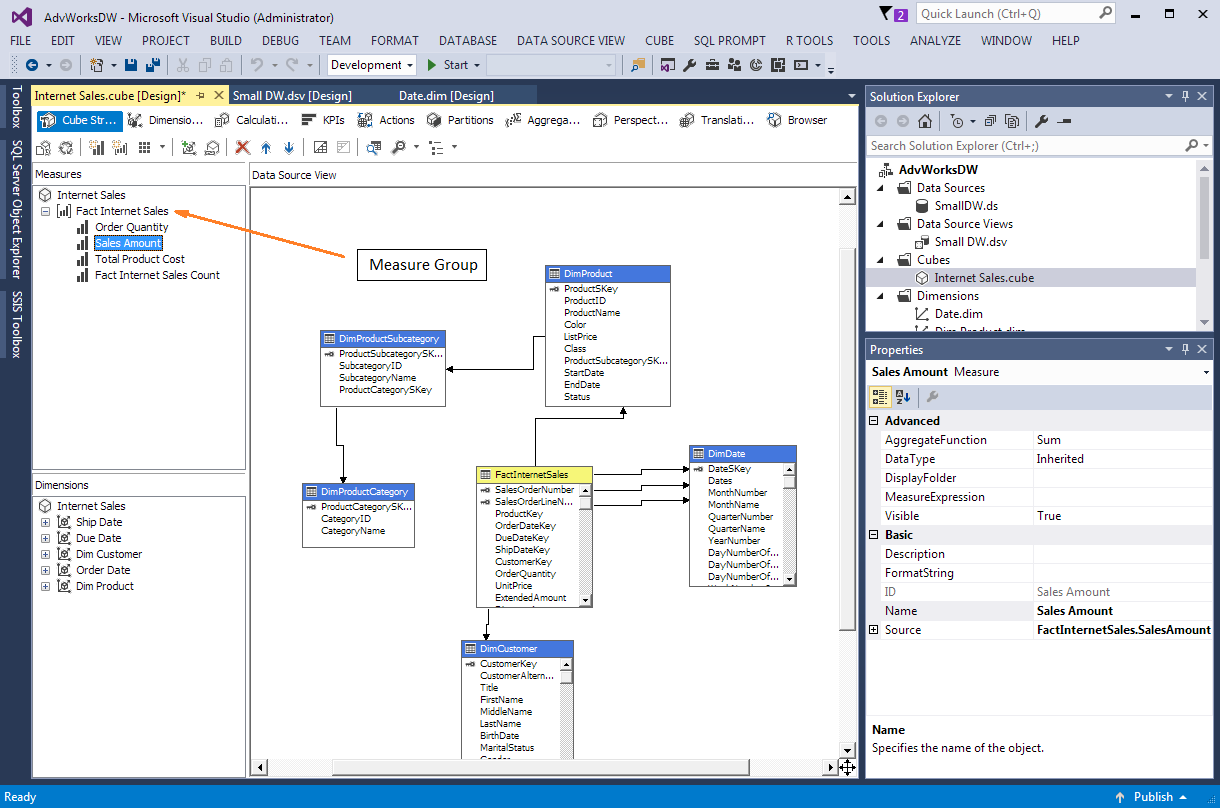
Measure and Measure Groups can be renamed by right-clicking and selecting Rename from the Submenu. In this example, we will rename measure group Fact Internet Sales to Internet Sales. Measure Fact Internet Sales Count will be renamed Internet Sales Count.
So, creating a cube with measures and dimensions with attributes are a little time consuming with Multidimensional Cubes, but well worth it to consolidate business rules into an Analysis Service database. Do not be alarmed with the wizards, they are there to help step through the initial creation of a Multidimensional Cube. More work can be done with editing properties and using relationships and calculated measures to enhance the cube, but wizards are the starting point to developing cubes with SSAS.
Other articles in this series:- SQL Server Data Warehouse design best practice for Analysis Services (SSAS)
- Connecting to Data Source(s) with SQL Server Analysis Services
- Analysis Services (SSAS) Cubes – Dimension Attributes and Hierarchies
Useful links

Starting as a developer in COBOL while at LSU, he has been a developer, tester, project manager, team lead as well as a software trainer writing documentation. Involvement in the SQL Server community includes speaking at SQLPASS.org Summits and SQLSaturday since 2011 and has been a speaker at IT/Dev Connections and Live! 360.
Currently, he is the Chair of the PASS Excel Business Intelligence Virtual Chapter and worked on the Nomination Committee for PASS Board of Directors for 2016.
View all posts by Thomas LeBlanc
- Performance tuning – Nested and Merge SQL Loop with Execution Plans - April 2, 2018
- Time Intelligence in Analysis Services (SSAS) Tabular Models - March 20, 2018
- How to create Intermediate Measures in Analysis Services (SSAS) - February 19, 2018