
For someone new to SQL Server Analysis Services, a decision must be made on whether to use a Multidimensional Cube or Tabular Model. Both types can be installed on the same server, but they must be different instances. That could mean additional license costs. But, with the developer’s edition, both can be installed and reviewed before a production decision is made. Data Source connections are the first step to review with both versions.
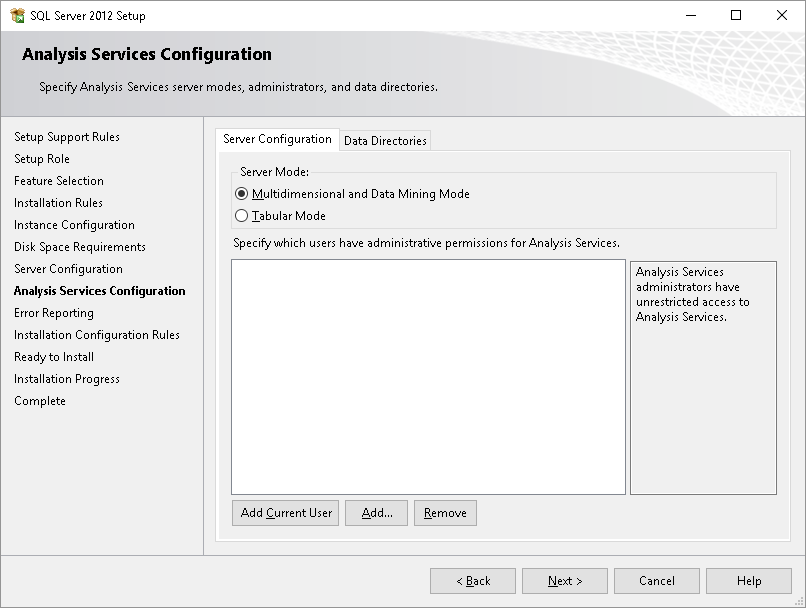
Figure 1 shows the option during installation to pick the type of Analysis Service.
The first step with a Cube or Tabular Model is to pick a connection or connections to data sources. The connection properties are very similar, but the retrieval of the data through tables or table-like sources is a little different. Both allow multiple connections. The cube can layout the relationships a little better with Data Source Views. Multidimensional also allows multiple cubes in one project, whereas Tabular has only one model – for now. The Tabular Model does have a relationship view, but you cannot separate different views of the relationships like a Data Source View in a cube.
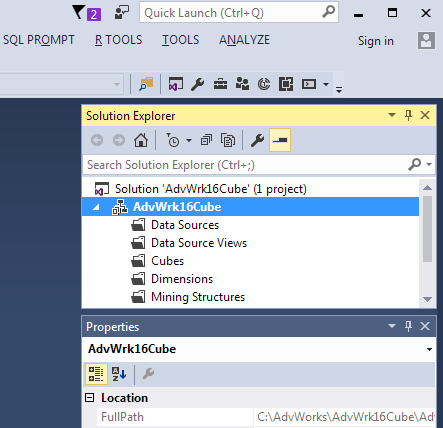
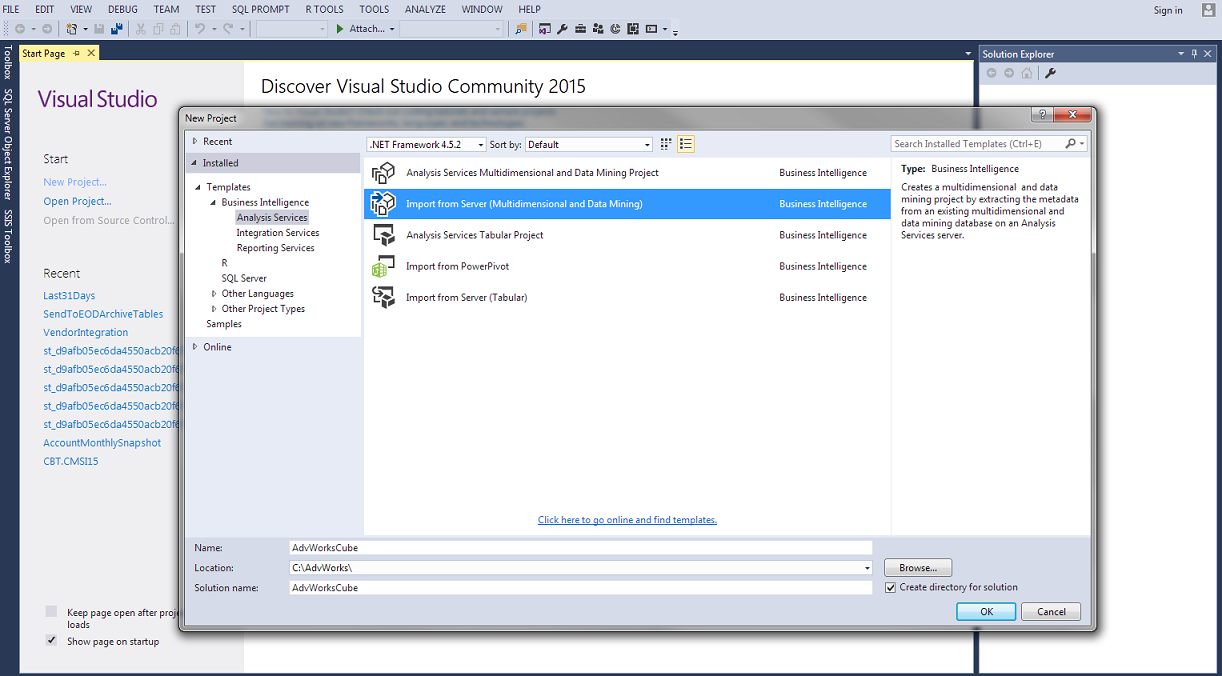
Figure 2 shows Visual Studio creating a Multidimensional Cube project while Figure 3 shows the solution explorer of this new project.

To add a connection to the project, right-click the Data Sources folder in the solution explorer and select New Data Source… The Data Source Wizard will step through the needed selections for the connection. This is from where the data mart or data warehouse gets selected. Well-designed dimensional models will have all fact and dimension tables within one database. But, there are times where shared dimensions are in different databases like a Master Data Management System.
After selecting the Instance and database to connect, the Impersonation Information appears like in Figure 4.
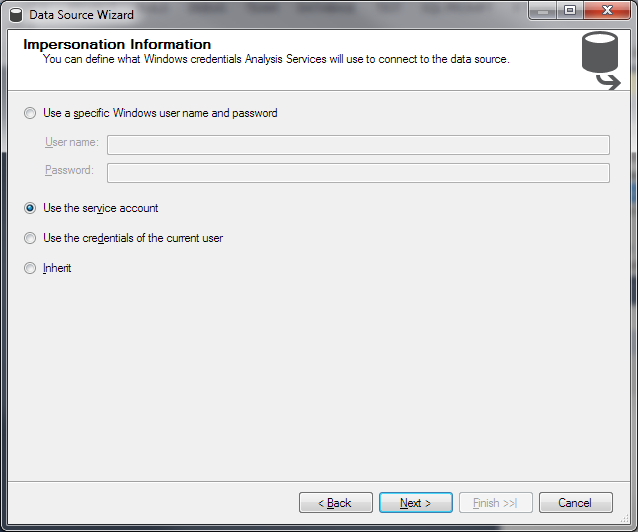
The best practice for Impersonation Information is selecting Use the service account. The service account running the Analysis Service’s service will need to have access to the source data. This relieves the option of having to use a name and password or using the current user permissions for processing.
System Administers in IT today prefer services run from an Active Directory account. This enables a better and more secure system. The requirement to frequently change those passwords also pinpoints where the password needs to be changed: at the service.
To select the tables needed for a cube, the Data Source View or Views need to be created. Right-click on the Data Source View (DSV) folder in the solution explorer and select New Data Source View… The wizard will step through the selecting of the Data Source previously created followed by the tables.
Figure 5 shows the fact and related dimension tables needed for a cube. FactInternetSales contains the measures while tables like DimCustomer and DimDate contain the attributes needed to slice and dice data. Customer and date will become dimensions in the cube.
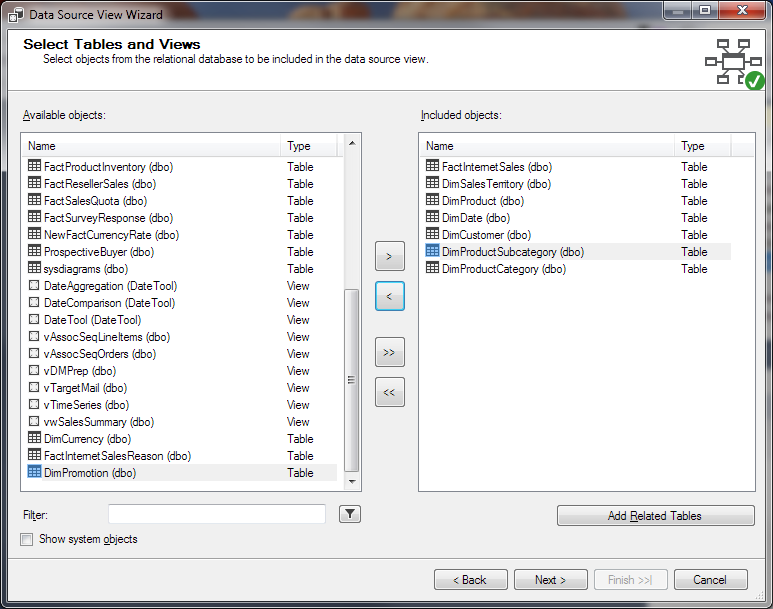
The final part is to give the DSV a name. InternetSales is used in this example because the fact table FactInternetSales and related dimension tables have been selected.
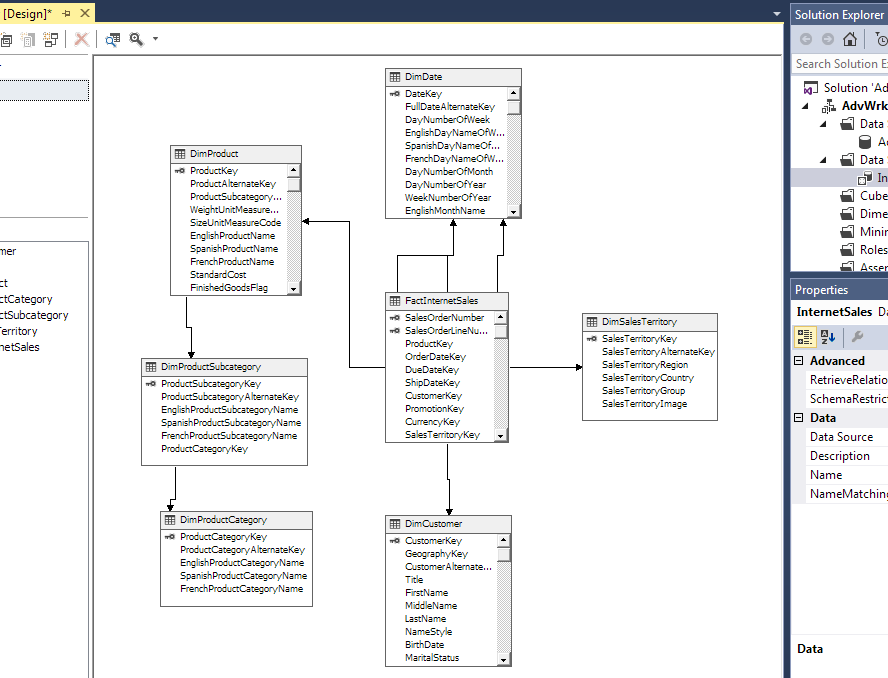
Figure 6 shows the relationships retrieved from the foreign keys between FactInternetSales and the related dimension tables like DimSalesTerritory or DimCustomer.
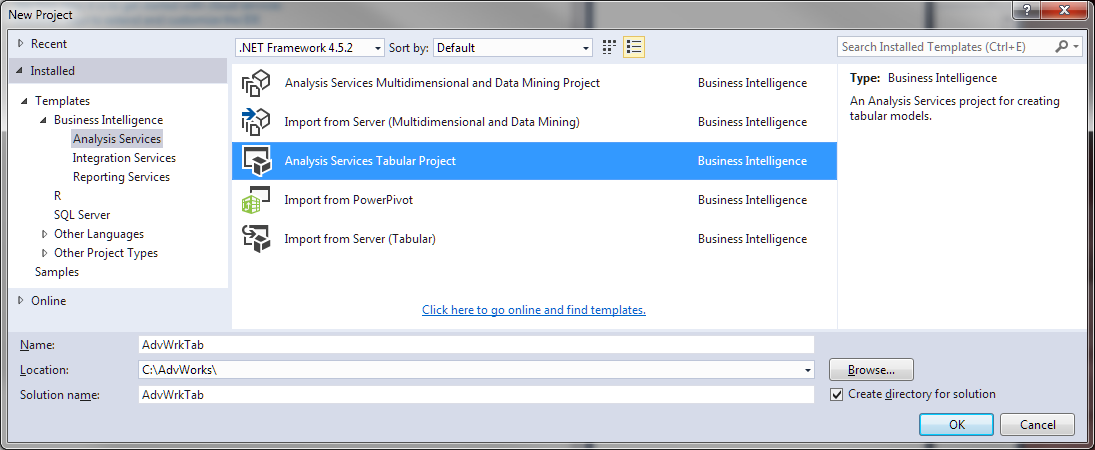
A Tabular Model uses a similar way to connect to the data, but the tables are loaded and listed in a different way. Figure 7 has the creation of a project for a tabular model.
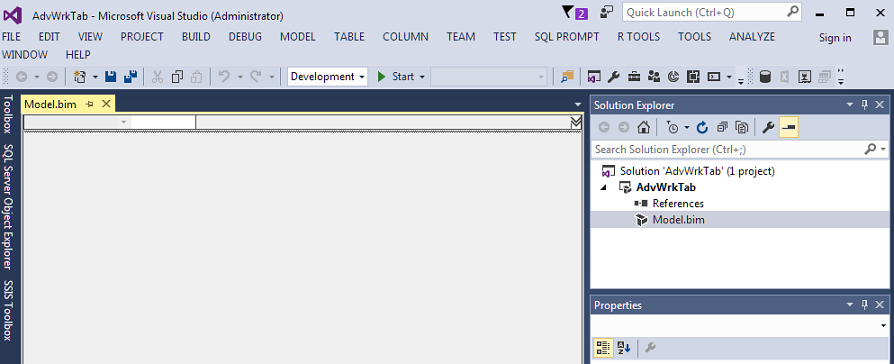
The tabular project has a solution explorer like a cube project, but you do not have the folders for Data Source or Data Source View. Instead, you have a file called Model.bim and a work area that looks like Excel.
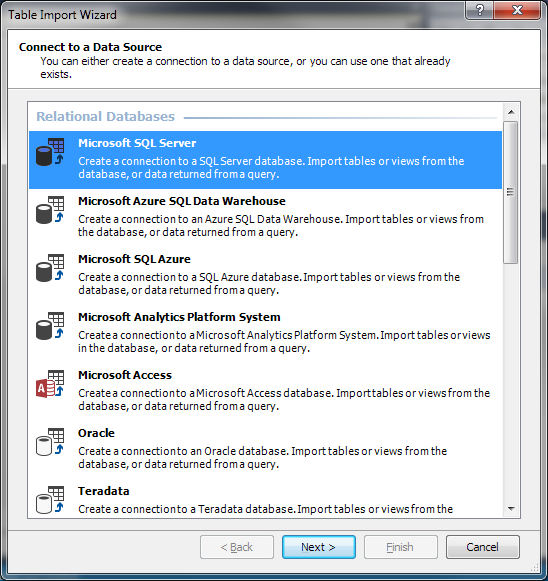
To make a connection to a database, go to the Model menu choice and select Import From Data Source. The list of available connection types will display with Microsoft SQL Server being the first. This example uses the same database as the Multidimensional Cube project. Selecting next in the Table Import Wizard will proceed to the connection string.
The Tabular Model actual imports the data into the model to start development. Multidimensional uses connections to the table(s) and does not “import” until you process the cube for viewing. This is a big difference. It does not make one better than the other, but it does bring to light that care must be taken not to pull too much data while developing because things could get very slow.
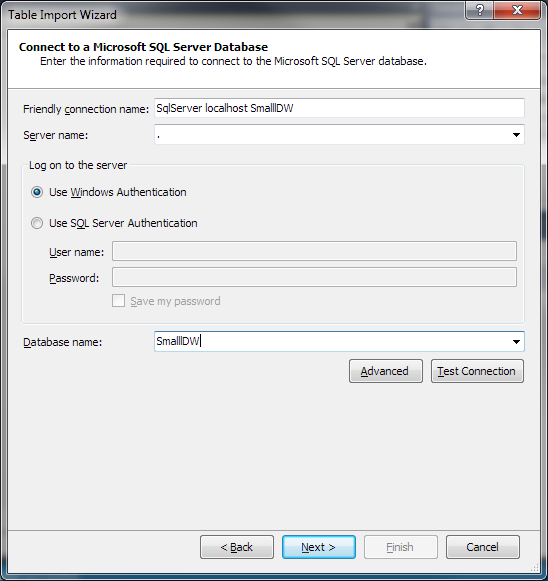
The server name, authentication and impersonation information are the same in both versions because it involves a basic connection string. Entering the server name, database name and windows authentication is your best bet as well as using a Service Account for impersonation like previously discussed with cubes.
Once the connection information is provided, Figure 11 shows the selecting of tables.
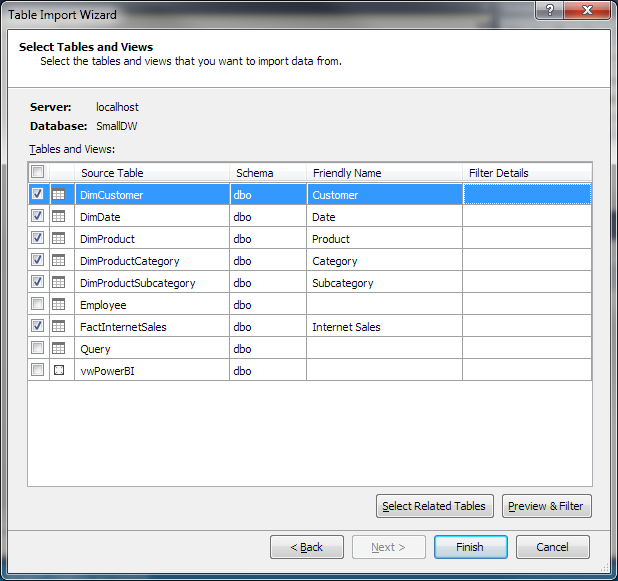
The wizard has an option to provide a friendly name to the dimension and fact tables. The Filter Details helps with limiting the amount of data imported as well as columns used in model. The model might not need all columns from all tables and this is the step where that can be limited. It does not prevent the selection of columns later in the development process.
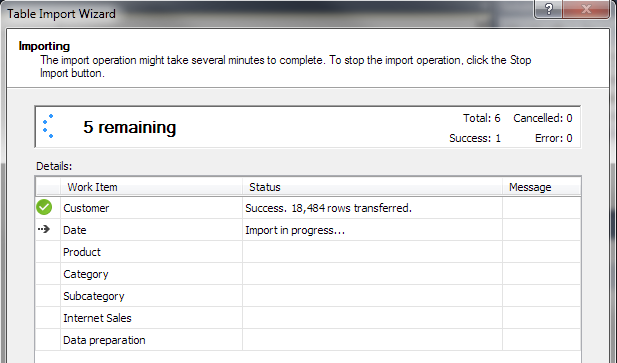
Figure 12 shows the progress with importing the data into the project. The model will now be able to use column store compression technology to present the data to the developer. Having the data during the development of the model enables quick viewing of the effects of changes, unlike the Multidimensional Cube, which requires a deployment before viewing the effects of additions or changes.
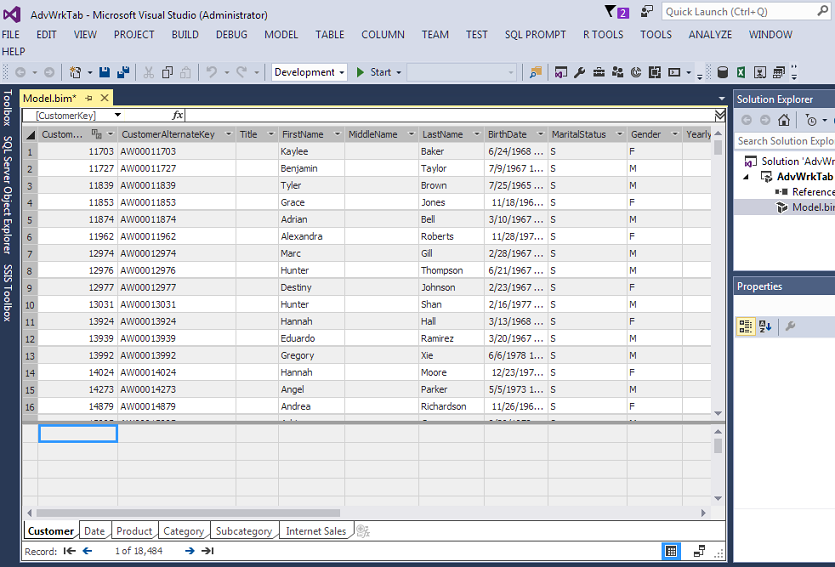
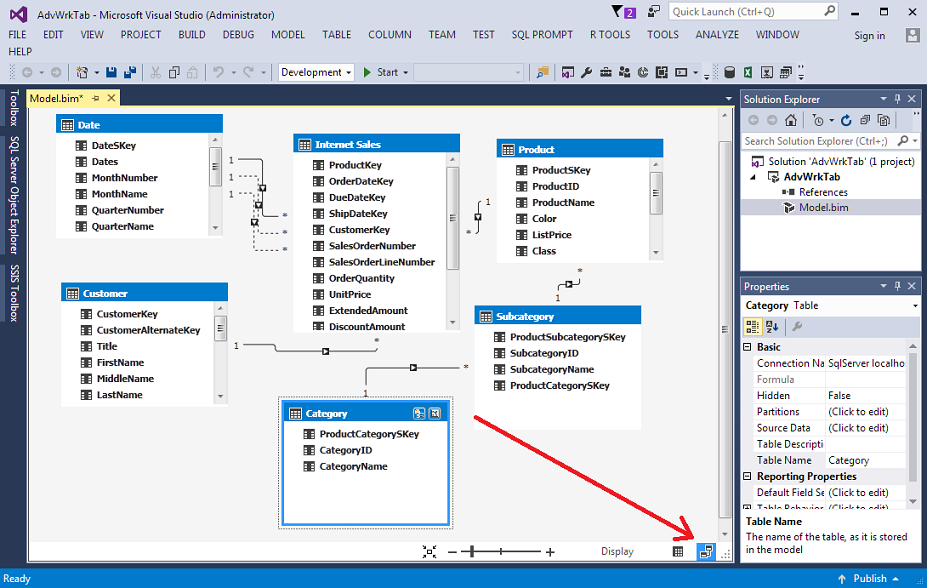
Figure 13 shows the tabs like Excel for viewing the data from each table. There is an icon in the bottom right that enables a relationship view like the Data Source View for cubes.
These examples can help a new developer differentiate the beginning of Analysis Services development and whether the user wants to use a Tabular Model or a Multidimensional Cube. It also helps a Multidimensional Cube developer understand some of the differences in starting a new project using a Tabular Model. Both methods have useful techniques and a thorough analysis of both might be necessary before a production decision is made.
NOTE: The developer’s edition is now free to anybody if you download SQL Server Developer’s Edition with Service Pack 1. To download for free SQL Server 2016 Developer’s edition without the service pack, you must sign up for Visual Studio Essentials.
Other articles in this series:
- SQL Server Data Warehouse design best practice for Analysis Services (SSAS)
- Initial Attributes and Measures in SSAS Multidimensional Cubes
- Analysis Services (SSAS) Cubes – Dimension Attributes and Hierarchies
Useful links
- Microsoft SQL Server Developer Edition is now free
- Set Impersonation Options (SSAS – Multidimensional)
- Supported Data Sources (SSAS – Multidimensional)
- Data Sources Supported (SSAS Tabular)

Starting as a developer in COBOL while at LSU, he has been a developer, tester, project manager, team lead as well as a software trainer writing documentation. Involvement in the SQL Server community includes speaking at SQLPASS.org Summits and SQLSaturday since 2011 and has been a speaker at IT/Dev Connections and Live! 360.
Currently, he is the Chair of the PASS Excel Business Intelligence Virtual Chapter and worked on the Nomination Committee for PASS Board of Directors for 2016.
View all posts by Thomas LeBlanc
- Performance tuning – Nested and Merge SQL Loop with Execution Plans - April 2, 2018
- Time Intelligence in Analysis Services (SSAS) Tabular Models - March 20, 2018
- How to create Intermediate Measures in Analysis Services (SSAS) - February 19, 2018