
In this article, we’ll discuss some tips and best practices regarding the design of OLAP cubes in Analysis Services Multidimensional (SSAS). Most tips – if not all – are applicable for SSAS 2008 to 2016 (and later most likely). Since Analysis Services Tabular – the in-memory columnstore OLAP database from Microsoft – is a completely different design experience, it will not be included in this article.
The list provided is not exhaustive. Whole books can be written about the subject, so a selection must be made. The tips in this article are considered by the author as basic needs for any cube design. However, as usual, best practices are only useful as a rule of thumb. Sometimes it can be necessary to deviate from the general rule.
Examples and screenshots in this article are created using the AdventureWorks 2014 Enterprise sample OLAP cube, which can be downloaded from Codeplex.
Data Source and Data Source View
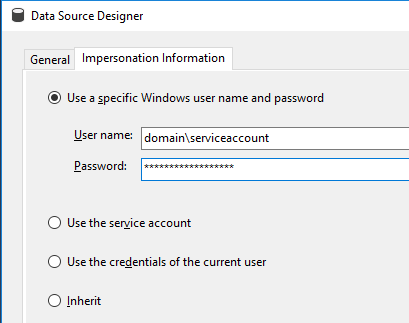
If possible, use a domain service account to access the data source as it is the most secure option. The service account option can be used as well, if for example the SSAS service is already configured using a domain account. However, it’s a good idea to separate the two, as the data source only needs read access to a specific source and nothing more.
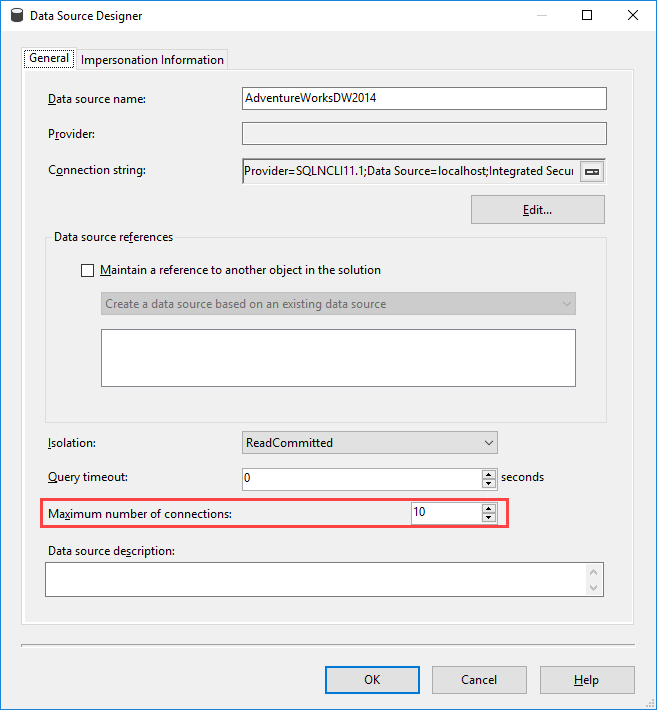
Note you can also change the maximum number of connections to the data source. If your source allows high concurrency and you have many process cores available, you can consider changing this to a higher number to have more parallel processing.
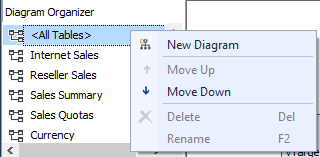
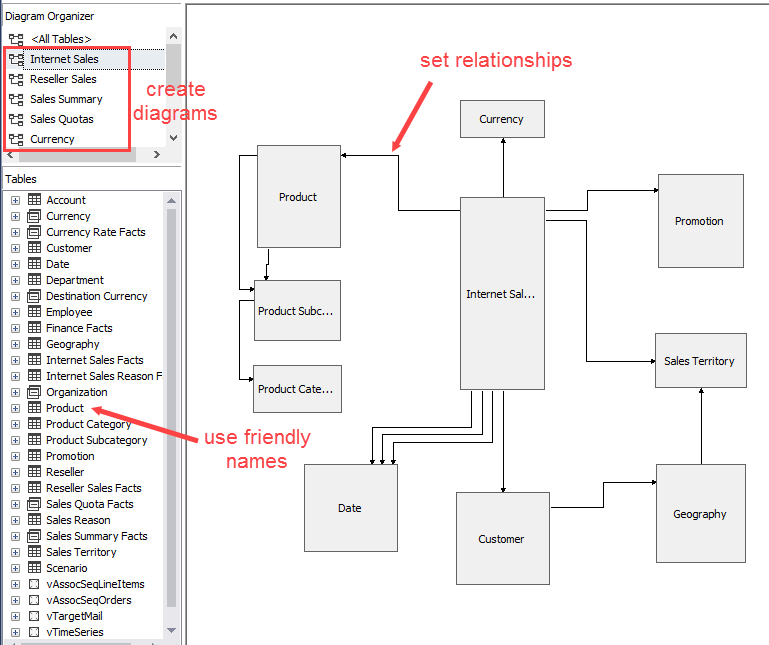
In the data source view, you can already create the relationships between the fact table and the dimensions. This will help you later when building the cube: the dimension usage tab will already be prepopulated. Also create a diagram for each star schema (one fact table + related dimensions). This will declutter the overall view and it will be easier to make changes to the model at a later point in time. For example: you have added a new dimension table to the data source view and you want to create a new relationship. If you have a large model with hundreds of tables, this can be a challenging task. You can create a new diagram by right-clicking the All Tables node in the Diagram Organizer.
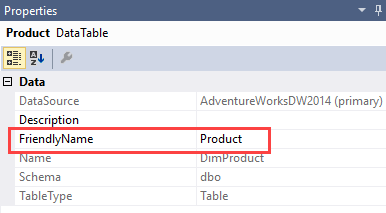
Finally, assign user friendly names to the tables. This might seem unnecessary since users don’t see the DSV directly. However, any dimension or measure group is created from a table in the DSV. If they already have decent names, you won’t need to rename them during the creation process. If you forget to change the name of such an object, you can still do it after the creation, but this means the ID of the object (which doesn’t change) and the actual name will differ. This can be annoying when scripting out certain aspects of the cube using XMLA. You can find the FriendlyName property in the properties window of a table in the DSV:
To recap:
The most important rule of the DSV: do not create calculations! Keep calculations in your source – typically a data warehouse – and use the DSV is a layer to define relationships and friendly names. There are a couple of reasons for this:
- It’s inherently messy to write code in the DSV: there is no Intellisense or parsing of code.
- The business logic is hidden. It’s difficult to see if a table is a reference to an existing table/view or a named query. This makes debugging harder. If a measure in the cube doesn’t have the expected value, it takes a while before you end up in the DSV.
- The generated SQL doesn’t always guarantee optimal results. When you write your SQL statement inside a view, you have more control over the final SQL statement.
For these reasons, it is recommended to create any calculations or data type conversions either directly in the ETL that populates the data warehouse or in the form of views on top of the DWH.
Cubes
One or more cubes
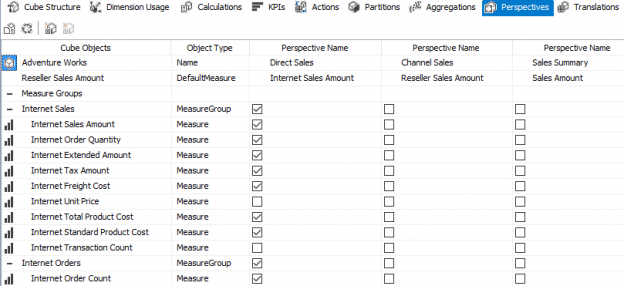
Are you going to build one cube containing all your star schemas, or rather multiple cubes where each cube contains exactly one data mart? There is no right or wrong answer here; it depends. The advantage of multiple cubes is easier maintenance and development. The advantage of one large cube is that you can drill across fact tables (in other words, combine multiple measure of multiple fact tables in one visualization). All calculations are defined in the same place, but development of a larger cube might be more difficult, especially when it comes to security. You can also logically split up a large cube using perspectives, which makes things less confusing and overwhelming for end users. Keep in mind this is an Enterprise feature.

The general rule is as follows: if you want to combine measures of multiple fact tables, you almost have no other choice than to build one large cube. However, if your data marts are truly independent of each other, you can build individual cubes. The last option has the consequence you can only report on one single cube in a Power BI Desktop report (although you can combine multiple visualizations from multiple cubes in a Power BI dashboard).
Measures
Two main guidelines:
- Less is more. If you don’t need a measure, don’t include it. Having too many measures is not only confusing for end users, but can also take up more caching space.
- If you can calculate it in advance, please do so. For example, you can calculate currency conversion in the cube itself, but performance will be better if the calculations are already done in advance. The same is true for easy measures like A + B. You can do these in the ETL or in a SQL view. Keep the cube for calculations which are hard to do in SQL (because they depend on filter context), such as year-to-date, ratios and moving averages.
Some other tips:
- Measure expressions tend to be faster than regular calculated measures.
- Try to replace LastNonEmpty measure (which is a semi-additive measure) by LastChild measures (also semi-additive). These are typically faster because they can scan the latest partition if your measure group is partition by time.
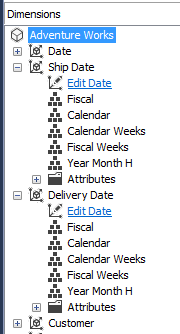
- My personal preference is to have distinct dimensions instead of role-playing dimensions. For example, you can have one date dimension, but add it multiple times as a cube dimension. In the next screenshot, you can see the date dimension has been added twice: one time for Ship dates and one for Delivery Dates.
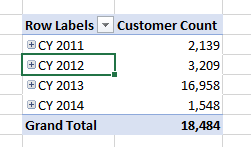
The problem is that all attributes of both dimensions have the same names. If you drag Calendar onto a Pivot Table, it’s hard to see from which dimension it came (depending on the reporting tool it’s easy to track down or not). You can easily solve this by creating multiple views in the source.
Partitioning
The concept of partition has been discussed in the following articles:
- How to partition an SSAS Cube in Analysis Services Multidimensional
- Benefits of Partitioning an SSAS Multidimensional Cube
I’ll just summarize the main benefits:
- Faster processing due to parallelism
- Faster scans of the data due to parallelism
- Optional partition elimination if partitions are set-up correctly and if the query supports it. For example, if you partition your data by month and you only need the data for the last month, only one partition is read which can lead to huge performance savings.
Aggregations
Another potential query performance improvement is building aggregates. Suppose your data is kept at the daily level. If you build aggregates on the monthly level, this can lead to performance improvements when you report on the monthly or yearly level. For example, if you require data for one month, you can just read the aggregates. If you require data on the year level, you just need to add 12 months. Adding 12 numbers together is much faster than aggregation all the source data.
You can build aggregations using a wizard.
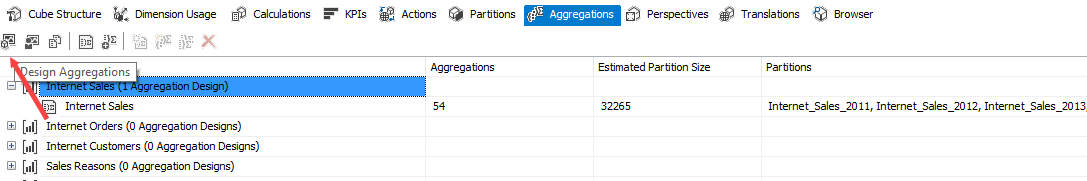
SSAS will use the combination of heuristics and dimensions properties to decide for which dimension attributes aggregations should be build. For more info, check out Aggregations and Aggregation Designs on docs.microsoft.com.
Another option is to use the Usage Based Aggregation Wizard, which will use information from sampled queries to build aggregations specific to solve the needs of those queries. Since these aggregations are build using actual query data, they will likely be more effective than the aggregations build by the previous wizard. Keep in mind user query patterns might change over time, so it’s a good idea to periodically rerun this wizard.
Conclusion
This article discussed some best practices around the data source view and the building of a cube in Analysis Services Multidimensional. Remember best practices are not carved in stone, but are rather general guidelines. To recap:
- Keep your cube user friendly and don’t bloat it with too many dimension attributes and measures. Only build what you need.
- If you can build functionality (a calculated attribute or a measure) in a previous layer – such as the data warehouse – please do. Try to avoid development in the data source view.
- Partition your cube and build aggregations on those partitions. Revisit those aggregations from time to time.
Next articles in this series
- Analysis Services (SSAS) Multidimensional Design Tips – Creating Dimensions
- Analysis Services (SSAS) Multidimensional Design Tips – Relations and Hierarchies
Reference Links
- Designing Aggregations
- SSAS Usage-Based Optimization, OlapQueryLog (Enabling and Disabling), Aggregations and Structure Changes
- Analysis Services MOLAP Performance Guide for SQL Server 2012 and 2014

Koen has over 7 years of experience in developing data warehouses, cubes, and reports using the Microsoft BI stack. Somehow he has developed a particular love for Integration Services along the way.
He has a blog at http://www.sqlkover.com and he is a frequent speaker at local SQL Server events. You can find him on Twitter as @Ko_Ver.
View all posts by Koen Verbeeck