
In the previous article, How to schedule Azure Data Factory pipeline executions using Triggers, we discussed the three main types of the Azure Data Factory triggers, how to configure it then use it to schedule a pipeline.
In this article, we will see how to use the Azure Data Factory debug feature to test the pipeline activities during the development stage.
Why debug
When developing complex and multi-stage Azure Data Factory pipelines, it becomes harder to test the functionality and the performance of the pipeline as one block. Instead, it is highly recommended to test such pipelines when you develop each stage, so that you can make sure that this stage is working as expected, returning the correct result with the best performance, before publishing the changes to the data factory.
Take into consideration that debugging any pipeline activity will execute that activity and perform the action configured in it. For example, if this activity is a copy activity from an Azure Storage Account to an Azure SQL Database, the data will be copied, but the only difference is that the pipeline execution logs in the debug mode will be written to the pipeline output tab only and will not be shown under the pipeline runs in the Monitor page.
Debug an Azure Data Factory Pipeline
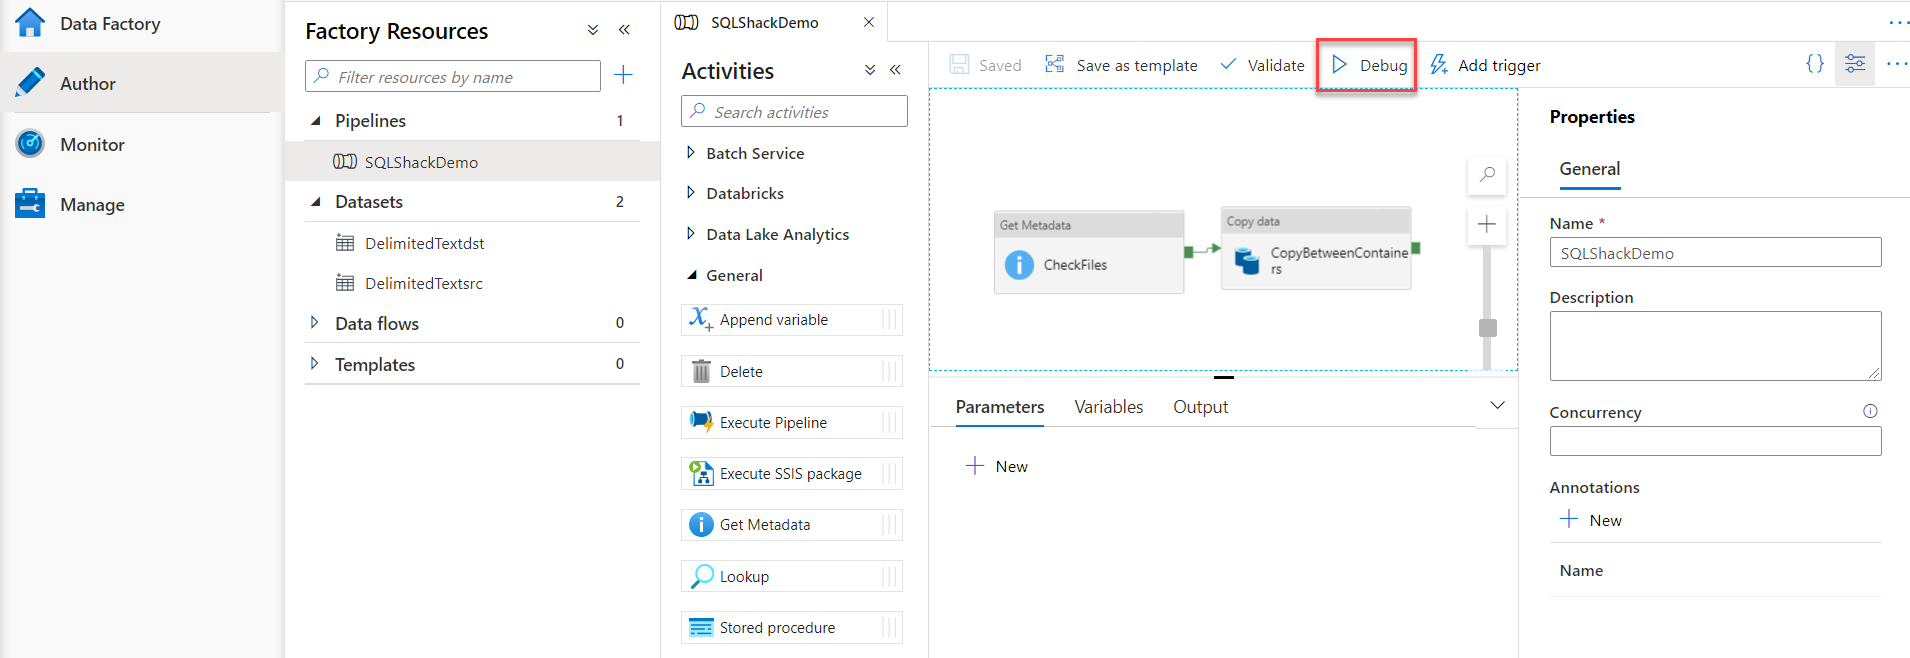
To run an Azure Data Factory pipeline under debug mode, in which the pipeline will be executed but the logs will be shown under the output tab, open the pipeline under the Author page and click on the Debug button, as shown below:
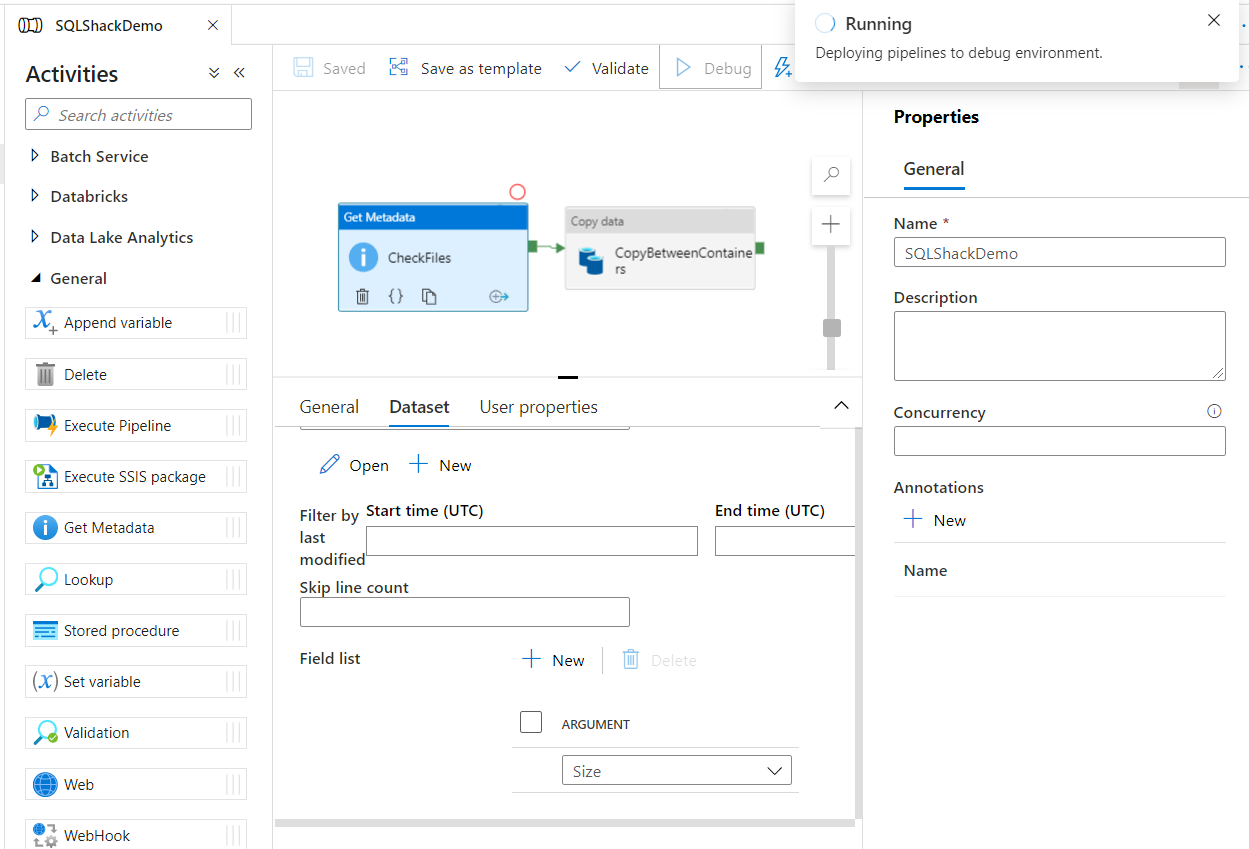
You will see that the pipeline will be deployed to the debug environment to run under debug mode as shown below:
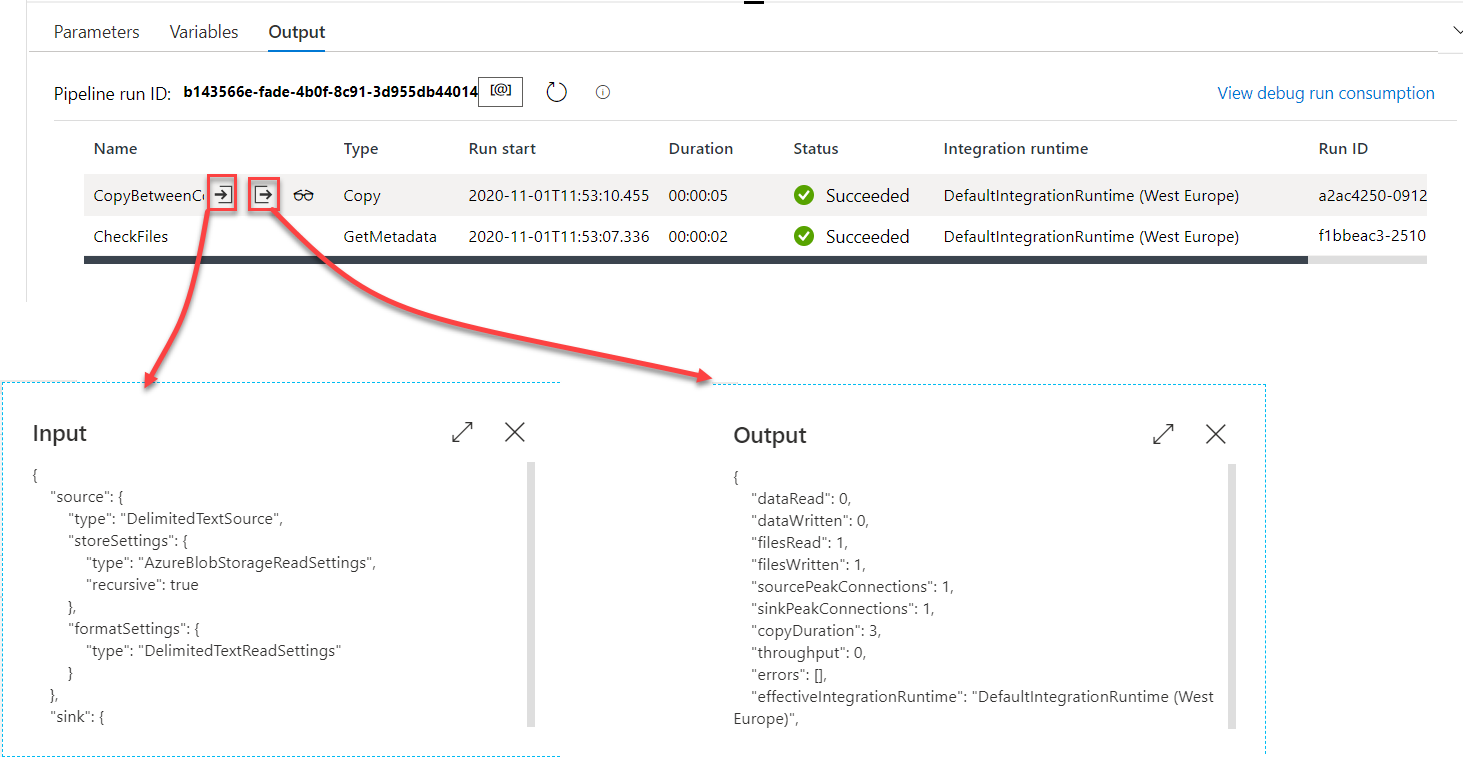
Then the activities will be executed one by one till the pipeline is executed completely. As mentioned previously, the execution result will be displayed in the Output tab of the pipeline, as shown below:
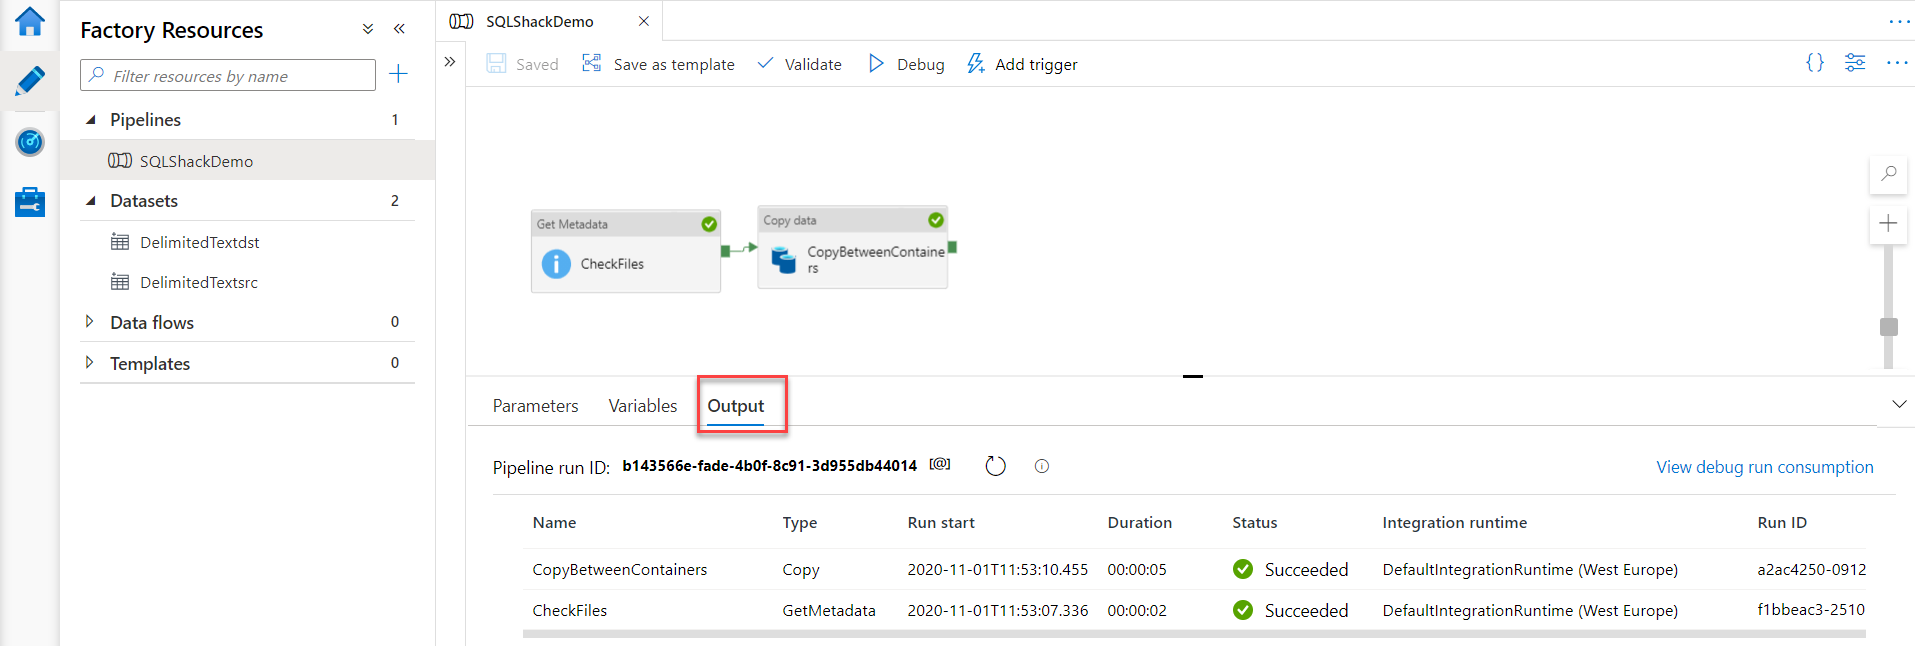
In addition to the Pipeline Run ID, the Output tab provides detailed information about the start time, duration, input, output and execution result of each activity. The Input box will show the activity settings information, in JSON format, whereas the output box will display the execution details of that activity, in JSON format too, as shown below:
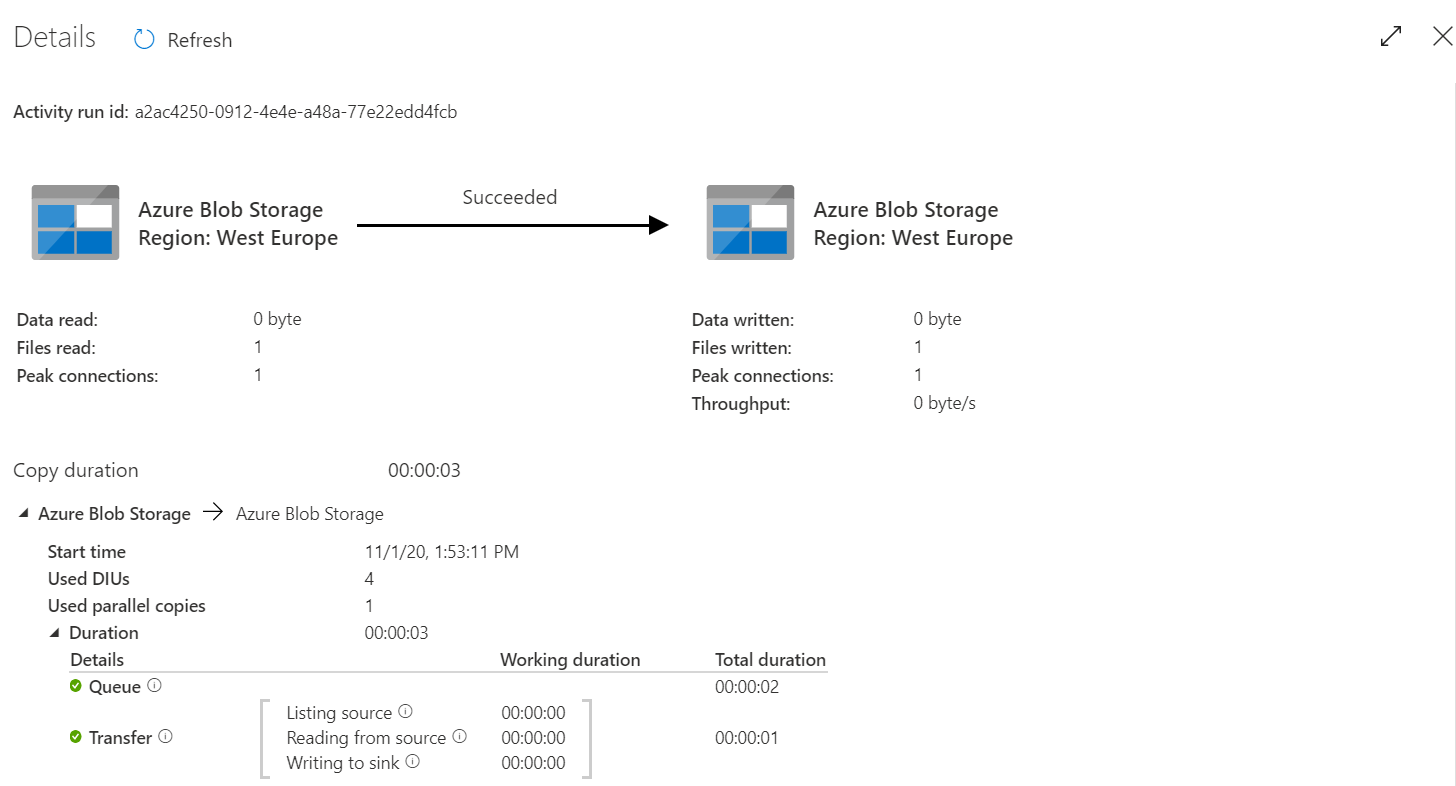
Clicking on the
 button in the Output tab, a graphical execution summary for that pipeline run will be displayed, including statistical information about the data read from the source, written to the sink, the copy result, copy duration, and other useful information that can help to debug the activity functionality and performance, as shown below:
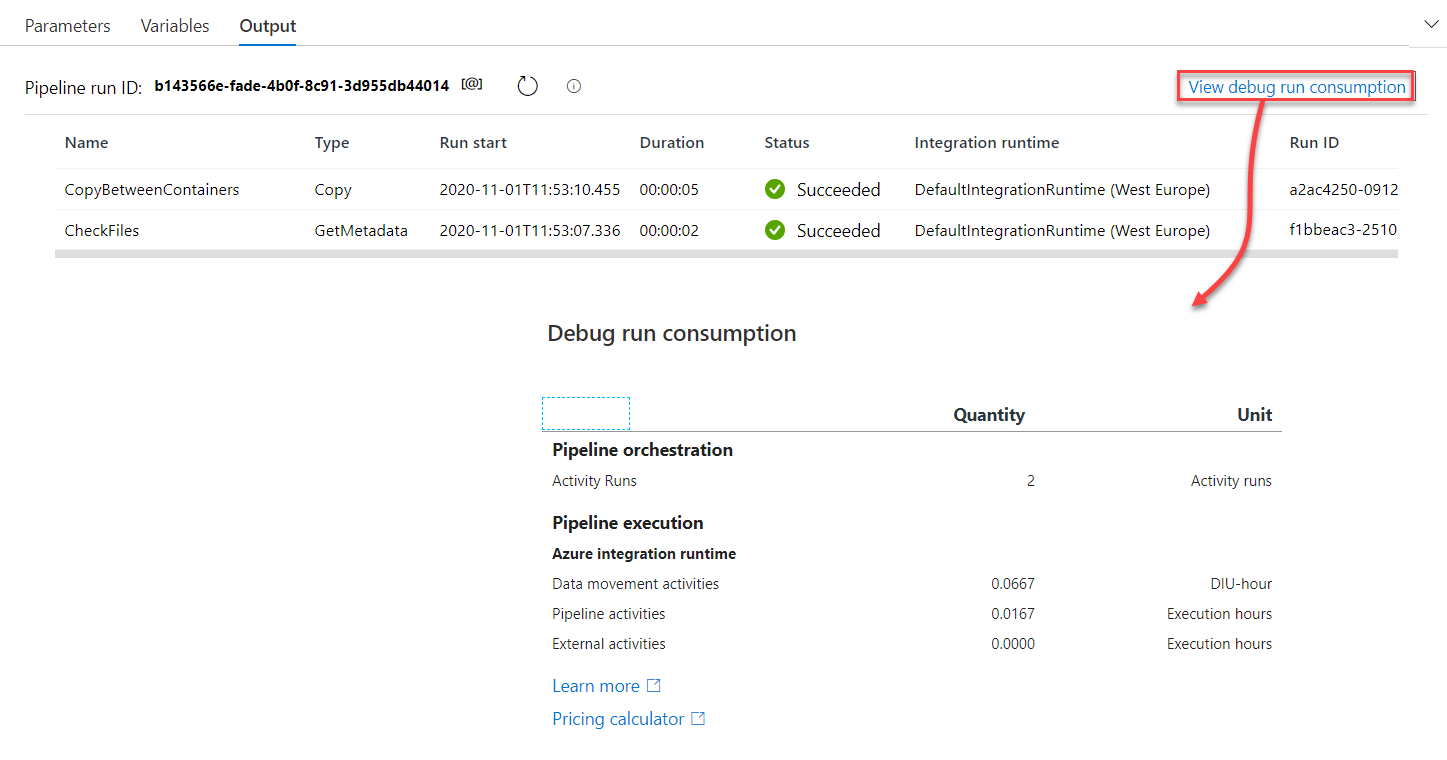
We still have other secrets hidden in the Output tab of the debug mode execution! As we care about the functionality and the performance of the pipeline execution, we also care about the resources that are consumed by this pipeline execution, which help in modifying the pipeline in order to minimize the cost of the pipeline execution, or just to have an estimation for the resources consumption of that pipeline after scheduling it to be executed automatically. This can be checked from the View debug run consumption option, under the Output tab, as shown below:
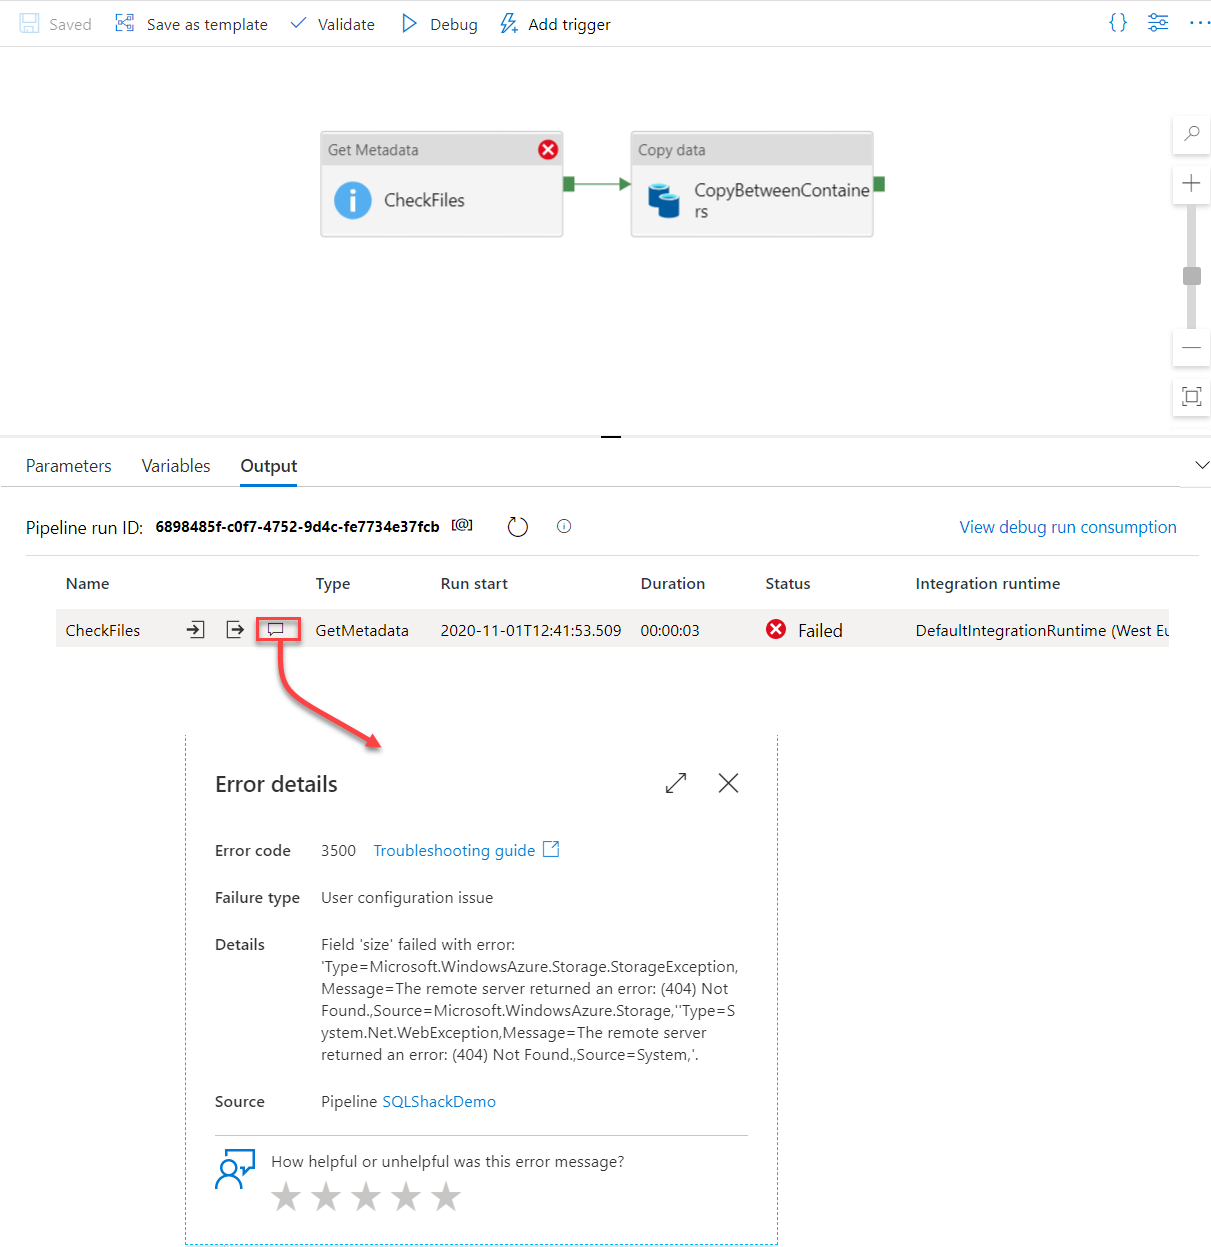
If the pipeline execution failed, a meaningful error message can be checked, beside the failed activity that helps in troubleshooting the cause of the activity failure and fix it directly, as shown below:
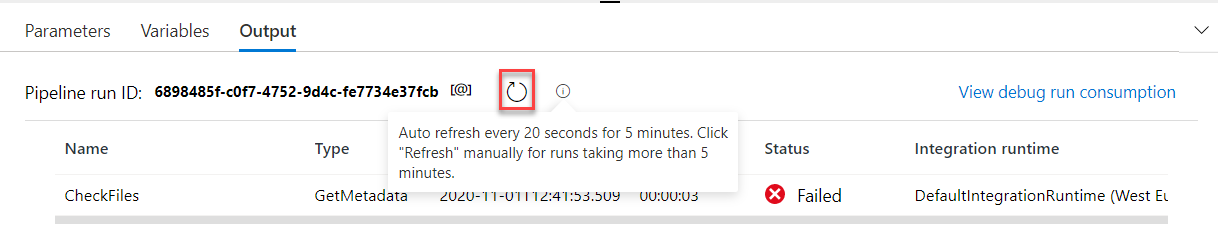
When monitoring the pipeline execution from the Output tab, the result shown in it will be refreshed automatically every 20 seconds and for 5 minutes, with the ability to refresh the result manually by clicking on the Refresh button, as shown below:
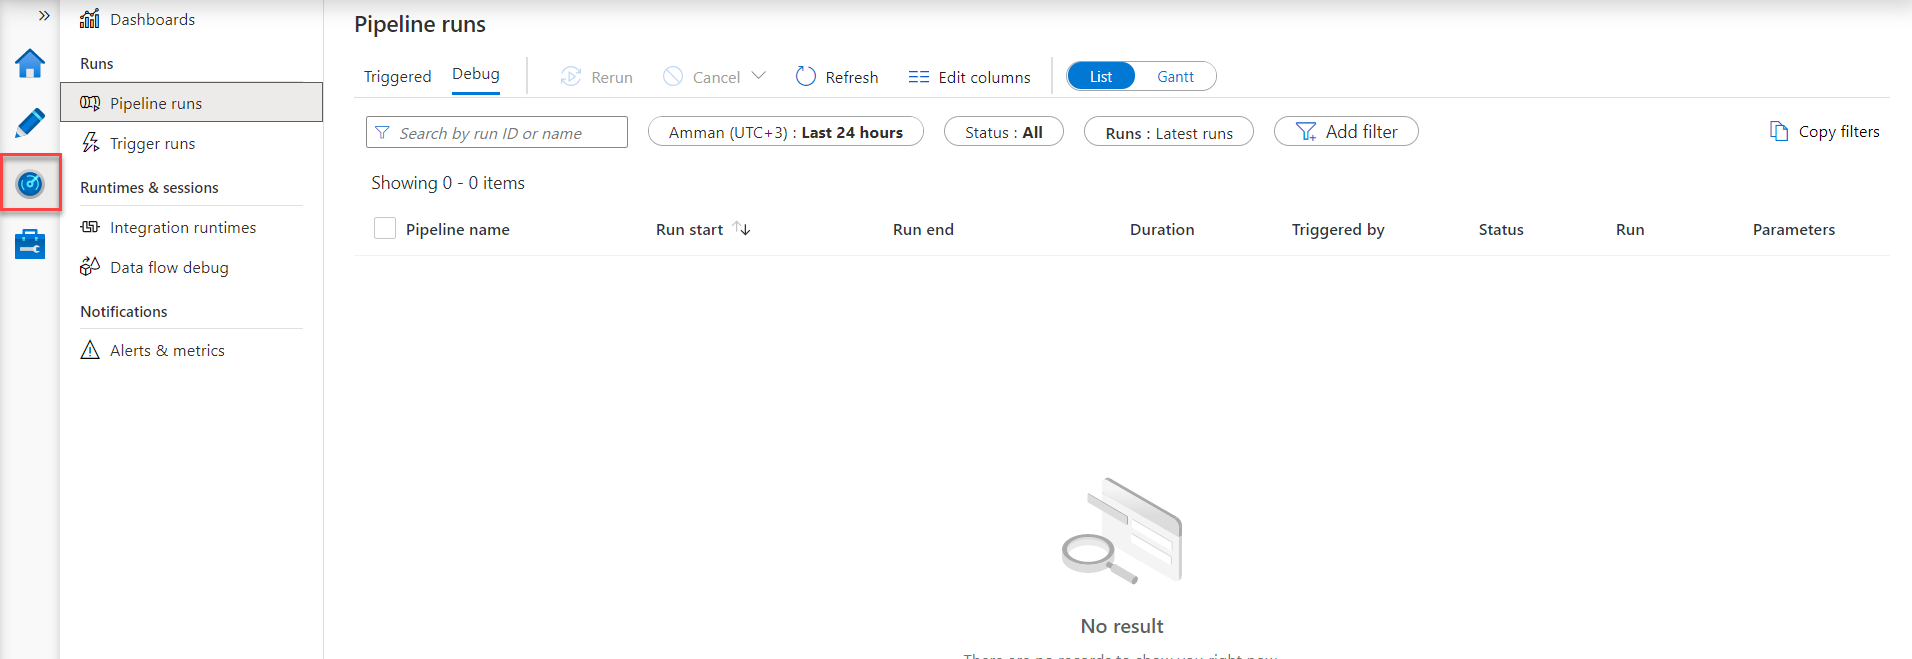
Moving to the Monitor page of the Azure Data Factory and check the pipeline runs, nothing will be displayed, as the pipeline was executed under the debug mode, as shown below:
Debug a Pipeline Activity
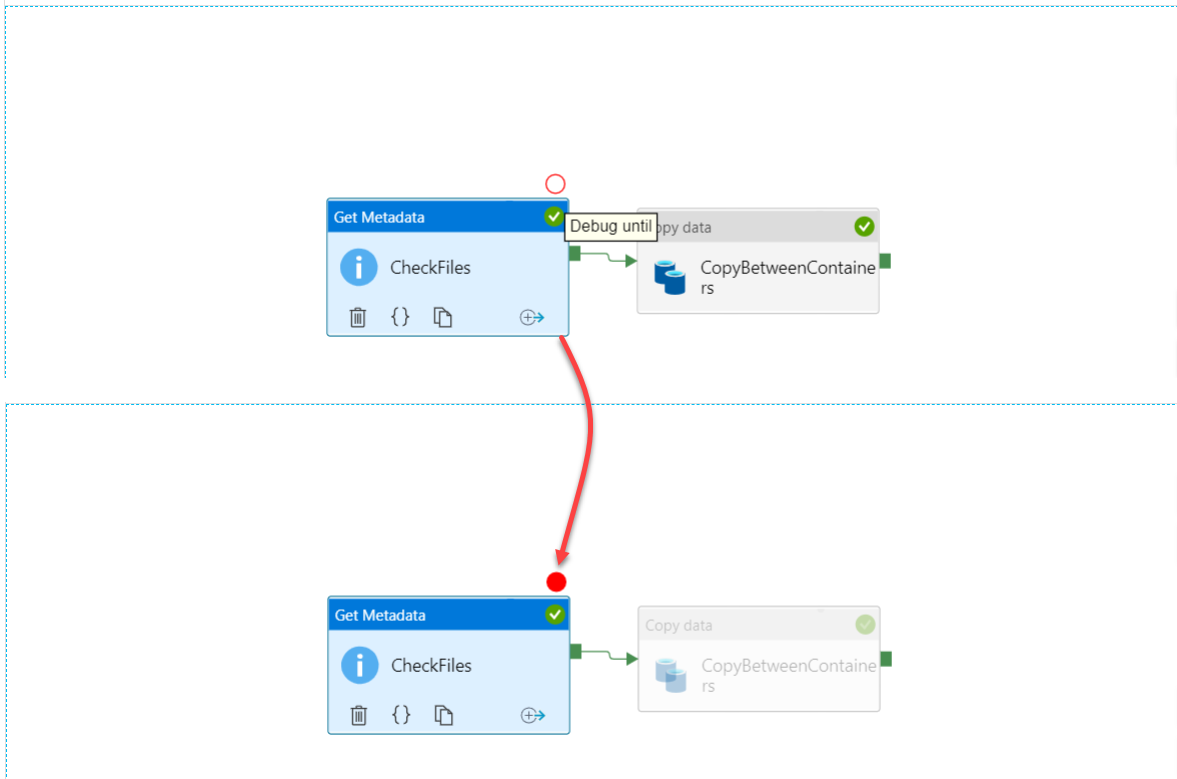
To debug a specific activity, or set of activities, Azure Data Factory provides us with the ability to add a breakpoint to debug the pipeline until you reach a specific activity. For example, to debug the Get Metadata activity only in the previous pipeline, click on that activity and an empty red circle will be displayed. If you click on that red circle, the circle will be changed to a filled red circle, and all activities after that activity will be greyed out, indicating that the pipeline will be executed under the debug mode until that activity, ignoring all activities after the one with a breakpoint, as shown below:
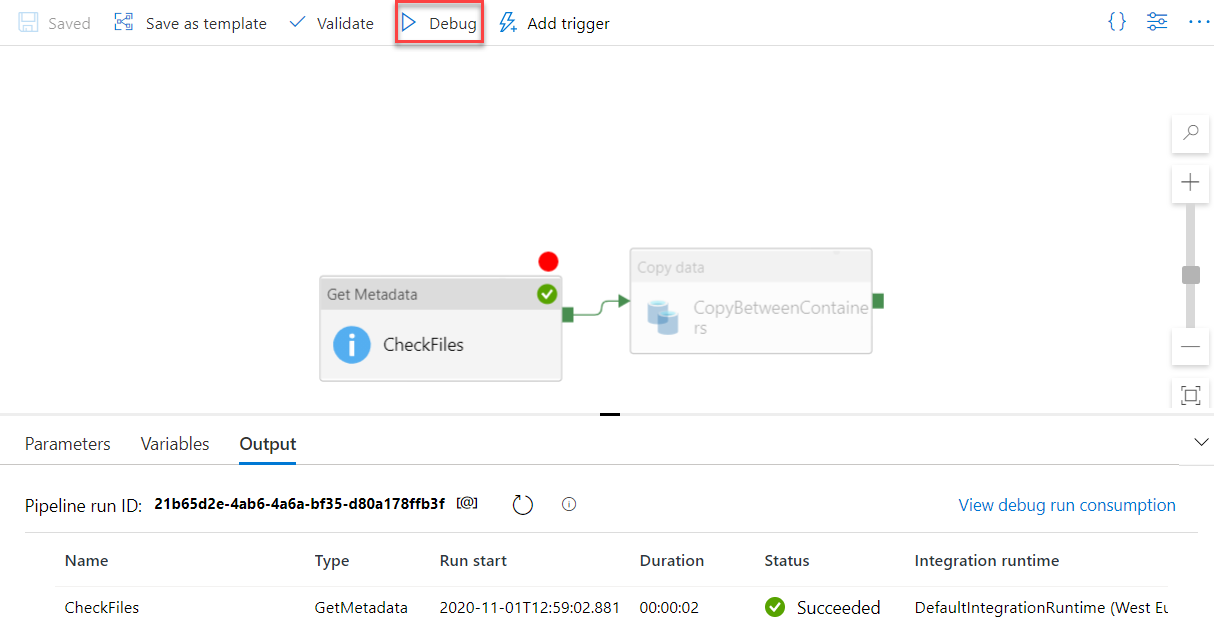
Now, if we click on the Debug button, you will see that the pipeline execution test will be run until that specific activity, ignoring the next copy activity, as shown below:
Removing the breakpoint by clicking again on the filled red circle, the circle will be changed to an empty red circle and the next activities will be enabled and executed in the next debug test.
Debug Data Flow Activity
Mapping data flows in Azure Data Factory provides us with the ability to build a data transformation logic that runs using a just-in-time cluster or your own managed cluster, without the need to develop any code. For more information, check Transform Data using Mapping Data Flow in Azure Data Factory.
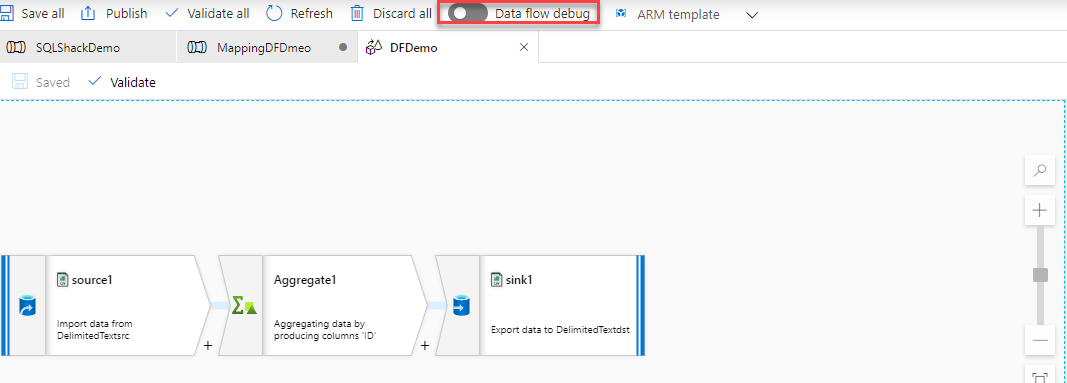
The debug process for the data flow activities differs from the previous scenarios, where it requires first enabling the Data Flow Debug option to start the debug session where you will be able to interact with your data, as shown below:
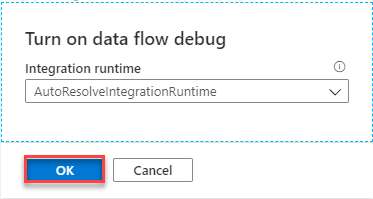
When you enable the Data Flow Debug, it will ask you to select the integration runtime that will be used in your debug session. In our scenario, we will use the AutoResolveIntegrationRuntime, as below:
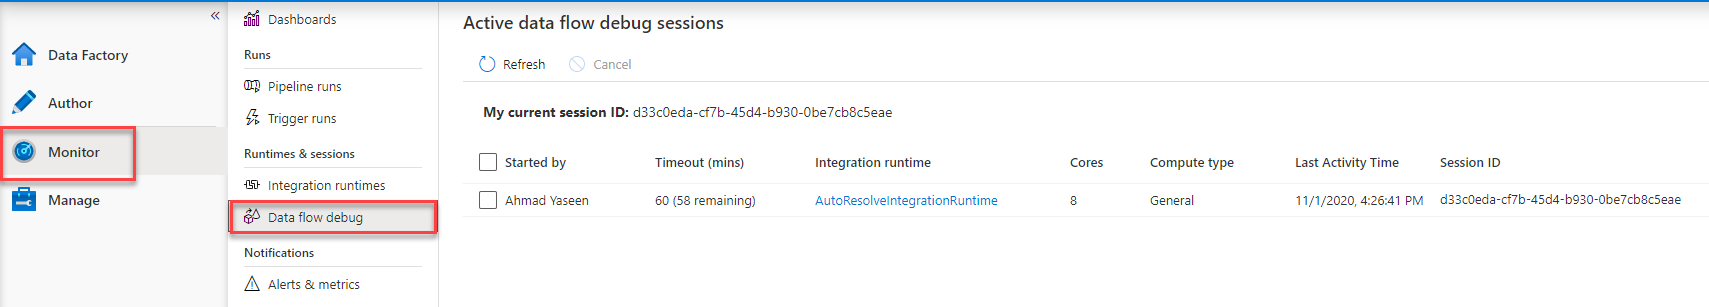
Once the debug mode for the data flow is enabled, an 8 cores cluster will be created to run the debug session with 60 minutes TTL for that session, where the session will be automatically closed when the debug mode is turned off. This active data flow debug session can be checked from the Data Flow Debug tab under the Monitor page, as shown below:
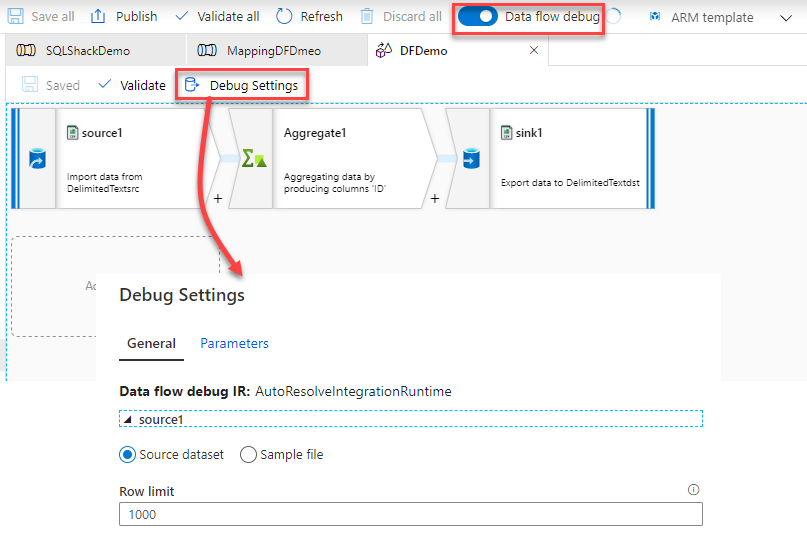
Also, in the Data Flow design under the Author page, a Debug Settings button will be displayed once the Debug Data Flow option is enabled, that allows you to configure a number of options such as the row limits for the debug session and the source of the file that will be used for the source transformation, as below:
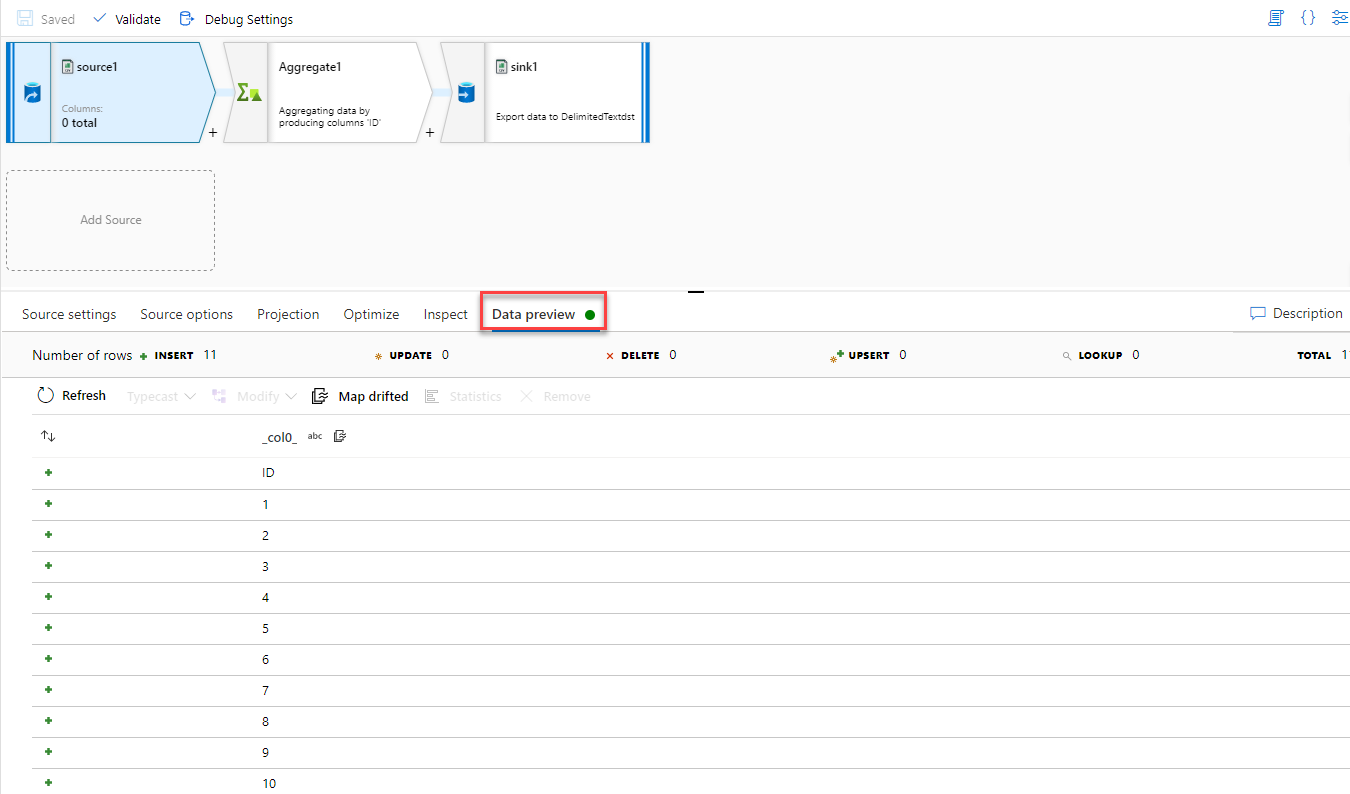
The configured number of rows that we set in the debug settings previously will affect the number of rows that are returned in the Data Preview tab, which will light-up once the Debug Data Flow option is enabled. The Data Preview tab within the debug session will return data from the source dataset that is configured in the selected Azure Data Factory data flow activity or from a sample data file, as shown below:
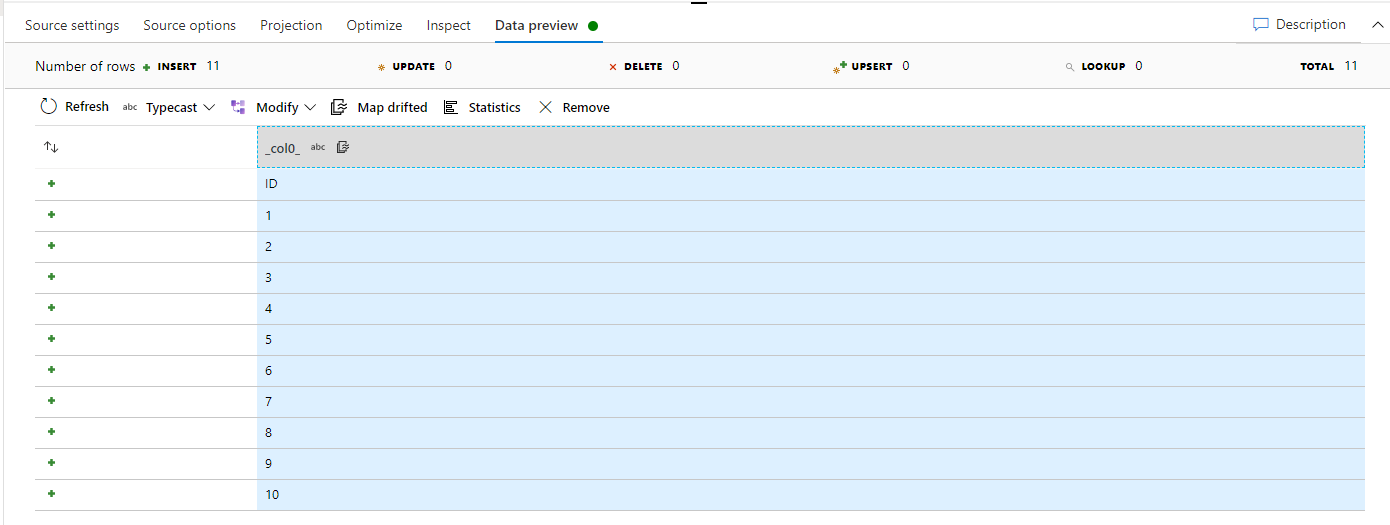
If you click on any column header within the Data Preview tab, a set of options to refresh the data, cast the data type for that column, modify that data or remove that column, will be available for use, as shown below:
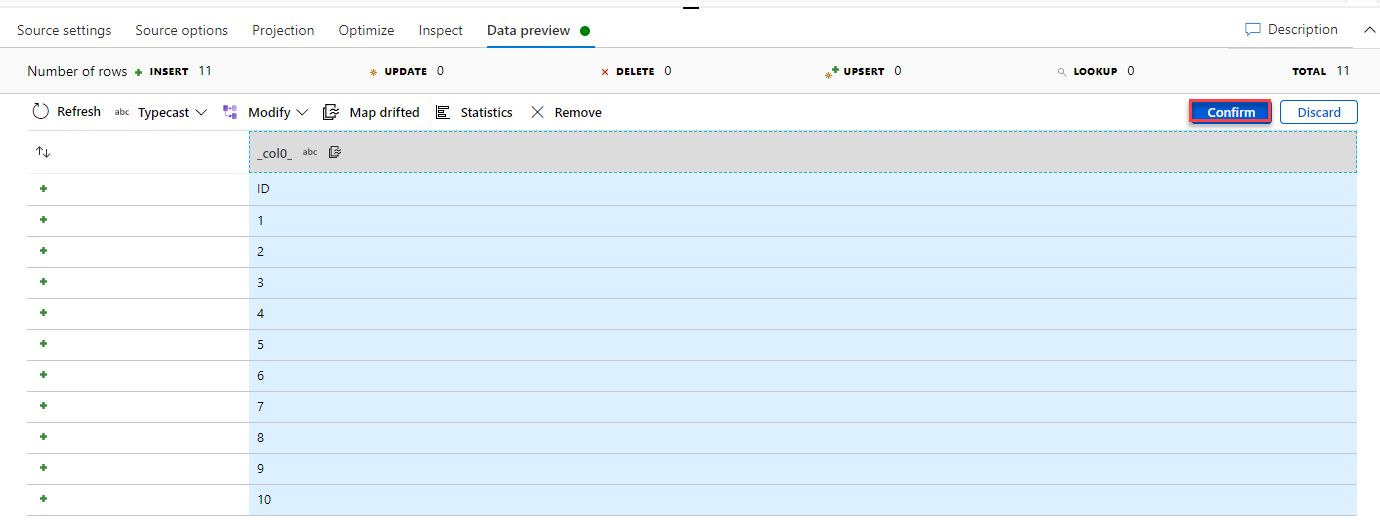
For example, if we click on the ID column below and choose the TypeCast option to change the data type for that column to INT, then click on the Confirm button to proceed, as shown below:
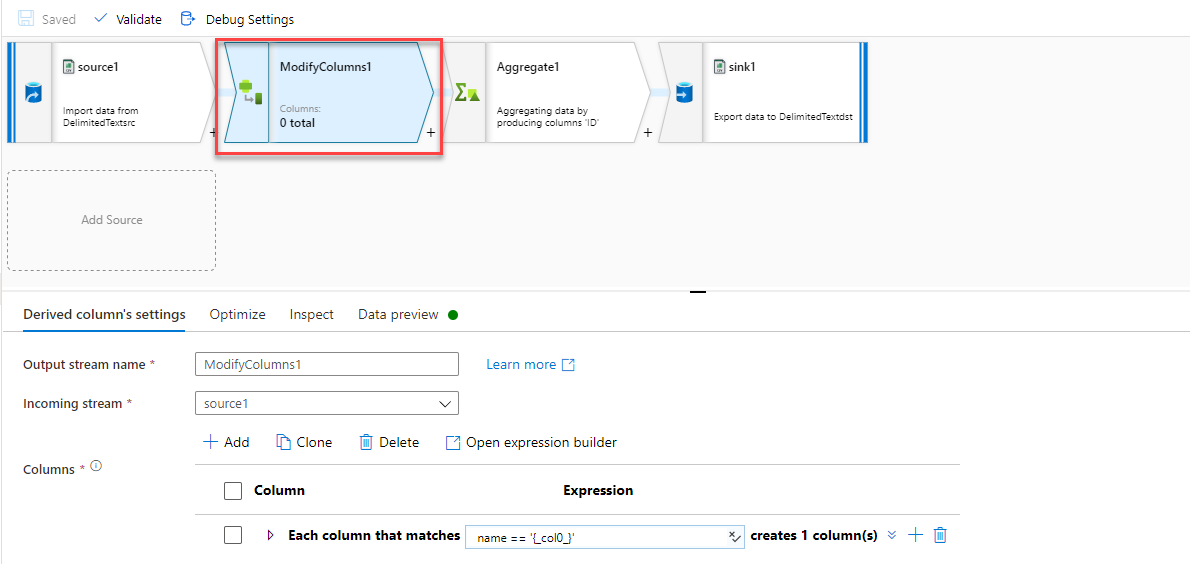
A new Derived Column transformation will be added to convert the data type of that column, as below:
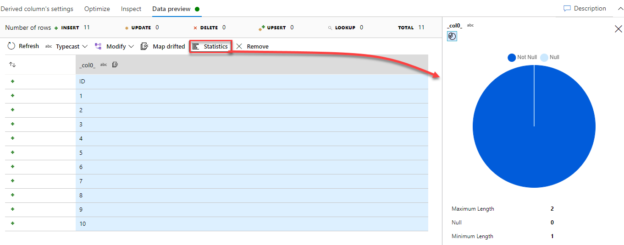
To get statistical data about the data distribution for a specific column within the Data Preview tab, choose the column and click on the Statistics button, where a chart will be displayed, showing the percentage of the Null and Not Null data in the selected column and other useful statistical information as shown below:

Conclusion
You can see from the previous discussion the importance of debugging the Azure Data Factory pipeline using different methods in order to test the pipeline functionality, performance and resource consumption before publishing it to the production environment. Stay tuned for the next Azure Data Factory challenges!
Table of contents

He is a Microsoft Certified Solution Expert in Data Management and Analytics, Microsoft Certified Solution Associate in SQL Database Administration and Development, Azure Developer Associate and Microsoft Certified Trainer.
Also, he is contributing with his SQL tips in many blogs.
View all posts by Ahmad Yaseen
- Azure Data Factory Interview Questions and Answers - February 11, 2021
- How to monitor Azure Data Factory - January 15, 2021
- Using Source Control in Azure Data Factory - January 12, 2021